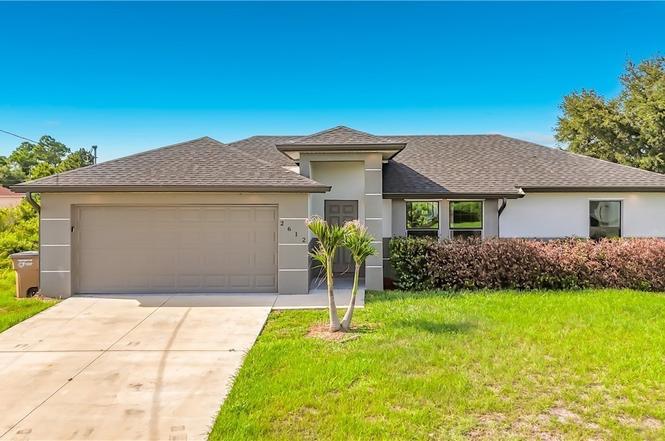
2612 15th St SW · Lehigh Acres, FL
Flood risk 1/10 · Minimal
- FEMA flood zone
- X (unshaded)
- Chance of flooding over 30 yrs
- 0.0%
- Est. flood insurance / yr
- $507 – $1,088
Fire risk 1/10 · Minimal
- Est. fire insurance / yr
- $947 – $1,759
Heat risk 10/10 · Severe
- Hot days now (above 107°F)
- 7 days/yr
- Hot days in 30 yrs
- 29 days/yr
Wind risk 10/10 · Severe
- Chance of severe wind over 30 yrs
- 99.0%
Air-quality risk 2/10 · Minimal
- Unhealthy air days now
- 1 days/yr
- Unhealthy air days in 30 yrs
- 1 days/yr
Risk factors via First Street. Map © Google.
Why this score? — see what drove the F grade
The composite is a weighted blend of 9 inputs, each scored 0–100. Each bar is that input's sub-score; the figure is the points it added to the 100-point composite (weight × sub-score).
- Appreciation +10.0/10.0
- Cash flow +6.5/30.0
- Schools +4.1/10.0
- Livability +3.0/5.0
- Condition / age +2.5/5.0
- Rent growth +2.1/5.0
- ARV discount +1.7/15.0
- 1% rule +1.3/10.0
- DSCR +0.8/10.0
$300,000
🖨 Deal sheet 📄 Offer letter ✓ Due diligence
Listing remarks MLS
BACK ON THE MARKET! PREVIOUS BUYER FINANCING FELL APART. Don't miss this opportunity to own this beautiful home with 3bd, 2ba, 2car garage home! This home boasts beautiful curb appeal, tile throughout, granite counter tops, garage door opener, stainless steel appliances and more! You will love this luxurious modern home located in a nice and quiet area in Lehigh Acres. This home qualifies for 100% VA financing, 3.5% down FHA Financing and we have portfolio/investor financing available for individuals that have trouble qualifying for traditional loans that require 25-35% down. All information is believed to be accurate however, is the buyers and buyer's agent responsibility to do their due diligence. Please note that the photos are of a similar home and may not be an exact representation of the home being built as products and specifications may be changed.
Key facts
- 0.25 acre lot
- 2 garage spots
- Built 2021
Property features AI
Finance
- Financial info: Pets allowed
- HOA & community: Non-gated community; No association fee
Exterior
- Parking: Attached 2-car garage; Driveway; Unpaved parking
- Utilities: Cable available; Septic tank; Well water
- Home design: Single-story home; Faces north; Resale property; Rectangular lot; South exposure
- Construction: Block, concrete and stucco construction; Shingle roof; Built on slab foundation
- Exterior features: Room for pool; Open porch
Interior
- Kitchen: Dishwasher; Microwave; Range; Refrigerator
- Flooring: Tile
- Bathrooms: 2 full bathrooms
- Heating & cooling: Central heating (electric); Central air conditioning (electric)
- Interior features: Vaulted ceilings; Living/dining room; Separate shower; Shower only; Single-hung windows; Unfurnished
- Laundry & utility: Laundry area in garage
Neighborhood map
What this means for you Summary
Snapshot
- This is a 3-bed/2.0-bath single-family listed at $300k.
Deal economics
- At list price, monthly cash flow is $-509 ($-6k/yr) — negative.
- To cash-flow at today's rent, offer at most $210k (30.0% below list).
- To meet the 1% rule (rent ≥ 1% of price), the offer needs to be $188k (37.5% below list).
- Recommended offer: $188k (37.5% below list) — sets the bar for 1% rule.
Location & tenants
- Location reads 59/100 on livability (#826 in FL) — a working-class tenant base; expect higher turnover. Strengths: cost of living A+, housing A+; Watch: crime C-, employment D+, schools D-.
- Lee (suburban): math 47% / reading 50% proficiency, ranked #42 of 73 in FL (top 58%) — families likely to look elsewhere, expect single-tenant / working-renter base with shorter leases.
- Market conditions: Rents soft (-1.5%/yr); 786 active listings in the ZIP; 40 comparable units currently listed for rent nearby; rentals at typical pace (median 24d on market — plan ~3-4 weeks tenant-placement turnaround); 15,411 units permitted in Lee County in 2024 (4,686 in 5+ unit buildings).
- This rent runs 31% of the median local income ($73k/yr) — at the standard rent-burdened threshold; future hikes will face affordability resistance.
Forward outlook
- In year one you build about $32k of equity ($2k loan paydown + $30k appreciation (10.0% local appreciation)).
- Lee County population projected at +44% by 2050 — long-run rental-demand tailwind backs the buy-and-hold thesis.
- By year 2, paydown + projected appreciation supports a ~$52k cash-out refi (75% LTV) — recoverable capital for the next deal without selling this one.
Negotiation context
- Only 8 days on market — expect competitive offers; lowballing is unlikely to land.
- 6 sale attempts since 21y ago with the ask held roughly flat each time — persistent listings suggest the price (not the market) is what's stuck; bring a comps-based counter.
Risks & watch-outs
- Climate carrying-cost: severe wind risk, 99% chance of damaging wind over 30y; extreme-heat days projected 7→29/yr by 2055 (HVAC capex compounding) — expect insurance premiums to compound above CPI over the hold.
Questions for the listing agent
- What do current leases actually rent for vs. the listed asking? Can we see a recent rent roll and the last 12 months of T-12 income?
- Is there a deadline driving the sale (1031 exchange, divorce, estate, relocation)? That informs how much negotiation room exists.
- Schools are D-rated, which usually means shorter tenancies and higher turnover. Who's the typical renter profile here, and what's been the actual vacancy rate?
- The area grade is low — what's the realistic commute time and amenity access for the typical tenant pool here? Any planned neighborhood developments (good or bad) we should know about?
- What's the average days-on-market for RENTAL listings here right now (not sales)? A rising rental-DOM trend means longer vacancies and softer asking-rent achievability than the comps imply.
- What's the recent tenant-quality profile in this submarket — average credit score on applications, eviction rate, late-payment / NSF rate, and stable-employment percentage? A property-management company in the area should have these aggregated.
- How much new for-sale + rental construction is in the pipeline within 1–3 miles? Heavy new supply typically softens prices + rents 12–24 months out; constrained supply supports both.
Investment metrics
- 1% rule
- 0.63% ✗
- Cap rate
- 4.26%
- Cash-on-cash
- -7.27%
- DSCR
- 0.68
- GRM
- 13.3
CMA / ARV
- ARV (on-the-fly)
- $265,863
- Comps found
- 12
Show comp detail 12 sales within ~0.75 mi
| Address | Dist | Beds/Ba | Sqft | Sold | Price | $/sf | Match |
|---|---|---|---|---|---|---|---|
| 2616 14th St SW | 0.07mi | 3/2.0 | 1,154 (-4%) | 0mo | $220,000 | $191 | 90 |
| 1642 Cheshire Cir N | 0.42mi | 3/2.0 | 1,224 (+2%) | 9mo | $259,900 | $212 | 70 |
| 2507 26th St | 0.73mi | 3/2.0 | 1,224 (+2%) | 2mo | $258,000 | $211 | 62 |
| 9712 Maplecrest Cir | 0.73mi | 2/2.0 (-1) | 1,220 (+1%) | 1mo | $180,000 | $148 | 58 |
| 2519 22nd St SW | 0.47mi | 3/3.0 | 1,075 (-11%) | 1mo | $309,000 | $287 | 55 |
| 2605 10th St SW | 0.28mi | 3/2.0 | 1,365 (+14%) | 12mo | $305,000 | $223 | 54 |
| 2919 9th St SW | 0.63mi | 3/2.0 | 1,314 (+9%) | 2mo | $290,000 | $221 | 54 |
| 3015 12th St SW | 0.68mi | 3/2.0 | 1,280 (+6%) | 13mo | $300,000 | $234 | 47 |
| 300 Anita Ave S | 0.73mi | 3/2.0 | 1,326 (+10%) | 5mo | $225,000 | $170 | 44 |
| 204 Norwich Ave | 0.67mi | 3/2.0 | 1,322 (+10%) | 12mo | $235,000 | $178 | 42 |
| 1425 Alwynne Dr | 0.70mi | 2/2.0 (-1) | 1,096 (-9%) | 13mo | $248,000 | $226 | 37 |
| 2706 25th St SW | 0.63mi | 4/2.0 (+1) | 1,373 (+14%) | 14mo | $350,000 | $255 | 30 |
Match score weights: distance 35% · size 25% · config 20% · recency 20%. Top-matched comps best support the ARV.
Projected returns pro-forma
10.0% appreciation · 0.0% rent growth · sell at horizon
- IRR
- 18.4%
- Equity multiple
- 2.49×
- Total profit
- $125,469
- Equity at exit
- $270,264
- IRR
- 16.7%
- Equity multiple
- 5.58×
- Total profit
- $385,080
- Equity at exit
- $582,834
Cash invested: $84,000 (down + closing). Projections, not guarantees.
Landlord ↔ Tenant lean methodology
- Overall (STATE)
- 87 Strongly Landlord-Friendly
- State Florida
- 87 Strongly Landlord-Friendly · R+3
- County
- — inherits STATE
- City
- — inherits STATE
ZIP-level market 33976
- Home prices YoY
- 6.8%
- Rents YoY
- -1.5%
- Active inventory
- 786
- Price-to-rent
- 13.3×
Monthly cashflow live
- Estimated rent
- $1,875 high interval (Pro) →
- Mortgage (P&I)
- −$1,573
- Tax from tax record
- −$292 /mo · $3,504/yr
- Insurance
- −$125
- HOA
- −$0
- Vacancy / Maint / Mgmt
- −$394
- Net cashflow
- $-509
Break-even live
UW: 25.0% down · 7.5% · 30yr · 1.5% tax · 5.0% vac · 8.0% maint · 8.0% mgmt
Financing live
Cash to close
- Down payment
- $75,000
- Closing costs
- $9,000
- Reserves months
- —
- Total cash needed
- —
Loan-product check · same deal, 3 products live
Conventional
25% down · 7.5% · 30yr
- Down + closing
- —
- Monthly P&I
- —
- Monthly cashflow
- —
- DSCR
- —
- Eligible?
- —
Personal DTI + credit; lowest rate.
DSCR
20% down · 8.5% · 30yr
- Down + closing
- —
- Monthly P&I
- —
- Monthly cashflow
- —
- DSCR
- —
- Eligible?
- —
No personal income docs; deal must DSCR.
Hard money
10% down · 12.0% · 12mo
- Down + closing
- —
- Monthly P&I
- —
- Monthly cashflow
- —
- DSCR
- —
- Eligible?
- —
Short-term bridge; refi at stabilization.
Rent comps 40 comps
| Address | Beds | Baths | Sqft | Rent | $/sqft | DOM | Units | Dist |
|---|---|---|---|---|---|---|---|---|
| 2805 20th St SW Lehigh Acres, FL | 3.0 | 2.0 | 1151 | $1,699 | $1.48 | 2d | 1 | 0.39mi |
| 2909 15th St SW Lehigh Acres, FL | 3.0 | 2.0 | 1291 | $1,800 | $1.39 | 21d | 1 | 0.46mi |
| 2602 24th St SW Lehigh Acres, FL | 3.0 | 2.0 | 1358 | $1,800 | $1.33 | 3d | 1 | 0.56mi |
| 1423 Caywood Cir S Lehigh Acres, FL | 2.0 | 2.0 | 960 | $1,376 | $1.43 | 3d | 1 | 0.62mi |
| 10 Beth Stacey Blvd #206 Lehigh Acres, FL | 2.0 | 2.0 | 1012 | $1,100 | $1.09 | 3d | 1 | 0.68mi |
| 2916 7th St SW Lehigh Acres, FL | 3.0 | 2.0 | 1357 | $1,900 | $1.40 | 23d | 1 | 0.68mi |
| 28 Cosmopolitan Dr #13 Lehigh Acres, FL | 2.0 | 2.0 | 973 | $1,375 | $1.41 | 14d | 1 | 0.70mi |
| 2811 25th St SW Unit NA Lehigh Acres, FL | 3.0 | 2.0 | 1430 | $1,990 | $1.39 | 23d | 1 | 0.72mi |
| 59 Camelot Gardens Blvd #110 Lehigh Acres, FL | 2.0 | 2.0 | 1166 | $1,800 | $1.54 | 23d | 1 | 0.73mi |
| 18461 Copperhead Dr #436 Lehigh Acres, FL | 2.0 | 2.0 | 1154 | $3,495 | $3.03 | 23d | 1 | 0.76mi |
| 18461 Copperhead Dr #431 Lehigh Acres, FL | 3.0 | 2.0 | 1301 | $3,995 | $3.07 | 23d | 1 | 0.76mi |
| 18461 Copperhead Dr #421 Lehigh Acres, FL | 3.0 | 2.0 | 1301 | $1,895 | $1.46 | 23d | 1 | 0.76mi |
| 18451 Copperhead Dr #522 Lehigh Acres, FL | 2.0 | 2.0 | 1120 | $1,895 | $1.69 | 23d | 1 | 0.78mi |
| 111 Yellowtail Loop #3 Lehigh Acres, FL | 2.0 | 2.0 | 1100 | $1,750 | $1.59 | 23d | 1 | 0.79mi |
| 3103 11th St SW Lehigh Acres, FL | 3.0 | 2.0 | 1212 | $1,800 | $1.49 | 23d | 1 | 0.82mi |
| 219 Beth Stacey Blvd Lehigh Acres, FL | 2.0 | 2.0 | 997 | $1,300 | $1.30 | 21d | 1 | 0.87mi |
| 1507 Markdale St E Lehigh Acres, FL | 2.0 | 1.0 | 997 | $1,300 | $1.30 | 3d | 1 | 0.89mi |
| 9099 Aegean Cir Lehigh Acres, FL | 2.0 | 2.0 | 1120 | $1,499 | $1.34 | 23d | 1 | 0.89mi |
| 18266 Minorea Ln Lehigh Acres, FL | 3.0 | 2.0 | 1408 | $1,650 | $1.17 | 23d | 1 | 0.91mi |
| 18261 Minorea Ln Lehigh Acres, FL | 2.0 | 2.0 | 1402 | $1,595 | $1.14 | 3d | 1 | 0.91mi |
| 18261 Minorea Ln Lehigh Acres, FL | 2.0 | 2.0 | 1402 | $1,800 | $1.28 | 23d | 1 | 0.91mi |
| 18421 Copperhead Dr #222 Lehigh Acres, FL | 2.0 | 2.0 | 1154 | $1,700 | $1.47 | 23d | 1 | 0.93mi |
| 312 Grovewood Ave S Lehigh Acres, FL | 2.0 | 2.0 | 1325 | $1,800 | $1.36 | 23d | 1 | 0.93mi |
| 9112 Aegean Cir Lehigh Acres, FL | 3.0 | 2.0 | 1409 | $1,600 | $1.14 | 3d | 1 | 0.93mi |
| 18303 Gibraltar Ln Lehigh Acres, FL | 4.0 | 2.0 | 1203 | $1,549 | $1.29 | 14d | 1 | 0.94mi |
| 18303 Gibraltar Ln Lehigh Acres, FL | 4.0 | 2.0 | 1203 | $1,599 | $1.33 | 23d | 1 | 0.94mi |
| 9123 Aegean Cir Lehigh Acres, FL | 2.0 | 2.0 | 1120 | $1,474 | $1.32 | 2d | 1 | 0.95mi |
| 18411 Copperhead Dr #346 Lehigh Acres, FL | 2.0 | 2.0 | 1061 | $1,695 | $1.60 | 21d | 1 | 0.95mi |
| 9131 Aegean Cir Lehigh Acres, FL | 3.0 | 2.0 | 1400 | $1,574 | $1.12 | 21d | 1 | 0.97mi |
| 9131 Aegean Cir Lehigh Acres, FL | 3.0 | 2.0 | 1400 | $1,574 | $1.12 | 23d | 1 | 0.97mi |
| 3202 21st St SW Lehigh Acres, FL | 3.0 | 2.0 | 1100 | $1,920 | $1.75 | 2d | 1 | 0.98mi |
| 18321 Gibraltar Ln Lehigh Acres, FL | 4.0 | 2.0 | 1203 | $1,675 | $1.39 | 23d | 1 | 0.98mi |
| 18461 Copperhead Ct N #444 Lehigh Acres, FL | 2.0 | 2.0 | 1120 | $2,300 | $2.05 | 23d | 1 | 0.98mi |
| 18461 Copperhead Dr Unit 1546499P Lehigh Acres, FL | 2.0 | 2.0 | 1194 | $1,941 | $1.63 | 13d | 1 | 0.98mi |
| 9137 Aegean Cir Lehigh Acres, FL | 2.0 | 2.0 | 1120 | $1,474 | $1.32 | 23d | 1 | 0.98mi |
| 9137 Aegean Cir Lehigh Acres, FL | 2.0 | 2.0 | 1120 | $1,474 | $1.32 | 3d | 1 | 0.98mi |
| 2612 31st St Lehigh Acres, FL | 4.0 | 2.0 | 1389 | $1,799 | $1.30 | 15d | 1 | 0.98mi |
| 2612 31st St Lehigh Acres, FL | 4.0 | 2.0 | 1365 | $1,799 | $1.32 | 13d | 1 | 0.98mi |
| 9161 Aegean Cir Lehigh Acres, FL | 2.0 | 2.0 | 1120 | $1,650 | $1.47 | 13d | 1 | 1.02mi |
| 18451 Copperhead Ct N #535 Lehigh Acres, FL | 2.0 | 2.0 | 1130 | $4,950 | $4.38 | 23d | 1 | 1.02mi |
Listing history 6 events
-
2026-06-18days on market $300,000 Active 8 DOM
-
2026-06-17days on market $300,000 Active 7 DOM
-
2026-06-16days on market $300,000 Active 6 DOM
-
2026-06-15days on market $300,000 Active 5 DOM
-
2026-06-13remarks 699-char remark
-
2026-06-13$300,000 Active 3 DOM
ⓘ Source: listings_history table (triggers on properties + properties_extension) + one-shot
backfill from property_details.listing_events for pre-trigger history.
Tax reassessment forecast FL · Resets to sale price
- Current annual tax
- $3,504 · $292/mo
- Projected year-2 tax
- $3,504 · $292/mo
- Expected delta
- $0/yr ($0/mo · 0.0%)
ⓘ Screening estimate from a state-policy table — verify with the county assessor before closing.
Climate risk First Street
- Flood 1/10 Low FEMA zone X (unshaded) · 0% chance over 30 yrs
- Wildfire 1/10 Low
- Heat 10/10 Extreme 7 d/yr ≥107°F today · 29 d/yr by 30 yrs out
- Wind 10/10 Extreme 99% chance of damaging wind over 30 yrs
- Air quality 2/10 Low 1 unhealthy d/yr today · 1 by 30 yrs out
Nearby sold comps map
Loading sold comps map…
Walkable amenities ~0.75 mi
Loading nearby amenities…
Taxation est. · year 1
- Rental income
- $22,504
- − Mortgage interest
- −$16,805
- − Property taxes
- −$3,504
- − Insurance
- −$1,500
- − Repairs & maintenance
- −$1,800
- − Management
- −$1,800
- − Depreciation
- −$8,727
- Taxable loss
- −$11,632
- Est. tax savings @ 24.0%
- +$2,792
- After-tax cash flow
- $-3,313/yr
For passive investors: Depreciation is non-cash, so a rental often shows a tax loss while cash-flowing — sheltering income. Rental losses are passive: they offset passive income freely, and up to $25,000/yr can offset ordinary (W-2) income if you actively participate and your MAGI is under $100k (phasing out to $0 by $150k); unused losses carry forward. On sale, claimed depreciation is recaptured at up to 25%, and gains may owe capital-gains tax (a 1031 exchange can defer both). Figures are a year-1 estimate at your 24.0% rate — not tax advice; consult a CPA.
Schools (NCES district)
- District
- Lee
- NCES district ID
- 1201080
- Math proficiency
- 47% ▼ -11.00%
- Reading proficiency
- 50% ▼ -4.00%
- Median HH income
- $49,518
- Composite
- 41.49/100
- National rank
- #3458
- State rank
- #42 of 73 in FL
Livability — Lehigh Acres
- Score
- 59/100
- State rank
- #826
- US rank
- #20055
Category grades
Schools grade is shown separately in the Schools card above.
Census & demographics
- Census place
- Lehigh Acres, FL
- County
- Lee County · 788,662 people
- City population
- 130,638
- Metro
- Cape Coral-Fort Myers, FL
- Population (ZIP)
- 20,277
- Household income
- $72,679
- Rent vs Own
- Severe rent burden
- 574.0
Population outlook (Lee County) Hauer SSP2
- Today (2025)
- 871,946 people
- By 2030
- 955,468 · +9.6%
- By 2040
- 1,113,587 · +27.7%
- By 2050
- 1,256,891 · +44.1%
- By 2075
- 1,560,270 · +78.9%
- By 2100
- 1,726,848 · +98.0%
Race, ethnicity, and origin ACS 2023
- Neighborhood character
- Diverse neighborhood (Simpson 0.65)
- Race & ethnicity
- Hispanic / Latino 50% Two or more races 30% White 24% Black 20% Asian 3%
- Hispanic origin (detail)
- Mexican 8% Puerto Rican 8% Cuban 18% Dominican 4%
- Common ancestry
- Hispanic 8% Slovak 1% Lithuanian 1%
- Foreign-born
- 35% · Canada, Jamaica, Vietnam
- Languages at home
- 46% English-only · Spanish 43% French/Haitian/Cajun 8% Vietnamese 1%
Political lean MEDSL · Lee
- 2024 margin
- Strong R (+28.4) · D 35.5% · R 63.9%
- 2008→2024 swing
- -18.0pp toward R · 2008: -10.4pp · 2024: -28.4pp
- All cycles
- 2024: R+28.4 2020: R+19.2 2016: R+20.4 2012: R+16.6 2008: R+10.4
Not yet ingested
- Civics
- —
Market trends
- HPI YoY
- ▲ 21.77%
- Current HPI
- 340.4255
- Rent YoY
- ▼ -1.54%
- Metro
- Cape Coral-Fort Myers, FL
- State GDP YoY
- ▲ 3.28%
- F500 in state
- 36
Industry mix (Fortune 500 HQ in FL)
| Industry | F500 HQs | Revenue |
|---|---|---|
| Industrial Technology | 2 | $29B |
|
||
| Insurance | 2 | $17B |
|
||
| Retail | 1 | $60B |
|
||
| Technology Distribution | 1 | $58B |
|
||
| Homebuilding | 1 | $35B |
|
||
| Technology Manufacturing | 1 | $35B |
|
||
Price history
+368.8% since first listed16 events — show timeline
- 2026-06-09 Listed $300,000 FORTMLS
- 2022-03-15 Sold (Public Records) $265,000 Public Records
- 2022-03-04 Sold (MLS) $265,000 FORTMLS
- 2021-12-15 Pending — FORTMLS
- 2021-12-02 Relisted — FORTMLS
- 2021-12-01 Price Changed $259,900 FORTMLS
- 2021-08-12 Pending — FORTMLS
- 2021-07-23 Relisted — FORTMLS
- 2021-05-12 Pending — FORTMLS
- 2021-04-17 Listed $239,900 FORTMLS
- 2020-09-04 Sold (MLS) $6,500 FORTMLS
- 2020-08-18 Pending — FORTMLS
- 2020-07-28 Listed $8,000 FORTMLS
- 2013-09-21 Listing Removed — Beaches MLS
- 2011-05-13 Sold (Public Records) $300 Public Records
- 2005-08-09 Listed $64,000 Beaches MLS
Property tax history
+42.7%/yrLatest (2025): $3,504 · -5.6% YoY. Source: county tax records.
Cash-flow waterfall
monthlySold comps — $/sqft
last 12 mo · ≤1 miLoading sold comps…