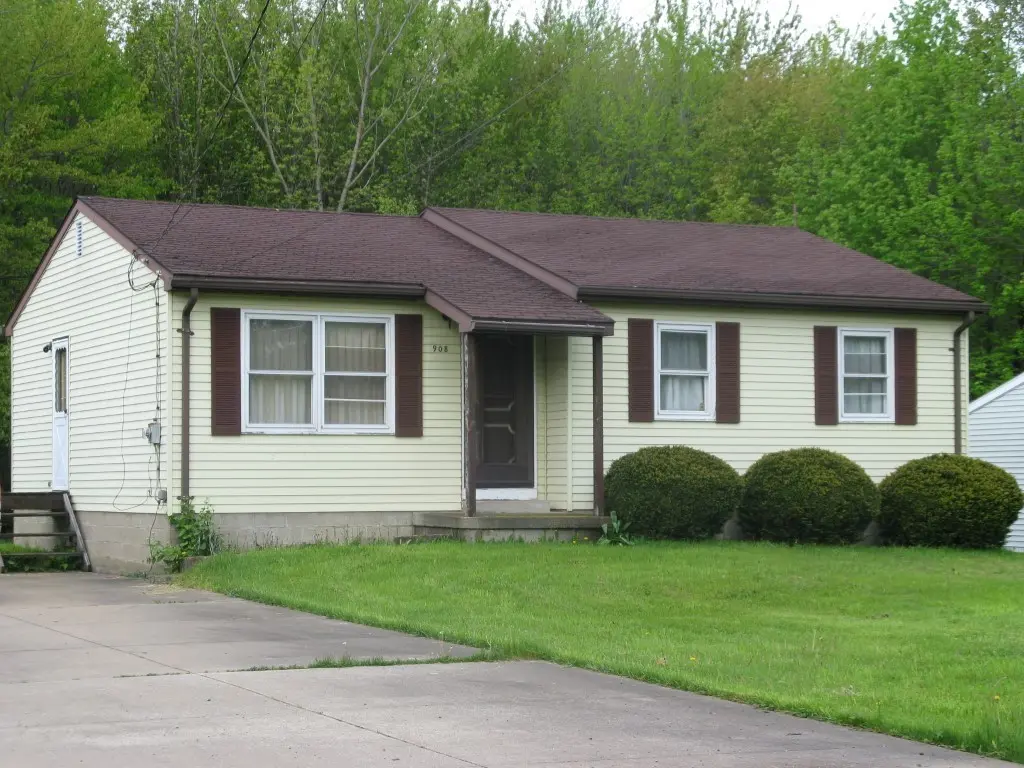
908 Walbridge Rd · Northwest Harborcreek, PA
Flood risk 1/10 · Minimal
- FEMA flood zone
- X (unshaded)
- Chance of flooding over 30 yrs
- 0.0%
- Est. flood insurance / yr
- $473 – $860
Fire risk 1/10 · Minimal
- Est. fire insurance / yr
- $511 – $949
Heat risk 2/10 · Minimal
- Hot days now (above 90°F)
- 7 days/yr
- Hot days in 30 yrs
- 17 days/yr
Wind risk 1/10 · Minimal
- Chance of severe wind over 30 yrs
- —
Air-quality risk 3/10 · Minor
- Unhealthy air days now
- 4 days/yr
- Unhealthy air days in 30 yrs
- 4 days/yr
Risk factors via First Street. Map © Google.
Why this score? — see what drove the B grade
The composite is a weighted blend of 9 inputs, each scored 0–100. Each bar is that input's sub-score; the figure is the points it added to the 100-point composite (weight × sub-score).
- Cash flow +30.0/30.0
- 1% rule +10.0/10.0
- DSCR +10.0/10.0
- ARV discount +7.5/15.0
- Schools +5.5/10.0
- Livability +4.5/5.0
- Rent growth +2.5/5.0
- Condition / age +2.5/5.0
- Appreciation +0.0/10.0
$79,900
🖨 Deal sheet 📄 Offer letter ✓ Due diligence
Key facts
- 0.24 acre lot
- Built 1981
Neighborhood map
What this means for you Summary
Snapshot
- This is a 3-bed/1.0-bath single-family listed at $80k.
Deal economics
- At list price, monthly cash flow is $410 ($5k/yr) — positive.
- The deal already cash-flows at list — no discount required.
- Meets the 1% rule at list price ($1k rent vs $80k).
- Cap rate 12.5% vs local median 2.3% in Northwest Harborcreek — top-decile yield for the area; either an underpriced asset or a hidden risk that comps aren't pricing in. Stress-test before assuming the spread holds.
Location & tenants
- Location reads 89/100 on livability (#25 in PA, #149 nationally) — a professional / high-income tenant draw. Strengths: amenities A+, commute A+, cost of living A+; Watch: schools D.
- Harbor Creek SD (suburban): math 54% / reading 73% proficiency, ranked #53 of 539 in PA (top 10%) — acceptable for families but not a draw, mixed tenant base, ~2y average lease.
- Market conditions: 48 active listings in the ZIP; 2 comparable units currently listed for rent nearby; 364 units permitted in Erie County in 2024 (188 in 5+ unit buildings).
Forward outlook
- Local home prices are declining (-3.0%/yr); year-one equity from $552 of loan paydown is wiped out by about $2k of value loss. Plan a longer hold.
- Erie County population projected at -14% by 2050 — secular population decline; favor cash flow + early exit over multi-decade hold.
- At projected returns (-3.0% appreciation + 3.0% rent growth), your $22k cash investment doubles in ~6 years — after that, you're playing with house money.
Negotiation context
- Only 0 days on market — expect competitive offers; lowballing is unlikely to land.
- Current owner paid $42k; list at $80k implies a 90% gain — meaningful room to come down on a strong offer.
Risks & watch-outs
- Watch-outs: property tax is 3.3% of price.
Questions for the listing agent
- Property tax is high relative to price — has the assessment been appealed recently, and will the sale trigger a re-assessment?
- Is there a deadline driving the sale (1031 exchange, divorce, estate, relocation)? That informs how much negotiation room exists.
- Schools are D-rated, which usually means shorter tenancies and higher turnover. Who's the typical renter profile here, and what's been the actual vacancy rate?
- What's the average days-on-market for RENTAL listings here right now (not sales)? A rising rental-DOM trend means longer vacancies and softer asking-rent achievability than the comps imply.
- What's the recent tenant-quality profile in this submarket — average credit score on applications, eviction rate, late-payment / NSF rate, and stable-employment percentage? A property-management company in the area should have these aggregated.
- How much new for-sale + rental construction is in the pipeline within 1–3 miles? Heavy new supply typically softens prices + rents 12–24 months out; constrained supply supports both.
Investment metrics
- 1% rule
- 1.71% ✓
- Cap rate
- 12.45%
- Cash-on-cash
- 22.00%
- DSCR
- 1.98
- GRM
- 4.9
CMA / ARV
- ARV (on-the-fly)
- $188,368
- Comps found
- 6
Show comp detail 6 sales within ~0.75 mi
| Address | Dist | Beds/Ba | Sqft | Sold | Price | $/sf | Match |
|---|---|---|---|---|---|---|---|
| 521 Parkside Dr | 0.36mi | 3/1.5 | 1,032 (+6%) | 7mo | $220,000 | $213 | 66 |
| 409 Sparkhill Ave | 0.51mi | 3/1.5 | 988 (+1%) | 13mo | $130,000 | $132 | 61 |
| 417 Parkside Dr | 0.46mi | 3/1.5 | 1,056 (+8%) | 2mo | $165,000 | $156 | 61 |
| 5048 Iroquois Ave | 0.38mi | 3/1.0 | 941 (-4%) | 21mo | $151,000 | $160 | 59 |
| 4434 Emmett Dr | 0.66mi | 3/1.0 | 1,008 (+3%) | 8mo | $195,000 | $193 | 56 |
| 5005 Lee Ave | 0.26mi | 4/2.0 (+1) | 1,112 (+14%) | 16mo | $306,500 | $276 | 43 |
Match score weights: distance 35% · size 25% · config 20% · recency 20%. Top-matched comps best support the ARV.
Projected returns pro-forma
-3.0% appreciation · 3.0% rent growth · sell at horizon
- IRR
- 14.8%
- Equity multiple
- 1.59×
- Total profit
- $13,269
- Equity at exit
- $11,913
- IRR
- 23.6%
- Equity multiple
- 3.04×
- Total profit
- $45,569
- Equity at exit
- $6,908
Cash invested: $22,372 (down + closing). Projections, not guarantees.
Landlord ↔ Tenant lean methodology
- Overall (STATE)
- 62 Landlord-Friendly
- State Pennsylvania
- 62 Landlord-Friendly · EVEN
- County
- — inherits STATE
- City
- — inherits STATE
ZIP-level market 16511
- Home prices YoY
- -24.9%
- Active inventory
- 48
- Price-to-rent
- 4.9×
Monthly cashflow live
- Estimated rent
- $1,367 medium interval (Pro) →
- Mortgage (P&I)
- −$419
- Tax from tax record
- −$218 /mo · $2,614/yr
- Insurance
- −$33
- HOA
- −$0
- Vacancy / Maint / Mgmt
- −$287
- Net cashflow
- $410
Break-even live
UW: 25.0% down · 7.5% · 30yr · 1.5% tax · 5.0% vac · 8.0% maint · 8.0% mgmt
Financing live
Cash to close
- Down payment
- $19,975
- Closing costs
- $2,397
- Reserves months
- —
- Total cash needed
- —
Loan-product check · same deal, 3 products live
Conventional
25% down · 7.5% · 30yr
- Down + closing
- —
- Monthly P&I
- —
- Monthly cashflow
- —
- DSCR
- —
- Eligible?
- —
Personal DTI + credit; lowest rate.
DSCR
20% down · 8.5% · 30yr
- Down + closing
- —
- Monthly P&I
- —
- Monthly cashflow
- —
- DSCR
- —
- Eligible?
- —
No personal income docs; deal must DSCR.
Hard money
10% down · 12.0% · 12mo
- Down + closing
- —
- Monthly P&I
- —
- Monthly cashflow
- —
- DSCR
- —
- Eligible?
- —
Short-term bridge; refi at stabilization.
Rent comps 2 comps
| Address | Beds | Baths | Sqft | Rent | $/sqft | DOM | Units | Dist |
|---|---|---|---|---|---|---|---|---|
| 4400 E Lake Rd Erie, PA | 2.0 | 1.0 | 825 | $1,702 | $2.06 | 43d | 9 | 0.86mi |
| 1205 Priestley Ave Erie, PA | 3.0 | 1.0 | 1000 | $950 | $0.95 | 43d | 1 | 1.23mi |
Listing history 1 events
-
2026-06-14$79,900 Pending
ⓘ Source: listings_history table (triggers on properties + properties_extension) + one-shot
backfill from property_details.listing_events for pre-trigger history.
Tax reassessment forecast PA · Partial reset (capped growth)
- Current annual tax
- $2,614 · $218/mo
- Projected year-2 tax
- $2,614 · $218/mo
- Expected delta
- $0/yr ($0/mo · 0.0%)
ⓘ Screening estimate from a state-policy table — verify with the county assessor before closing.
Climate risk First Street
- Flood 1/10 Low FEMA zone X (unshaded) · 0% chance over 30 yrs
- Wildfire 1/10 Low
- Heat 2/10 Low 7 d/yr ≥90°F today · 17 d/yr by 30 yrs out
- Wind 1/10 Low
- Air quality 3/10 Moderate 4 unhealthy d/yr today · 4 by 30 yrs out
Nearby sold comps map
Loading sold comps map…
Walkable amenities ~0.75 mi
Loading nearby amenities…
Taxation est. · year 1
- Rental income
- $16,410
- − Mortgage interest
- −$4,476
- − Property taxes
- −$2,614
- − Insurance
- −$400
- − Repairs & maintenance
- −$1,313
- − Management
- −$1,313
- − Depreciation
- −$2,324
- Taxable income
- $3,970
- Est. tax owed @ 24.0%
- −$953
- After-tax cash flow
- $3,969/yr
For passive investors: Depreciation is non-cash, so a rental often shows a tax loss while cash-flowing — sheltering income. Rental losses are passive: they offset passive income freely, and up to $25,000/yr can offset ordinary (W-2) income if you actively participate and your MAGI is under $100k (phasing out to $0 by $150k); unused losses carry forward. On sale, claimed depreciation is recaptured at up to 25%, and gains may owe capital-gains tax (a 1031 exchange can defer both). Figures are a year-1 estimate at your 24.0% rate — not tax advice; consult a CPA.
Schools (NCES district)
- District
- Harbor Creek SD
- NCES district ID
- 4211490
- Math proficiency
- 54% ▼ -13.00%
- Reading proficiency
- 73% ▼ -8.00%
- Median HH income
- $60,141
- Composite
- 54.87/100
- National rank
- #1312
- State rank
- #53 of 539 in PA
Livability — Northwest Harborcreek
- Score
- 89/100
- State rank
- #25
- US rank
- #149
Category grades
Schools grade is shown separately in the Schools card above.
Census & demographics
- Census place
- Northwest Harborcreek, PA
- City population
- 11,709
- Population (ZIP)
- 11,709
Population outlook (Erie County) Hauer SSP2
- Today (2025)
- 272,159 people
- By 2030
- 266,299 · -2.2%
- By 2040
- 250,987 · -7.8%
- By 2050
- 234,925 · -13.7%
- By 2075
- 199,164 · -26.8%
- By 2100
- 162,985 · -40.1%
Race, ethnicity, and origin ACS 2023
- Neighborhood character
- Predominantly White (80%)
- Race & ethnicity
- White 80% Black 10% Hispanic / Latino 6% Two or more races 3% Asian 1%
- Hispanic origin (detail)
- Puerto Rican 5%
- Common ancestry
- Romanian 11% Lithuanian 3% Scotch-Irish 2%
- Foreign-born
- 4% · Canada
- Languages at home
- 94% English-only · Spanish 3% Russian/Polish/Slavic 2%
Political lean MEDSL · Erie
- 2024 margin
- Toss-up / Even · D 49.0% · R 50.0%
- 2008→2024 swing
- -20.9pp toward R · 2008: 19.9pp · 2024: -1.0pp
- All cycles
- 2024: R+1.0 2020: D+1.0 2016: R+2.0 2012: D+16.9 2008: D+19.9
Not yet ingested
- Civics
- —
Market trends
- HPI YoY
- ▼ -85.06%
- Current HPI
- 256.8088
- Rent YoY
- —
- Metro
- —
- State GDP YoY
- ▲ 1.68%
- F500 in state
- 34
Industry mix (Fortune 500 HQ in PA)
| Industry | F500 HQs | Revenue |
|---|---|---|
| Healthcare | 2 | $309B |
|
||
| Insurance | 2 | $27B |
|
||
| Telecommunications / Media | 1 | $124B |
|
||
| Industrial Distribution | 1 | $22B |
|
||
| Financial Services | 1 | $20B |
|
||
| Chemicals / Materials | 1 | $18B |
|
||
Price history
+75.2% since first listed4 events — show timeline
- 2026-06-13 Delisted — GEBOR
- 2026-06-13 Listed $79,900 GEBOR
- 1986-01-27 Sold (Public Records) $42,000 Public Records
- 1981-05-20 Sold (Public Records) $45,600 Public Records
Property tax history
+3.1%/yrLatest (2026): $2,614 · +4.5% YoY. Source: county tax records.
Cash-flow waterfall
monthlySold comps — $/sqft
last 12 mo · ≤1 miLoading sold comps…