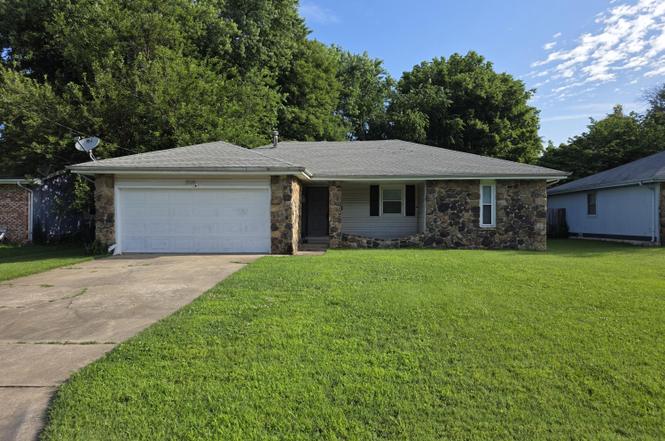
909 W Glenwood St · Springfield, MO
Flood risk 1/10 · Minimal
- FEMA flood zone
- X (unshaded)
- Chance of flooding over 30 yrs
- 0.0%
- Est. flood insurance / yr
- $507 – $1,088
Fire risk 1/10 · Minimal
- Est. fire insurance / yr
- $1,054 – $1,958
Heat risk 5/10 · Moderate
- Hot days now (above 105°F)
- 7 days/yr
- Hot days in 30 yrs
- 19 days/yr
Wind risk 2/10 · Minimal
- Chance of severe wind over 30 yrs
- —
Air-quality risk 2/10 · Minimal
- Unhealthy air days now
- 1 days/yr
- Unhealthy air days in 30 yrs
- 2 days/yr
Risk factors via First Street. Map © Google.
Why this score? — see what drove the C+ grade
The composite is a weighted blend of 9 inputs, each scored 0–100. Each bar is that input's sub-score; the figure is the points it added to the 100-point composite (weight × sub-score).
- Cash flow +21.8/30.0
- ARV discount +15.0/15.0
- DSCR +7.0/10.0
- 1% rule +5.1/10.0
- Livability +3.8/5.0
- Rent growth +3.2/5.0
- Schools +3.2/10.0
- Condition / age +2.5/5.0
- Appreciation +0.0/10.0
$149,900
🖨 Deal sheet 📄 Offer letter ✓ Due diligence
Listing remarks MLS
HUGE living room, just perfect to host your Super Bowl watch party! Sellers to provide one year HSA home warranty. This home is located in a convenient location and is excellent for first time buyers, investors or someone looking for everything on one level. Features include beautiful wood laminate floors, a stunning rock wall around the wood-burning fireplace in the living room, 2 ensuite baths, new garage door opener and large fenced backyard. Close proximity to elementary school, grocery, hardware and Bass Pro. Priced to sell!
Key facts
- 0.23 acre lot
- 2 garage spots
- Built 1974
Property features AI
Exterior
- Parking: Attached garage with 2 spaces
- Security: Smoke detector(s)
- Utilities: Public water; Public sewer
- Home design: Single-family residence; One level
- Construction: Vinyl siding and stone exterior; Composition roof
- Exterior features: Patio; Wood and chain link fencing; Public-maintained asphalt road frontage on a city street; Shed(s)
Interior
- Kitchen: Electric oven; Free-standing electric oven; Dishwasher; Disposal
- Flooring: Laminate flooring; Vinyl flooring
- Bathrooms: 2 full bathrooms
- Heating & cooling: Central heating (natural gas, forced air); Central air conditioning; Ceiling fan(s)
- Interior features: Laminate counters; Wood-burning fireplace in the family room; Smoke detectors
- Laundry & utility: Laundry on the main level
Neighborhood map
What this means for you Summary
Snapshot
- This is a 3-bed/2.0-bath single-family listed at $150k.
Deal economics
- At list price, monthly cash flow is $234 ($3k/yr) — positive.
- The deal already cash-flows at list — no discount required.
- Meets the 1% rule at list price ($2k rent vs $150k).
- Cap rate 8.2% vs local median 4.6% in Springfield — top-decile yield for the area; either an underpriced asset or a hidden risk that comps aren't pricing in. Stress-test before assuming the spread holds.
Location & tenants
- Location reads 75/100 on livability (#57 in MO, #4,121 nationally) — a middle-class / working-renter tenant base. Strengths: commute A+, cost of living A+, housing A+; Watch: crime F, employment F.
- Springfield R-XII (urban): math 32% / reading 46% proficiency, ranked #174 of 324 in MO (top 54%) — families likely to look elsewhere, expect single-tenant / working-renter base with shorter leases.
- Zoned schools: Mark Twain Elem. (math 27% / reading 37%, grade F, #761 of 1,115 statewide, top 72%, 323 students, 70% FRL); Jarrett Middle (math 19% / reading 40%, grade F, #291 of 391 statewide, top 76%, 445 students, 70% FRL); Parkview High (math 11% / reading 40%, grade F, #433 of 521 statewide, top 83%, 1,234 students, 62% FRL) — zoned schools average 67% FRL vs 46% district-wide (21 pts higher); higher-poverty schools than district average — tighter screening recommended.
- Market conditions: Rents rising (+2.6%/yr); 249 active listings in the ZIP; 27 comparable units currently listed for rent nearby; rentals at typical pace (median 23d on market — plan ~3-4 weeks tenant-placement turnaround); 1,302 units permitted in Greene County in 2024 (250 in 5+ unit buildings).
- This rent runs 34% of the median local income ($54k/yr) — at the standard rent-burdened threshold; future hikes will face affordability resistance.
Forward outlook
- Local home prices are declining (-3.0%/yr); year-one equity from $1k of loan paydown is wiped out by about $4k of value loss. Plan a longer hold.
- Greene County population projected at +25% by 2050 — long-run rental-demand tailwind backs the buy-and-hold thesis.
Negotiation context
- Only 1 days on market — expect competitive offers; lowballing is unlikely to land.
- 2 sale attempts since 9y ago with the ask held roughly flat each time — persistent listings suggest the price (not the market) is what's stuck; bring a comps-based counter.
Risks & watch-outs
- Climate carrying-cost: extreme-heat days projected 7→19/yr by 2055 (HVAC capex compounding) — expect insurance premiums to compound above CPI over the hold.
Questions for the listing agent
- Built in 1974 — when were the roof, HVAC, electrical panel, plumbing, and water heater last replaced?
- Is there a deadline driving the sale (1031 exchange, divorce, estate, relocation)? That informs how much negotiation room exists.
- Crime grade is F in this area — have there been break-ins, vandalism, or insurance claims at this property in the last 3 years? What carrier currently insures it and at what premium?
- What's the average days-on-market for RENTAL listings here right now (not sales)? A rising rental-DOM trend means longer vacancies and softer asking-rent achievability than the comps imply.
- What's the recent tenant-quality profile in this submarket — average credit score on applications, eviction rate, late-payment / NSF rate, and stable-employment percentage? A property-management company in the area should have these aggregated.
- How much new for-sale + rental construction is in the pipeline within 1–3 miles? Heavy new supply typically softens prices + rents 12–24 months out; constrained supply supports both.
Investment metrics
- 1% rule
- 1.01% ✓
- Cap rate
- 8.16%
- Cash-on-cash
- 6.68%
- DSCR
- 1.30
- GRM
- 8.3
CMA / ARV
- ARV (on-the-fly)
- $220,780
- Comps found
- 12
Show comp detail 12 sales within ~0.75 mi
| Address | Dist | Beds/Ba | Sqft | Sold | Price | $/sf | Match |
|---|---|---|---|---|---|---|---|
| 2514 S Fort Ave | 0.30mi | 3/2.0 | 1,310 (-2%) | 0mo | $199,000 | $152 | 83 |
| 2550 S Fort Ave | 0.32mi | 3/2.0 | 1,310 (-2%) | 0mo | $205,000 | $156 | 82 |
| 2532 S Fort Ave | 0.31mi | 3/2.0 | 1,310 (-2%) | 1mo | $205,000 | $156 | 82 |
| 2546 S Fort Ave | 0.32mi | 3/2.0 | 1,310 (-2%) | 1mo | $199,000 | $152 | 82 |
| 2522 S Grant Ave | 0.18mi | 3/2.0 | 1,408 (+6%) | 1mo | $235,000 | $167 | 81 |
| 606 W Broadmoor St | 0.28mi | 3/1.5 | 1,225 (-8%) | 1mo | $189,900 | $155 | 71 |
| 2449 S Westwood Ave | 0.58mi | 3/1.5 | 1,332 (+0%) | 2mo | $230,000 | $173 | 69 |
| 2852 S Pinehurst Ave | 0.53mi | 3/2.0 | 1,436 (+8%) | 1mo | $244,500 | $170 | 62 |
| 1632 W Berkeley St | 0.65mi | 3/2.0 | 1,400 (+5%) | 2mo | $229,000 | $164 | 60 |
| 1010 W Cherokee St | 0.60mi | 3/2.0 | 1,177 (-12%) | 2mo | $194,900 | $166 | 51 |
| 2002 S Ferguson Ave | 0.64mi | 3/1.5 | 1,196 (-10%) | 1mo | $205,000 | $171 | 50 |
| 1326 W Lindberg St | 0.60mi | 3/2.0 | 1,515 (+14%) | 0mo | $274,900 | $181 | 49 |
Match score weights: distance 35% · size 25% · config 20% · recency 20%. Top-matched comps best support the ARV.
Projected returns pro-forma
-3.0% appreciation · 2.6% rent growth · sell at horizon
- IRR
- -6.5%
- Equity multiple
- 0.76×
- Total profit
- $-10,030
- Equity at exit
- $22,351
- IRR
- 2.7%
- Equity multiple
- 1.19×
- Total profit
- $7,875
- Equity at exit
- $12,961
Cash invested: $41,972 (down + closing). Projections, not guarantees.
Landlord ↔ Tenant lean methodology
- Overall (STATE)
- 81 Strongly Landlord-Friendly
- State Missouri
- 81 Strongly Landlord-Friendly · R+10
- County
- — inherits STATE
- City
- — inherits STATE
ZIP-level market 65807
- Rents YoY
- 2.6%
- Active inventory
- 249
- Price-to-rent
- 8.3×
Monthly cashflow live
- Estimated rent
- $1,507 high interval (Pro) →
- Mortgage (P&I)
- −$786
- Tax from tax record
- −$108 /mo · $1,297/yr
- Insurance
- −$62
- HOA
- −$0
- Vacancy / Maint / Mgmt
- −$316
- Net cashflow
- $234
Break-even live
UW: 25.0% down · 7.5% · 30yr · 1.5% tax · 5.0% vac · 8.0% maint · 8.0% mgmt
Financing live
Cash to close
- Down payment
- $37,475
- Closing costs
- $4,497
- Reserves months
- —
- Total cash needed
- —
Loan-product check · same deal, 3 products live
Conventional
25% down · 7.5% · 30yr
- Down + closing
- —
- Monthly P&I
- —
- Monthly cashflow
- —
- DSCR
- —
- Eligible?
- —
Personal DTI + credit; lowest rate.
DSCR
20% down · 8.5% · 30yr
- Down + closing
- —
- Monthly P&I
- —
- Monthly cashflow
- —
- DSCR
- —
- Eligible?
- —
No personal income docs; deal must DSCR.
Hard money
10% down · 12.0% · 12mo
- Down + closing
- —
- Monthly P&I
- —
- Monthly cashflow
- —
- DSCR
- —
- Eligible?
- —
Short-term bridge; refi at stabilization.
Rent comps 27 comps
| Address | Beds | Baths | Sqft | Rent | $/sqft | DOM | Units | Dist |
|---|---|---|---|---|---|---|---|---|
| 625 W Edgewood St Springfield, MO | 2.0 | 1.5 | 1100 | $1,050 | $0.95 | 43d | 1 | 0.22mi |
| 611 W Sunset St Springfield, MO | 2.0–3.0 | 2.0 | 1104 | $1,954 | $1.77 | 13d | 5 | 0.31mi |
| 428 W Broadmoor St Springfield, MO | 4.0 | 2.0 | 1804 | $1,850 | $1.03 | 13d | 1 | 0.36mi |
| 2561 South Pl Unit B Springfield, MO | 2.0 | 1.0 | 884 | $850 | $0.96 | 23d | 1 | 0.59mi |
| 1441 W Seminole St Springfield, MO | 3.0 | 2.0 | 1218 | $1,550 | $1.27 | 43d | 1 | 0.59mi |
| 923 W Battlefield Rd Springfield, MO | 1.0–2.0 | 1.0–2.0 | 910 | $1,050 | $1.15 | 44d | 4 | 0.67mi |
| 2752 S Meadowbrook Ave Springfield, MO | 1.0–2.0 | 1.0–2.0 | 775 | $1,115 | $1.44 | 13d | 1 | 0.69mi |
| 2828 S Nettleton Ave Springfield, MO | 1.0–3.0 | 1.0–2.0 | 962 | $1,595 | $1.66 | 13d | 5 | 0.71mi |
| 3025 S Sagamont Ave Springfield, MO | 2.0 | 1.0–2.0 | 832 | $1,345 | $1.62 | 13d | 9 | 0.74mi |
| 2715 S Kimbrough Ave Springfield, MO | 2.0 | 2.0 | 1640 | $2,660 | $1.62 | 13d | 8 | 0.81mi |
| 2521 S Holland Ave Springfield, MO | 1.0–2.0 | 1.0–2.0 | 1034 | $1,695 | $1.64 | 43d | 1 | 0.90mi |
| 640 E Sunset St Springfield, MO | 2.0 | 2.0 | 976 | $1,695 | $1.74 | 43d | 1 | 0.94mi |
| 2917 S Roanoke Ave Springfield, MO | 3.0 | 2.0 | 1262 | $1,700 | $1.35 | 23d | 1 | 0.96mi |
| 2935 S Roanoke Ave Springfield, MO | 3.0 | 2.0 | 1429 | $1,150 | $0.80 | 13d | 1 | 0.98mi |
| 813 E Morningside St Springfield, MO | 3.0 | 1.0 | 1216 | $1,395 | $1.15 | 23d | 1 | 1.04mi |
| 932 E Sunset St Springfield, MO | 2.0–3.0 | 2.0 | 1088 | $1,895 | $1.74 | 13d | 3 | 1.14mi |
| 245 E Erie St Unit 245 C Springfield, MO | 2.0 | 2.5 | 1100 | $995 | $0.90 | 23d | 1 | 1.15mi |
| 265 E Erie St Unit 265 C Springfield, MO | 2.0 | 2.5 | 1100 | $995 | $0.90 | 23d | 1 | 1.16mi |
| 256 E Erie St Unit 256 D Springfield, MO | 2.0 | 2.5 | 1000 | $995 | $0.99 | 13d | 1 | 1.18mi |
| 3302 S Jefferson Ave Springfield, MO | 3.0 | 2.0 | 1522 | $1,595 | $1.05 | 23d | 1 | 1.28mi |
| 2308 S Hampton Ave Springfield, MO | 3.0 | 1.5 | 1440 | $1,650 | $1.15 | 43d | 1 | 1.33mi |
| 820 E Montclair St Springfield, MO | 1.0–2.0 | 1.0–2.0 | 870 | $1,100 | $1.26 | 43d | 1 | 1.37mi |
| 1634 S Marion Ave Springfield, MO | 3.0 | 1.0–2.0 | 845 | $1,662 | $1.97 | 13d | 23 | 1.38mi |
| 1918 S Kings Ave Springfield, MO | 3.0 | 2.0 | 1520 | $2,200 | $1.45 | 43d | 1 | 1.38mi |
| 312 E Redwood St Springfield, MO | 2.0 | 2.0 | 1117 | $1,400 | $1.25 | 23d | 1 | 1.43mi |
| 1625 S Marion Ave Springfield, MO | 1.0–2.0 | 1.0–2.0 | 900 | $1,321 | $1.47 | 13d | 5 | 1.49mi |
| 634 E Walnut Lawn St Springfield, MO | 1.0–2.0 | 1.0–2.0 | 841 | $1,495 | $1.78 | 13d | 7 | 1.50mi |
Listing history 2 events
-
2026-06-14remarks 699-char remark
-
2026-06-14$149,900 Pending 1 DOM
ⓘ Source: listings_history table (triggers on properties + properties_extension) + one-shot
backfill from property_details.listing_events for pre-trigger history.
Tax reassessment forecast MO · Resets to sale price
- Current annual tax
- $1,297 · $108/mo
- Projected year-2 tax
- $1,454 · $121/mo
- Expected delta
- +$157/yr (+$13/mo · 12.1%)
ⓘ Screening estimate from a state-policy table — verify with the county assessor before closing.
Climate risk First Street
- Flood 1/10 Low FEMA zone X (unshaded) · 0% chance over 30 yrs
- Wildfire 1/10 Low
- Heat 5/10 Major 7 d/yr ≥105°F today · 19 d/yr by 30 yrs out
- Wind 2/10 Low
- Air quality 2/10 Low 1 unhealthy d/yr today · 2 by 30 yrs out
Nearby sold comps map
Loading sold comps map…
Walkable amenities ~0.75 mi
Loading nearby amenities…
Taxation est. · year 1
- Rental income
- $18,082
- − Mortgage interest
- −$8,397
- − Property taxes
- −$1,297
- − Insurance
- −$750
- − Repairs & maintenance
- −$1,447
- − Management
- −$1,447
- − Depreciation
- −$4,361
- Taxable income
- $385
- Est. tax owed @ 24.0%
- −$92
- After-tax cash flow
- $2,713/yr
For passive investors: Depreciation is non-cash, so a rental often shows a tax loss while cash-flowing — sheltering income. Rental losses are passive: they offset passive income freely, and up to $25,000/yr can offset ordinary (W-2) income if you actively participate and your MAGI is under $100k (phasing out to $0 by $150k); unused losses carry forward. On sale, claimed depreciation is recaptured at up to 25%, and gains may owe capital-gains tax (a 1031 exchange can defer both). Figures are a year-1 estimate at your 24.0% rate — not tax advice; consult a CPA.
Schools (NCES district)
- District
- Springfield R-XII
- NCES district ID
- 2928860
- Math proficiency
- 32% ▼ -2.00%
- Reading proficiency
- 46% ▼ -3.00%
- Median HH income
- $37,886
- Composite
- 32.45/100
- National rank
- #5717
- State rank
- #174 of 324 in MO
Livability — Springfield
- Score
- 75/100
- State rank
- #57
- US rank
- #4121
Category grades
Schools grade is shown separately in the Schools card above.
Census & demographics
- Census place
- Springfield, MO
- County
- Greene County · 244,327 people
- City population
- 223,044
- Metro
- Springfield, MO
- Population (ZIP)
- 56,659
- Household income
- $53,870
- Rent vs Own
- Severe rent burden
- 3420.0
Population outlook (Greene County) Hauer SSP2
- Today (2025)
- 319,054 people
- By 2030
- 335,135 · +5.0%
- By 2040
- 366,186 · +14.8%
- By 2050
- 397,431 · +24.6%
- By 2075
- 477,035 · +49.5%
- By 2100
- 520,828 · +63.2%
Race, ethnicity, and origin ACS 2023
- Neighborhood character
- Predominantly White (81%)
- Race & ethnicity
- White 81% Two or more races 8% Hispanic / Latino 7% Black 4% Asian 3%
- Hispanic origin (detail)
- Mexican 4%
- Common ancestry
- Italian 3% Lithuanian 2% Slovak 2%
- Foreign-born
- 4% · Canada, South Korea
- Languages at home
- 94% English-only · Spanish 2% Other Asian/Pacific 1% Arabic 1%
Political lean MEDSL · Greene
- 2024 margin
- Strong R (+20.8) · D 38.9% · R 59.7% · Other 1.4%
- 2008→2024 swing
- -5.0pp toward R · 2008: -15.8pp · 2024: -20.8pp
- All cycles
- 2024: R+20.8 2020: R+20.1 2016: R+27.4 2012: R+24.4 2008: R+15.8
Not yet ingested
- Civics
- —
Market trends
- HPI YoY
- ▼ -205.97%
- Current HPI
- 210.4358
- Rent YoY
- ▲ 2.60%
- Metro
- Springfield, MO
- State GDP YoY
- ▲ 1.84%
- F500 in state
- 20
Industry mix (Fortune 500 HQ in MO)
| Industry | F500 HQs | Revenue |
|---|---|---|
| Healthcare | 1 | $163B |
|
||
| Insurance | 1 | $21B |
|
||
| Industrial Technology | 1 | $17B |
|
||
| Retail | 1 | $16B |
|
||
| Industrial Distribution | 1 | $10B |
|
||
| Utilities | 1 | $9B |
|
||
Price history
+53.0% since first listed8 events — show timeline
- 2026-06-12 Pending — SOMO
- 2026-06-10 Listed $149,900 SOMO
- 2018-02-05 Sold (Public Records) — Public Records
- 2018-01-31 Sold (MLS) — SOMO
- 2017-10-26 Listed $98,000 SOMO
- 2009-12-17 Sold (Public Records) — Public Records
- 2007-01-12 Sold (Public Records) — Public Records
- 2005-06-14 Sold (Public Records) — Public Records
Property tax history
+3.3%/yrLatest (2025): $1,297 · +5.9% YoY. Source: county tax records.
Cash-flow waterfall
monthlySold comps — $/sqft
last 12 mo · ≤1 miLoading sold comps…