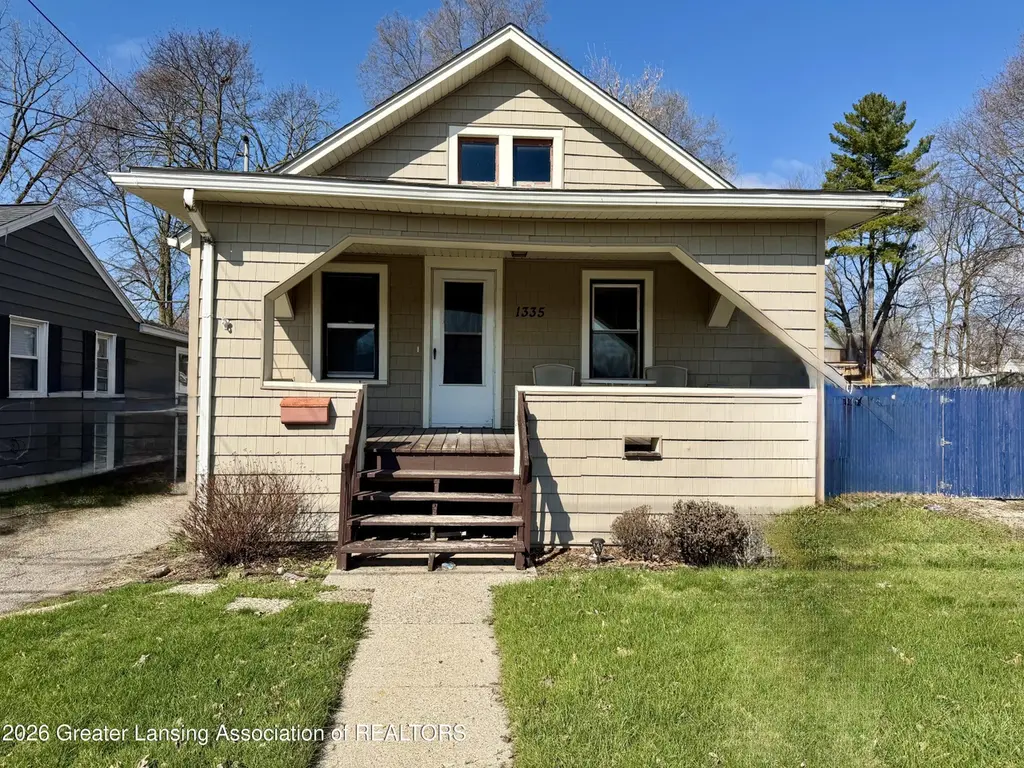
1335 N Martin Luther King Junior Blvd · Lansing, MI
Flood risk 7/10 · Major
- FEMA flood zone
- X (unshaded)
- Chance of flooding over 30 yrs
- 0.77%
- Est. flood insurance / yr
- $473 – $860
Fire risk 1/10 · Minimal
- Est. fire insurance / yr
- $784 – $1,456
Heat risk 3/10 · Minor
- Hot days now (above 97°F)
- 7 days/yr
- Hot days in 30 yrs
- 16 days/yr
Wind risk 2/10 · Minimal
- Chance of severe wind over 30 yrs
- —
Air-quality risk 2/10 · Minimal
- Unhealthy air days now
- 1 days/yr
- Unhealthy air days in 30 yrs
- 2 days/yr
Risk factors via First Street. Map © Google.
Why this score? — see what drove the D+ grade
The composite is a weighted blend of 9 inputs, each scored 0–100. Each bar is that input's sub-score; the figure is the points it added to the 100-point composite (weight × sub-score).
- Cash flow +22.7/30.0
- DSCR +7.3/10.0
- 1% rule +6.8/10.0
- Livability +4.0/5.0
- Rent growth +2.5/5.0
- Condition / age +2.5/5.0
- Schools +1.9/10.0
- ARV discount +0.0/15.0
- Appreciation +0.0/10.0
$79,900
🖨 Deal sheet 📄 Offer letter ✓ Due diligence
Listing remarks MLS
Welcome home to 1335 N. Martin Luther King Blvd! This adorable Ranch home features two bedrooms with new carpet, a large living room, a nice sized kitchen, a full dry basement, a large partially fenced yard, and large front and rear covered porches! Many updates throughout including paint, flooring, and more! Immediate occupancy available so why rent when you can own for less money each month! This won't last long so schedule your private showing today!
Key facts
- Ranch home
- Covered porches
- Large living room
Tags
Property features AI
Finance
- Financial info: Current use listed as investment
Exterior
- Parking: Driveway
- Utilities: 100 amp electric service; Public sewer; High-speed internet available; Cable available
- Home design: One-story property; Built in 1922; Updated/remodeled condition; City street frontage
- Construction: Vinyl siding; Shingle roof; Block foundation; Full block basement with sump pump
- Exterior features: Covered front porch; Covered rear porch; Rain gutters; Partial backyard fencing; Back yard and front yard; Rectangular lot; Curbs, sidewalks and street lights in the community; Double pane windows with screens
Interior
- Kitchen: Disposal; Microwave; Oven; Range; Refrigerator
- Bedrooms: 2 bedrooms (primary bedroom described as nice-sized; second bedroom described as roomy)
- Flooring: Carpet; Combination flooring; Laminate
- Bathrooms: 1 full bathroom
- Heating & cooling: Forced air heating; Window unit(s) for cooling
- Interior features: Laminate counters; Pantry; Storage
- Laundry & utility: Laundry located on lower level
Neighborhood map
What this means for you Summary
Snapshot
- This is a 2-bed/1.0-bath single-family listed at $80k.
Deal economics
- At list price, monthly cash flow is $82 ($978/yr) — positive.
- The deal already cash-flows at list — no discount required.
- Meets the 1% rule at list price ($946 rent vs $80k).
- Recommended offer: $78k (3.0% below list) — sets the bar for market timing.
- Cap rate 8.4% vs local median 6.0% in Lansing — top-decile yield for the area; either an underpriced asset or a hidden risk that comps aren't pricing in. Stress-test before assuming the spread holds.
Location & tenants
- Location reads 79/100 on livability (#94 in MI, #2,182 nationally) — a middle-class / working-renter tenant base. Strengths: amenities A+, commute A+, cost of living A+; Watch: employment D, schools F, crime F.
- Lansing Public School District (urban): math 14% / reading 23% proficiency, ranked #650 of 760 in MI (top 86%) — low school quality limits family demand, transient renter base, plan for 1-2y turnover; 68% free/reduced lunch — lower-income household profile, screen leases tightly.
- Market conditions: 68 active listings in the ZIP; 20 comparable units currently listed for rent nearby; rentals lingering (median 44d on market — plan ~5-8 weeks vacancy on turnover, expect pricing pressure); 85% of comp listings sitting > 30 days — soft ceiling on asking rent; 350 units permitted in Ingham County in 2024 (186 in 5+ unit buildings).
Forward outlook
- Local home prices are declining (-3.0%/yr); year-one equity from $552 of loan paydown is wiped out by about $2k of value loss. Plan a longer hold.
- Ingham County population projected at +11% by 2050 — modest demand growth; plan on rents tracking national, not racing it.
Negotiation context
- It's been on market 49 days — a 3% lower offer ($78k) is reasonable based on typical stale-listing flexibility.
- 7 sale attempts since 16y ago; this cycle's ask has dropped $10k (11%) from the opening price — seller is motivated, your offer sets the floor, not the list.
- Current owner paid $17k; list at $80k implies a 373% gain — meaningful room to come down on a strong offer.
Risks & watch-outs
- Watch-outs: flood insurance adds $56/mo; built in 1922 — expect roof / HVAC / electrical / plumbing capex.
- Climate carrying-cost: major flood risk — expect insurance premiums to compound above CPI over the hold.
Questions for the listing agent
- It's been on market 49 days. Have you received any prior offers? Is the seller open to a 3% concession, seller financing, or rate buy-down credit?
- Built in 1922 — when were the roof, HVAC, electrical panel, plumbing, and water heater last replaced?
- What's the actual annual flood-insurance premium (NFIP or private), and is the property in a SFHA with mandatory coverage?
- Is there a deadline driving the sale (1031 exchange, divorce, estate, relocation)? That informs how much negotiation room exists.
- Schools are F-rated, which usually means shorter tenancies and higher turnover. Who's the typical renter profile here, and what's been the actual vacancy rate?
- Crime grade is F in this area — have there been break-ins, vandalism, or insurance claims at this property in the last 3 years? What carrier currently insures it and at what premium?
- The area grade is low — what's the realistic commute time and amenity access for the typical tenant pool here? Any planned neighborhood developments (good or bad) we should know about?
- What's the average days-on-market for RENTAL listings here right now (not sales)? A rising rental-DOM trend means longer vacancies and softer asking-rent achievability than the comps imply.
- What's the recent tenant-quality profile in this submarket — average credit score on applications, eviction rate, late-payment / NSF rate, and stable-employment percentage? A property-management company in the area should have these aggregated.
- How much new for-sale + rental construction is in the pipeline within 1–3 miles? Heavy new supply typically softens prices + rents 12–24 months out; constrained supply supports both.
Investment metrics
- 1% rule
- 1.18% ✓
- Cap rate
- 8.35%
- Cash-on-cash
- 7.35%
- DSCR
- 1.33
- GRM
- 7.0
CMA / ARV
- ARV (median comp)
- $65,590
- List price
- $79,900
- Delta
- 21.82%
- Verdict
- OVERPRICED
- Comps
- 20 within 1.0 mi
Show comp detail 12 sales within ~0.75 mi
| Address | Dist | Beds/Ba | Sqft | Sold | Price | $/sf | Match |
|---|---|---|---|---|---|---|---|
| 1348 N Jenison Ave | 0.21mi | 2/1.0 | 672 (+0%) | 3mo | $68,900 | $103 | 87 |
| 1616 Roseneath Ave | 0.30mi | 2/1.0 | 660 (-2%) | 4mo | $73,000 | $111 | 80 |
| 812 Cypress St | 0.30mi | 2/1.0 | 648 (-3%) | 4mo | $96,000 | $148 | 77 |
| 1544 Lansing Ave | 0.27mi | 3/1.0 (+1) | 616 (-8%) | 2mo | $78,950 | $128 | 67 |
| 1430 N Martin Luther King Jr Blvd | 0.12mi | 3/1.0 (+1) | 768 (+14%) | 6mo | $62,000 | $81 | 61 |
| 924 N Pine St | 0.55mi | 1/1.0 (-1) | 656 (-2%) | 8mo | $55,000 | $84 | 59 |
| 1555 Roosevelt Ave | 0.35mi | 2/1.0 | 740 (+10%) | 10mo | $92,100 | $124 | 58 |
| 819 Cawood St | 0.56mi | 2/1.0 | 726 (+8%) | 4mo | $55,000 | $76 | 57 |
| 2014 Hyland St | 0.63mi | 2/1.0 | 744 (+11%) | 0mo | $152,500 | $205 | 52 |
| 751 Westmoreland Ave | 0.51mi | 2/1.0 | 757 (+13%) | 6mo | $45,000 | $59 | 50 |
| 906 Stanley St | 0.68mi | 2/1.0 | 728 (+8%) | 9mo | $161,000 | $221 | 47 |
| 925 Cleo St | 0.56mi | 2/1.0 | 750 (+12%) | 10mo | $71,000 | $95 | 46 |
Match score weights: distance 35% · size 25% · config 20% · recency 20%. Top-matched comps best support the ARV.
Projected returns pro-forma
-3.0% appreciation · 3.0% rent growth · sell at horizon
- IRR
- -9.4%
- Equity multiple
- 0.66×
- Total profit
- $-7,671
- Equity at exit
- $11,913
- IRR
- 0.2%
- Equity multiple
- 1.02×
- Total profit
- $348
- Equity at exit
- $6,908
Cash invested: $22,372 (down + closing). Projections, not guarantees.
Landlord ↔ Tenant lean methodology
- Overall (STATE)
- 62 Landlord-Friendly
- State Michigan
- 62 Landlord-Friendly · EVEN
- County
- — inherits STATE
- City
- — inherits STATE
ZIP-level market 48915
- Active inventory
- 68
- Price-to-rent
- 7.0×
Monthly cashflow live
- Estimated rent
- $946 high interval (Pro) →
- Mortgage (P&I)
- −$419
- Tax from tax record
- −$158 /mo · $1,900/yr
- Insurance
- −$33
- Flood insurance flood zone
- −$56 /mo · $666/yr
- HOA
- −$0
- Vacancy / Maint / Mgmt
- −$199
- Net cashflow
- $82
Break-even live
UW: 25.0% down · 7.5% · 30yr · 1.5% tax · 5.0% vac · 8.0% maint · 8.0% mgmt
Financing live
Cash to close
- Down payment
- $19,975
- Closing costs
- $2,397
- Reserves months
- —
- Total cash needed
- —
Loan-product check · same deal, 3 products live
Conventional
25% down · 7.5% · 30yr
- Down + closing
- —
- Monthly P&I
- —
- Monthly cashflow
- —
- DSCR
- —
- Eligible?
- —
Personal DTI + credit; lowest rate.
DSCR
20% down · 8.5% · 30yr
- Down + closing
- —
- Monthly P&I
- —
- Monthly cashflow
- —
- DSCR
- —
- Eligible?
- —
No personal income docs; deal must DSCR.
Hard money
10% down · 12.0% · 12mo
- Down + closing
- —
- Monthly P&I
- —
- Monthly cashflow
- —
- DSCR
- —
- Eligible?
- —
Short-term bridge; refi at stabilization.
Rent comps 20 comps
| Address | Beds | Baths | Sqft | Rent | $/sqft | DOM | Units | Dist |
|---|---|---|---|---|---|---|---|---|
| 1443 Roselawn Ave Lansing, MI | 2.0 | 1.0 | 656 | $750 | $1.14 | 43d | 1 | 0.20mi |
| 1010 N Pine St Unit B Lansing, MI | 2.0 | 1.0 | 750 | $1,100 | $1.47 | 43d | 1 | 0.50mi |
| 1216 N Chestnut St Lansing, MI | 1.0 | 1.0 | 562 | $900 | $1.60 | 13d | 1 | 0.52mi |
| 826 N Walnut St Lansing, MI | 1.0 | 1.0 | 700 | $700 | $1.00 | 43d | 2 | 0.71mi |
| 917 Seymour Ave Unit 3 Lansing, MI | 1.0 | 1.0 | 475 | $800 | $1.68 | 43d | 1 | 0.71mi |
| 504 W Lapeer St Apt A Lansing, MI | 2.0 | 1.0 | 600 | $895 | $1.49 | 43d | 1 | 0.77mi |
| 1016 N Capitol Ave Unit 3 Lansing, MI | 1.0 | 1.0 | 500 | $800 | $1.60 | 43d | 1 | 0.78mi |
| 1016 N Capitol Ave Unit 1 Lansing, MI | 1.0 | 1.0 | 700 | $850 | $1.21 | 43d | 1 | 0.78mi |
| 316 W Saginaw St Unit 318 Lansing, MI | 1.0 | 1.0 | 750 | $950 | $1.27 | 43d | 1 | 0.81mi |
| 1025 N Washington Ave Unit 9 Lansing, MI | 1.0 | 1.0 | 670 | $1,000 | $1.49 | 43d | 1 | 0.82mi |
| 927 W Shiawassee St Unit 10 Lansing, MI | 1.0 | 1.0 | 700 | $845 | $1.21 | 43d | 1 | 0.83mi |
| 801 N Capitol Ave Unit 1 Lansing, MI | 1.0 | 1.0 | 550 | $950 | $1.73 | 43d | 1 | 0.84mi |
| 801 N Capitol Ave Unit 4 Lansing, MI | 1.0 | 1.0 | 600 | $1,000 | $1.67 | 43d | 1 | 0.84mi |
| 220 W Lapeer St Unit 3 Lansing, MI | 1.0 | 1.0 | 450 | $850 | $1.89 | 43d | 1 | 0.91mi |
| 427 Seymour Ave Unit 315 Lansing, MI | 2.0 | 1.0 | 550 | $1,300 | $2.36 | 21d | 1 | 0.97mi |
| 427 Seymour Ave Unit 315 Lansing, MI | 2.0 | 1.0 | 550 | $1,300 | $2.36 | 43d | 1 | 0.97mi |
| 427 Seymour Ave Unit 102 Lansing, MI | 1.0 | 1.0 | 540 | $850 | $1.57 | 21d | 1 | 0.97mi |
| 427 Seymour Ave Unit 205 Lansing, MI | 1.0 | 1.0 | 570 | $1,100 | $1.93 | 43d | 1 | 0.97mi |
| 307 N Walnut St Unit 307 Lansing, MI | 1.0 | 1.0 | 550 | $1,100 | $2.00 | 43d | 1 | 1.03mi |
| 420 S Walnut St Lansing, MI | 1.0 | 1.0 | 525 | $875 | $1.67 | 43d | 1 | 1.46mi |
Listing history 30 events
-
2026-06-18days on market $79,900 Active 49 DOM
-
2026-06-17days on market $79,900 Active 48 DOM
-
2026-06-16days on market $79,900 Active 47 DOM
-
2026-06-15days on market $79,900 Active 46 DOM
-
2026-06-14days on market $79,900 Active 44 DOM
-
2026-06-13days on market $79,900 Active 43 DOM
-
2026-06-10days on market $79,900 Active 41 DOM
-
2026-06-09days on market $79,900 Active 40 DOM
-
2026-06-08days on market $79,900 Active 39 DOM
-
2026-06-07days on market $79,900 Active 38 DOM
-
2026-06-05days on market $79,900 Active 35 DOM
-
2026-06-03days on market $79,900 Active 34 DOM
-
2026-06-02days on market $79,900 Active 33 DOM
-
2026-06-01days on market $79,900 Active 32 DOM
-
2026-05-31days on market $79,900 Active 31 DOM
-
2026-05-30days on market $79,900 Active 30 DOM
-
2026-05-01$89,900 Active 457-char remark
Show marketing remark (457 chars)
Welcome home to 1335 N. Martin Luther King Blvd! This adorable Ranch home features two bedrooms with new carpet, a large living room, a nice sized kitchen, a full dry basement, a large partially fenced yard, and large front and rear covered porches! Many updates throughout including paint, flooring, and more! Immediate occupancy available so why rent when you can own for less money each month! This won't last long so schedule your private showing today!
-
2026-04-17historical
-
2026-04-17historical
-
2026-01-13price $89,900
-
2026-01-13price $89,900
-
2025-12-19$99,900 Active
-
2025-12-19$99,900 Active
-
2016-02-04soldstatus $16,900
-
2015-11-23$19,500
-
2011-09-22historical
-
2011-06-20$44,900
-
2010-06-15historical
-
2010-03-22$49,900
ⓘ Source: listings_history table (triggers on properties + properties_extension) + one-shot
backfill from property_details.listing_events for pre-trigger history.
Tax reassessment forecast MI · Partial reset (capped growth)
- Current annual tax
- $1,900 · $158/mo
- Projected year-2 tax
- $1,900 · $158/mo
- Expected delta
- $0/yr ($0/mo · 0.0%)
ⓘ Screening estimate from a state-policy table — verify with the county assessor before closing.
Climate risk First Street
- Flood 7/10 Severe FEMA zone X (unshaded) · 77% chance over 30 yrs
- Wildfire 1/10 Low
- Heat 3/10 Moderate 7 d/yr ≥97°F today · 16 d/yr by 30 yrs out
- Wind 2/10 Low
- Air quality 2/10 Low 1 unhealthy d/yr today · 2 by 30 yrs out
Nearby sold comps map
Loading sold comps map…
Walkable amenities ~0.75 mi
Loading nearby amenities…
Taxation est. · year 1
- Rental income
- $11,357
- − Mortgage interest
- −$4,476
- − Property taxes
- −$1,900
- − Insurance
- −$1,066
- − Repairs & maintenance
- −$909
- − Management
- −$909
- − Depreciation
- −$2,324
- Taxable loss
- −$226
- Est. tax savings @ 24.0%
- +$54
- After-tax cash flow
- $1,032/yr
For passive investors: Depreciation is non-cash, so a rental often shows a tax loss while cash-flowing — sheltering income. Rental losses are passive: they offset passive income freely, and up to $25,000/yr can offset ordinary (W-2) income if you actively participate and your MAGI is under $100k (phasing out to $0 by $150k); unused losses carry forward. On sale, claimed depreciation is recaptured at up to 25%, and gains may owe capital-gains tax (a 1031 exchange can defer both). Figures are a year-1 estimate at your 24.0% rate — not tax advice; consult a CPA.
Schools (NCES district)
- District
- Lansing Public School District
- NCES district ID
- 2621150
- Math proficiency
- 14% ▲ 1.00%
- Reading proficiency
- 23% ▲ 3.00%
- Median HH income
- $37,453
- Composite
- 18.76/100
- National rank
- #14002
- State rank
- #650 of 760 in MI
Livability — Lansing
- Score
- 79/100
- State rank
- #94
- US rank
- #2182
Category grades
Schools grade is shown separately in the Schools card above.
Census & demographics
- Census place
- Lansing, MI
- County
- Ingham County · 237,052 people
- City population
- 161,269
- Metro
- Lansing-East Lansing, MI
- Population (ZIP)
- 9,428
- Household income
- $54,465
- Rent vs Own
- Severe rent burden
- 307.0
Population outlook (Ingham County) Hauer SSP2
- Today (2025)
- 300,362 people
- By 2030
- 307,808 · +2.5%
- By 2040
- 320,492 · +6.7%
- By 2050
- 333,223 · +10.9%
- By 2075
- 373,693 · +24.4%
- By 2100
- 392,021 · +30.5%
Race, ethnicity, and origin ACS 2023
- Neighborhood character
- Diverse neighborhood (Simpson 0.64)
- Race & ethnicity
- White 54% Black 24% Two or more races 13% Hispanic / Latino 13%
- Hispanic origin (detail)
- Mexican 10%
- Common ancestry
- Romanian 7% Lithuanian 2% Iranian 2%
- Foreign-born
- 5% · Canada, Philippines
- Languages at home
- 90% English-only · Spanish 7% Other Asian/Pacific 1% German/W. Germanic 1%
Political lean MEDSL · Ingham
- 2024 margin
- Strong D (+29.7) · D 63.9% · R 34.2% · Other 2.0%
- 2008→2024 swing
- -3.6pp toward R · 2008: 33.3pp · 2024: 29.7pp
- All cycles
- 2024: D+29.7 2020: D+32.2 2016: D+27.6 2012: D+27.9 2008: D+33.3
Not yet ingested
- Civics
- —
Market trends
- HPI YoY
- ▼ -129.90%
- Current HPI
- 177.0906
- Rent YoY
- —
- Metro
- Lansing-East Lansing, MI
- State GDP YoY
- ▲ 1.37%
- F500 in state
- 28
Industry mix (Fortune 500 HQ in MI)
| Industry | F500 HQs | Revenue |
|---|---|---|
| Automotive Parts | 3 | $48B |
|
||
| Automotive | 2 | $372B |
|
||
| Chemicals | 1 | $45B |
|
||
| Automotive Retail | 1 | $29B |
|
||
| Healthcare / Medical Devices | 1 | $23B |
|
||
| Automotive Technology | 1 | $20B |
|
||
Price history
+60.1% since first listed16 events — show timeline
- 2026-05-29 Price Changed $79,900 REALCOMP
- 2026-05-29 Price Changed $79,900 Greater Lansing AoR
- 2026-05-01 Listed $89,900 Greater Lansing AoR
- 2026-05-01 Listed $89,900 REALCOMP
- 2026-04-17 Listing Removed — REALCOMP
- 2026-04-17 Listing Removed — Greater Lansing AoR
- 2026-01-13 Price Changed $89,900 REALCOMP
- 2026-01-13 Price Changed $89,900 Greater Lansing AoR
- 2025-12-19 Listed $99,900 REALCOMP
- 2025-12-19 Listed $99,900 Greater Lansing AoR
- 2016-02-04 Sold (MLS) $16,900 Greater Lansing AoR
- 2015-11-23 Listed $19,500 Greater Lansing AoR
- 2011-09-22 Listing Removed — Greater Lansing AoR
- 2011-06-20 Listed $44,900 Greater Lansing AoR
- 2010-06-15 Listing Removed — Greater Lansing AoR
- 2010-03-22 Listed $49,900 Greater Lansing AoR
Property tax history
+5.8%/yrLatest (2025): $1,900 · +2.9% YoY. Source: county tax records.
Cash-flow waterfall
monthlySold comps — $/sqft
last 12 mo · ≤1 miLoading sold comps…