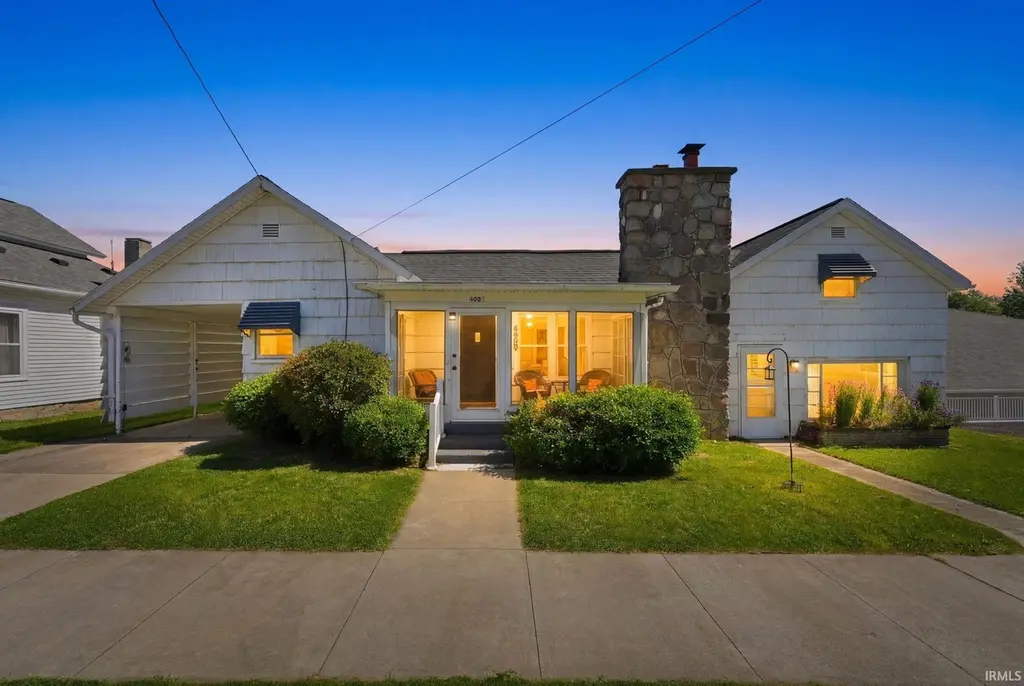
4000 E Church St · Hamilton, IN
Flood risk 1/10 · Minimal
- FEMA flood zone
- X (unshaded)
- Chance of flooding over 30 yrs
- 0.0%
- Est. flood insurance / yr
- $473 – $860
Fire risk 3/10 · Minor
- Est. fire insurance / yr
- $717 – $1,331
Heat risk 2/10 · Minimal
- Hot days now (above 100°F)
- 7 days/yr
- Hot days in 30 yrs
- 17 days/yr
Wind risk 2/10 · Minimal
- Chance of severe wind over 30 yrs
- —
Air-quality risk 2/10 · Minimal
- Unhealthy air days now
- 1 days/yr
- Unhealthy air days in 30 yrs
- 1 days/yr
Risk factors via First Street. Map © Google.
Why this score? — see what drove the C- grade
The composite is a weighted blend of 9 inputs, each scored 0–100. Each bar is that input's sub-score; the figure is the points it added to the 100-point composite (weight × sub-score).
- Cash flow +24.2/30.0
- DSCR +7.8/10.0
- ARV discount +6.4/15.0
- 1% rule +5.3/10.0
- Livability +3.2/5.0
- Rent growth +2.5/5.0
- Condition / age +2.5/5.0
- Schools +2.4/10.0
- Appreciation +0.0/10.0
$179,900
🖨 Deal sheet 📄 Offer letter ✓ Due diligence
Listing remarks MLS
This nicely maintained home has lots of charm and has been owned by the same family for over 70 years. Located in heart of a great community, this 3 bedroom 2 bath home has lots of space. The eat-in kitchen has newer appliances that are included in the sale. The living room walls are knotty pine and has a full wall fireplace with a gas log insert to take the chill off in the evenings. There is a den that could be used as an extra bedroom and it also has it's own bath and kitchen area. Great for an extended family member. The basement/crawl space is accessible from the inside and there is also an outside entrance for easy access. .. and you won't believe the storage! There is a 2 car attached garage with stairs leading up to a full floored attic. The large back yard is surrounded with a unique stone fence! Plenty of room for kids, pets & entertaining. The furnace and central AC are less than 5 years old. The roof is newer and several windows have been replaced. The electrical panel has been updated to a 200 amp service. There is a cute screened-in front porch too!
Key facts
- Large backyard
- Loft storage area
- Private entrance
Tags
Property features AI
Exterior
- Parking: Detached 2-car garage
- Utilities: Public water; Public sewer
- Home design: Single-family, site-built home; One story
- Construction: Wood siding
- Exterior features: Level lot; Lot dimensions approximately 60 x 132
Interior
- Kitchen: Refrigerator; Electric range
- Bathrooms: Two full bathrooms, both on the main level
- Heating & cooling: Natural gas forced-air heat; Central air conditioning
- Interior features: Gas log fireplace (1); Partial crawl space basement
- Laundry & utility: Main level laundry
Neighborhood map
What this means for you Summary
Snapshot
- This is a 3-bed/2.0-bath single-family listed at $180k.
Deal economics
- At list price, monthly cash flow is $359 ($4k/yr) — positive.
- The deal already cash-flows at list — no discount required.
- Meets the 1% rule at list price ($2k rent vs $180k).
- Recommended offer: $177k (1.5% below list) — sets the bar for market timing.
- Cap rate 8.7% vs local median 2.7% in Hamilton — top-decile yield for the area; either an underpriced asset or a hidden risk that comps aren't pricing in. Stress-test before assuming the spread holds.
Location & tenants
- Location reads 64/100 on livability (#384 in IN) — a middle-class / working-renter tenant base. Strengths: crime A+, cost of living A+, housing A+; Watch: amenities F, commute F, health & safety F.
- Hamilton Community Schools (rural): math 20% / reading 25% proficiency, ranked #300 of 324 in IN (top 93%) — low school quality limits family demand, transient renter base, plan for 1-2y turnover.
- Zoned schools: Hamilton Community Elementary Sch (math 47% / reading 37%, grade F, #434 of 994 statewide, top 48%, 166 students, 48% FRL); Hamilton Community High School (math 17% / reading 32%, grade F, #325 of 369 statewide, top 91%, 186 students, 42% FRL) — zoned schools average 45% FRL vs 30% district-wide (15 pts higher); higher-poverty schools than district average — tighter screening recommended.
- Market conditions: 35 active listings in the ZIP; 1 comparable units currently listed for rent nearby; 209 units permitted in Steuben County in 2024 (72 in 5+ unit buildings).
Forward outlook
- Local home prices are declining (-3.0%/yr); year-one equity from $1k of loan paydown is wiped out by about $5k of value loss. Plan a longer hold.
- Steuben County population projected at -13% by 2050 — secular population decline; favor cash flow + early exit over multi-decade hold.
Negotiation context
- It's been on market 16 days — a 2% lower offer ($177k) is reasonable based on typical stale-listing flexibility.
- 2 sale attempts since 6y ago with the ask held roughly flat each time — persistent listings suggest the price (not the market) is what's stuck; bring a comps-based counter.
- Current owner paid $130k; 38% above their basis — modest negotiation headroom, anchor on the comps not their cost.
Risks & watch-outs
- Watch-outs: built in 1895 — expect roof / HVAC / electrical / plumbing capex.
Questions for the listing agent
- Built in 1895 — when were the roof, HVAC, electrical panel, plumbing, and water heater last replaced?
- Is there a deadline driving the sale (1031 exchange, divorce, estate, relocation)? That informs how much negotiation room exists.
- Schools are F-rated, which usually means shorter tenancies and higher turnover. Who's the typical renter profile here, and what's been the actual vacancy rate?
- What's the average days-on-market for RENTAL listings here right now (not sales)? A rising rental-DOM trend means longer vacancies and softer asking-rent achievability than the comps imply.
- What's the recent tenant-quality profile in this submarket — average credit score on applications, eviction rate, late-payment / NSF rate, and stable-employment percentage? A property-management company in the area should have these aggregated.
- How much new for-sale + rental construction is in the pipeline within 1–3 miles? Heavy new supply typically softens prices + rents 12–24 months out; constrained supply supports both.
Investment metrics
- 1% rule
- 1.03% ✓
- Cap rate
- 8.69%
- Cash-on-cash
- 8.56%
- DSCR
- 1.38
- GRM
- 8.1
CMA / ARV
- ARV (on-the-fly)
- $175,536
- Comps found
- 7
Show comp detail 7 sales within ~0.75 mi
| Address | Dist | Beds/Ba | Sqft | Sold | Price | $/sf | Match |
|---|---|---|---|---|---|---|---|
| 4175 E Bellefontaine Rd | 0.17mi | 3/1.0 | 2,166 (+14%) | 9mo | $170,000 | $78 | 58 |
| 340 Ln 207 Hamilton Lk Ln | 0.47mi | 4/2.0 (+1) | 1,835 (-4%) | 10mo | $649,000 | $354 | 58 |
| 7790 S Water St | 0.07mi | 4/2.0 (+1) | 1,624 (-15%) | 14mo | $148,000 | $91 | 55 |
| 4225 E Bellefontaine Rd | 0.22mi | 4/1.5 (+1) | 1,664 (-13%) | 12mo | $163,500 | $98 | 52 |
| 7378 S Brookside Dr | 0.35mi | 3/2.5 | 2,168 (+14%) | 20mo | $200,000 | $92 | 42 |
| 812 S Wayne St | 0.57mi | 2/1.0 (-1) | 2,100 (+10%) | 14mo | $187,500 | $89 | 36 |
| 95 Lane 216 Hamilton Lk | 0.70mi | 3/2.0 | 2,132 (+12%) | 23mo | $565,000 | $265 | 29 |
Match score weights: distance 35% · size 25% · config 20% · recency 20%. Top-matched comps best support the ARV.
Projected returns pro-forma
-3.0% appreciation · 3.0% rent growth · sell at horizon
- IRR
- -3.3%
- Equity multiple
- 0.87×
- Total profit
- $-6,332
- Equity at exit
- $26,824
- IRR
- 6.3%
- Equity multiple
- 1.47×
- Total profit
- $23,707
- Equity at exit
- $15,554
Cash invested: $50,372 (down + closing). Projections, not guarantees.
Landlord ↔ Tenant lean methodology
- Overall (STATE)
- 90 Strongly Landlord-Friendly
- State Indiana
- 90 Strongly Landlord-Friendly · R+11
- County
- — inherits STATE
- City
- — inherits STATE
ZIP-level market 46742
- Home prices YoY
- -31.9%
- Active inventory
- 35
- Price-to-rent
- 8.1×
Monthly cashflow live
- Estimated rent
- $1,850 medium interval (Pro) →
- Mortgage (P&I)
- −$943
- Tax from tax record
- −$84 /mo · $1,007/yr
- Insurance
- −$75
- HOA
- −$0
- Vacancy / Maint / Mgmt
- −$388
- Net cashflow
- $359
Break-even live
UW: 25.0% down · 7.5% · 30yr · 1.5% tax · 5.0% vac · 8.0% maint · 8.0% mgmt
Financing live
Cash to close
- Down payment
- $44,975
- Closing costs
- $5,397
- Reserves months
- —
- Total cash needed
- —
Loan-product check · same deal, 3 products live
Conventional
25% down · 7.5% · 30yr
- Down + closing
- —
- Monthly P&I
- —
- Monthly cashflow
- —
- DSCR
- —
- Eligible?
- —
Personal DTI + credit; lowest rate.
DSCR
20% down · 8.5% · 30yr
- Down + closing
- —
- Monthly P&I
- —
- Monthly cashflow
- —
- DSCR
- —
- Eligible?
- —
No personal income docs; deal must DSCR.
Hard money
10% down · 12.0% · 12mo
- Down + closing
- —
- Monthly P&I
- —
- Monthly cashflow
- —
- DSCR
- —
- Eligible?
- —
Short-term bridge; refi at stabilization.
Rent comps 1 comps
| Address | Beds | Baths | Sqft | Rent | $/sqft | DOM | Units | Dist |
|---|---|---|---|---|---|---|---|---|
| 35 Lane 280 E Hamilton, IN | 3.0 | 1.0 | 1544 | $1,850 | $1.20 | 23d | 1 | 1.30mi |
Listing history 13 events
-
2026-06-19days on market $179,900 Active 16 DOM
-
2026-06-18days on market $179,900 Active 15 DOM
-
2026-06-17days on market $179,900 Active 14 DOM
-
2026-06-16days on market $179,900 Active 13 DOM
-
2026-06-15days on market $179,900 Active 12 DOM
-
2026-06-14days on market $179,900 Active 10 DOM
-
2026-06-12days on market $179,900 Active 9 DOM
-
2026-06-09days on market $179,900 Active 6 DOM
-
2026-06-08days on market $179,900 Active 5 DOM
-
2026-06-07days on market $179,900 Active 4 DOM
-
2026-06-07days on market $179,900 Active 3 DOM
-
2026-06-04remarks 532-char remark
-
2026-06-04$179,900 Active 1 DOM
ⓘ Source: listings_history table (triggers on properties + properties_extension) + one-shot
backfill from property_details.listing_events for pre-trigger history.
Tax reassessment forecast IN · Partial reset (capped growth)
- Current annual tax
- $1,007 · $84/mo
- Projected year-2 tax
- $1,268 · $106/mo
- Expected delta
- +$261/yr (+$22/mo · 25.9%)
ⓘ Screening estimate from a state-policy table — verify with the county assessor before closing.
Climate risk First Street
- Flood 1/10 Low FEMA zone X (unshaded) · 0% chance over 30 yrs
- Wildfire 3/10 Moderate
- Heat 2/10 Low 7 d/yr ≥100°F today · 17 d/yr by 30 yrs out
- Wind 2/10 Low
- Air quality 2/10 Low 1 unhealthy d/yr today · 1 by 30 yrs out
Nearby sold comps map
Loading sold comps map…
Walkable amenities ~0.75 mi
Loading nearby amenities…
Taxation est. · year 1
- Rental income
- $22,200
- − Mortgage interest
- −$10,077
- − Property taxes
- −$1,007
- − Insurance
- −$900
- − Repairs & maintenance
- −$1,776
- − Management
- −$1,776
- − Depreciation
- −$5,233
- Taxable income
- $1,431
- Est. tax owed @ 24.0%
- −$343
- After-tax cash flow
- $3,967/yr
For passive investors: Depreciation is non-cash, so a rental often shows a tax loss while cash-flowing — sheltering income. Rental losses are passive: they offset passive income freely, and up to $25,000/yr can offset ordinary (W-2) income if you actively participate and your MAGI is under $100k (phasing out to $0 by $150k); unused losses carry forward. On sale, claimed depreciation is recaptured at up to 25%, and gains may owe capital-gains tax (a 1031 exchange can defer both). Figures are a year-1 estimate at your 24.0% rate — not tax advice; consult a CPA.
Schools (NCES district)
- District
- Hamilton Community Schools
- NCES district ID
- 1804230
- Math proficiency
- 20% ▼ -20.00%
- Reading proficiency
- 25% ▼ -25.00%
- Median HH income
- $54,064
- Composite
- 23.5/100
- National rank
- #13286
- State rank
- #300 of 324 in IN
Livability — Hamilton
- Score
- 64/100
- State rank
- #384
- US rank
- #14236
Category grades
Schools grade is shown separately in the Schools card above.
Census & demographics
- Census place
- Hamilton, IN
- Population (ZIP)
- 3,126
Population outlook (Steuben County) Hauer SSP2
- Today (2025)
- 34,334 people
- By 2030
- 33,801 · -1.6%
- By 2040
- 32,076 · -6.6%
- By 2050
- 30,022 · -12.6%
- By 2075
- 25,626 · -25.4%
- By 2100
- 21,257 · -38.1%
Race, ethnicity, and origin ACS 2023
- Neighborhood character
- Predominantly White (98%)
- Race & ethnicity
- White 98% Two or more races 2%
- Common ancestry
- Romanian 3% Iranian 3% Italian 1%
- Foreign-born
- 1%
- Languages at home
- 99% English-only · Russian/Polish/Slavic 1%
Political lean MEDSL · Steuben
- 2024 margin
- Solid R (+42.1) · D 28.1% · R 70.2% · Other 1.6%
- 2008→2024 swing
- -32.3pp toward R · 2008: -9.8pp · 2024: -42.1pp
- All cycles
- 2024: R+42.1 2020: R+42.2 2016: R+44.0 2012: R+27.0 2008: R+9.8
Not yet ingested
- Civics
- —
Market trends
- HPI YoY
- ▼ -110.36%
- Current HPI
- 235.4538
- Rent YoY
- —
- Metro
- —
- State GDP YoY
- ▲ 2.90%
- F500 in state
- 18
Industry mix (Fortune 500 HQ in IN)
| Industry | F500 HQs | Revenue |
|---|---|---|
| Industrial Machinery | 2 | $37B |
|
||
| Healthcare | 1 | $177B |
|
||
| Pharmaceuticals | 1 | $45B |
|
||
| Metals / Steel | 1 | $18B |
|
||
| Agriculture | 1 | $17B |
|
||
| Packaging | 1 | $12B |
|
||
Price history
+38.9% since first listed3 events — show timeline
- 2026-06-03 Listed $179,900 IRMLS
- 2020-06-08 Sold (MLS) $130,000 IRMLS
- 2020-04-23 Listed $129,500 IRMLS
Property tax history
+63.6%/yrLatest (2024): $1,007 · +7.2% YoY. Source: county tax records.
Cash-flow waterfall
monthlySold comps — $/sqft
last 12 mo · ≤1 miLoading sold comps…