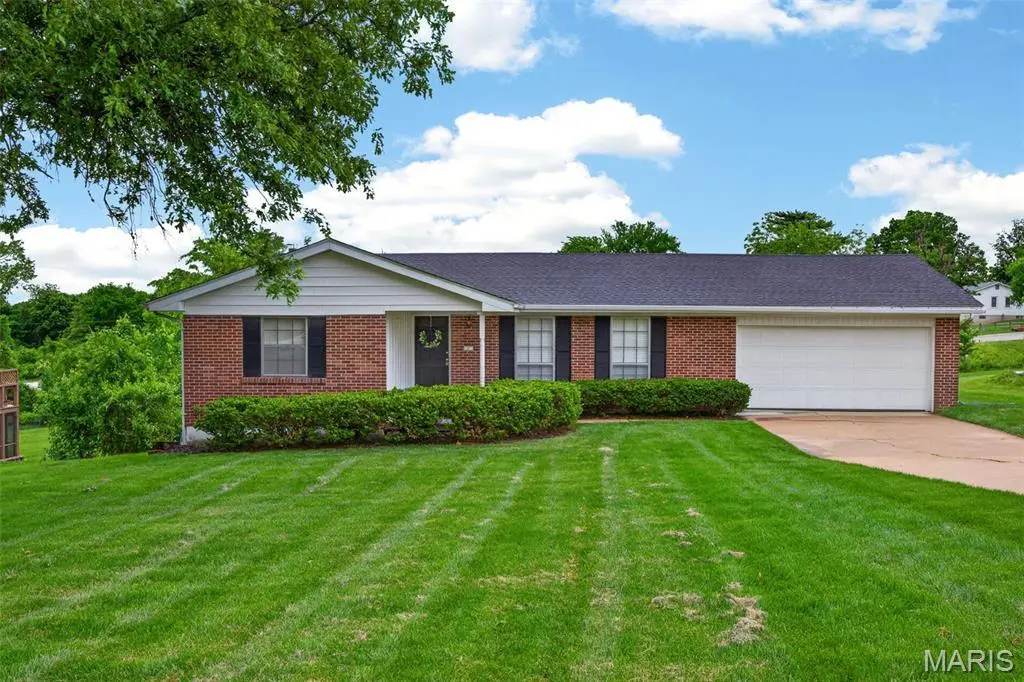
7 Countryside Dr · Weldon Spring, MO
Flood risk 1/10 · Minimal
- FEMA flood zone
- X (unshaded)
- Chance of flooding over 30 yrs
- 0.0%
- Est. flood insurance / yr
- $473 – $860
Fire risk 1/10 · Minimal
- Est. fire insurance / yr
- $1,054 – $1,958
Heat risk 5/10 · Moderate
- Hot days now (above 107°F)
- 7 days/yr
- Hot days in 30 yrs
- 20 days/yr
Wind risk 2/10 · Minimal
- Chance of severe wind over 30 yrs
- 1.0%
Air-quality risk 2/10 · Minimal
- Unhealthy air days now
- 2 days/yr
- Unhealthy air days in 30 yrs
- 2 days/yr
Risk factors via First Street. Map © Google.
Why this score? — see what drove the D grade
The composite is a weighted blend of 9 inputs, each scored 0–100. Each bar is that input's sub-score; the figure is the points it added to the 100-point composite (weight × sub-score).
- ARV discount +14.4/15.0
- Cash flow +8.0/30.0
- Schools +5.2/10.0
- Livability +3.7/5.0
- Rent growth +3.1/5.0
- Condition / age +2.5/5.0
- DSCR +2.1/10.0
- 1% rule +1.7/10.0
- Appreciation +0.0/10.0
$349,500
🖨 Deal sheet (PDF) 📄 Offer letter ✓ Due diligence
Listing remarks
Welcome to 7 Countryside Dr—where space, updates, and convenience come together in a beautiful brick ranch setting. Nestled on over half an acre, this home offers a rare blend of privacy and accessibility just off MO-94, with quick connections to Hwy 364 and Mid Rivers Mall Drive for effortless access to shopping, dining, and entertainment. Step inside to find fresh interior paint, NEW FLOORING, and an abundance of natural sunlight that fills the home with warmth. The kitchen shines with NEW APPLIANCES and flows seamlessly into the main living areas—perfect for everyday living and entertaining alike. The hall shower/tub/sink & faucet is new as is the walk-in shower in the
Key facts
- 0.61 acre lot
- 2 garage spots
- Built 1970
Property features AI
Finance
- Other: Living area reported as approximately 1,990 total (1,210 above grade, 680 below grade)
- Financial info: Seller may consider concessions; Lease not considered
Exterior
- Parking: Attached 2-car garage; Driveway parking; Concrete surfaces; Garage faces front; Private parking
- Security: Smoke detectors; Carbon monoxide detectors
- Utilities: Public water; Public sewer; Electricity connected (Ameren); Sewer connected; Water connected
- Home design: Single-family residence; One story (main living level with finished lower level); Private ownership
- Construction: Brick, frame, and vinyl siding exterior; Architectural shingle/asphalt roof; Concrete perimeter foundation; Has basement (full, partially finished, concrete, egress window, bathroom, French drain, walk-out access)
- Exterior features: Front porch and additional porch/patio; Extended patio; Private yard; Adjoins common ground; Few trees and natural foliage; Level lot; Rain gutters; Sliding door(s)
Interior
- Kitchen: Dishwasher; Disposal; Microwave; Free‑standing electric oven/range; Free‑standing refrigerator; Laminate counters; New appliances
- Bedrooms: Three bedrooms located on the main level; Primary bedroom includes a private bathroom with a new vanity
- Flooring: Ceramic tile; Vinyl
- Bathrooms: Three full bathrooms total (two on main level, one in lower level/basement)
- Heating & cooling: Forced air heating; Central air conditioning; Ceiling fans; Electric cooling with humidity control
- Interior features: Bar; Ceiling fans; Eat-in kitchen; Laminate counters; Storage; New paint and flooring in several rooms; Walk-out access from family room to extended patio
- Laundry & utility: Laundry in basement/lower level with washer and electric dryer hookups; Electric water heater; Sump pump; Humidifier
Neighborhood map
What this means for you Summary
Snapshot
- This is a 3-bed/2.5-bath single-family listed at $350k.
Deal economics
- At list price, monthly cash flow is $-353 ($-4k/yr) — negative.
- To cash-flow at today's rent, offer at most $287k (17.9% below list).
- To meet the 1% rule (rent ≥ 1% of price), the offer needs to be $233k (33.4% below list).
- Recommended offer: $233k (33.4% below list) — sets the bar for 1% rule.
- Cap rate 5.1% vs local median 2.4% in Weldon Spring — top-decile yield for the area; either an underpriced asset or a hidden risk that comps aren't pricing in. Stress-test before assuming the spread holds.
Location & tenants
- Location reads 73/100 on livability (#78 in MO) — a middle-class / working-renter tenant base. Strengths: crime A+, employment A+, housing A+; Watch: health & safety C-, amenities F, commute F.
- Francis Howell R-III (suburban): math 53% / reading 63% proficiency, ranked #11 of 324 in MO (top 3%) — acceptable for families but not a draw, mixed tenant base, ~2y average lease; only 15% free/reduced lunch — higher-income household profile.
- Zoned schools: Warren Elem. (math 63% / reading 70%, grade B+, #57 of 1,115 statewide, top 5%, 762 students, 9% FRL); Francis Howell Central High (math 36% / reading 74%, grade C, #65 of 521 statewide, top 13%, 1,805 students, 18% FRL) — zoned schools at 13% FRL track the district average.
- Market conditions: Rents rising (+2.5%/yr); 278 active listings in the ZIP; 4 comparable units currently listed for rent nearby; rentals leasing fast (median 4d on market — plan ~1-2 weeks tenant-placement turnaround); high-income renter base; 2,021 units permitted in St. Charles County in 2024 (568 in 5+ unit buildings).
Forward outlook
- Local home prices are declining (-3.0%/yr); year-one equity from $2k of loan paydown is wiped out by about $10k of value loss. Plan a longer hold.
- St. Charles County population projected at +22% by 2050 — long-run rental-demand tailwind backs the buy-and-hold thesis.
Negotiation context
- It's been on market 16 days — a 2% lower offer ($344k) is reasonable based on typical stale-listing flexibility.
- Current owner paid $135k; list at $350k implies a 159% gain — meaningful room to come down on a strong offer.
Risks & watch-outs
- Climate carrying-cost: extreme-heat days projected 7→20/yr by 2055 (HVAC capex compounding) — expect insurance premiums to compound above CPI over the hold.
Questions for the listing agent
- What do current leases actually rent for vs. the listed asking? Can we see a recent rent roll and the last 12 months of T-12 income?
- Built in 1970 — when were the roof, HVAC, electrical panel, plumbing, and water heater last replaced?
- Is there a deadline driving the sale (1031 exchange, divorce, estate, relocation)? That informs how much negotiation room exists.
- Schools are A-rated — typically a magnet for longer-tenancy family renters. What's the average tenant stay here, and is there a school-zone premium baked into asking?
- The area grade is low — what's the realistic commute time and amenity access for the typical tenant pool here? Any planned neighborhood developments (good or bad) we should know about?
- What's the average days-on-market for RENTAL listings here right now (not sales)? A rising rental-DOM trend means longer vacancies and softer asking-rent achievability than the comps imply.
- What's the recent tenant-quality profile in this submarket — average credit score on applications, eviction rate, late-payment / NSF rate, and stable-employment percentage? A property-management company in the area should have these aggregated.
- How much new for-sale + rental construction is in the pipeline within 1–3 miles? Heavy new supply typically softens prices + rents 12–24 months out; constrained supply supports both.
Investment metrics
- 1% rule
- 0.67% ✗
- Cap rate
- 5.08%
- Cash-on-cash
- -4.33%
- DSCR
- 0.81
- GRM
- 12.5
CMA / ARV
- ARV (median comp)
- $412,496
- List price
- $349,500
- Delta
- -15.27%
- Verdict
- UNDERPRICED
- Comps
- 20 within 1.0 mi
Show comp detail 9 sales within ~0.75 mi
| Address | Dist | Beds/Ba | Sqft | Sold | Price | $/sf | Match |
|---|---|---|---|---|---|---|---|
| 141 Venice Cir | 0.42mi | 3/2.0 | 1,810 (-9%) | 9mo | $409,900 | $226 | 56 |
| 5203 Shetland Dr | 0.59mi | 3/2.0 | 2,083 (+5%) | 15mo | $600,000 | $288 | 51 |
| 334 San Marco Way | 0.51mi | 2/2.0 (-1) | 1,864 (-6%) | 13mo | $450,000 | $241 | 48 |
| 127 Bright Gem Dr | 0.55mi | 4/2.5 (+1) | 2,117 (+6%) | 14mo | $450,000 | $213 | 47 |
| 392 Magnolia Blossom Ct | 0.69mi | 2/2.0 (-1) | 2,065 (+4%) | 10mo | $599,900 | $291 | 46 |
| 110 Prairie Meadow Ct | 0.43mi | 3/2.0 | 1,792 (-10%) | 19mo | $475,000 | $265 | 45 |
| 20 Golden Ridge Ct | 0.75mi | 4/2.5 (+1) | 2,262 (+14%) | 11mo | $450,000 | $199 | 28 |
| 5461 Precious Stone Dr | 0.60mi | 3/2.0 | 1,694 (-15%) | 22mo | $415,000 | $245 | 27 |
| 391 Magnolia Blossom Ct | 0.73mi | 2/2.0 (-1) | 1,708 (-14%) | 21mo | $525,000 | $307 | 18 |
Match score weights: distance 35% · size 25% · config 20% · recency 20%. Top-matched comps best support the ARV.
Projected returns pro-forma
-3.0% appreciation · 2.52% rent growth · sell at horizon
- IRR
- -24.1%
- Equity multiple
- 0.18×
- Total profit
- $-80,352
- Equity at exit
- $52,112
- IRR
- -20.8%
- Equity multiple
- -0.06×
- Total profit
- $-103,899
- Equity at exit
- $30,218
Cash invested: $97,860 (down + closing). Projections, not guarantees.
Landlord ↔ Tenant lean methodology
- Overall (STATE)
- 81 Strongly Landlord-Friendly
- State Missouri
- 81 Strongly Landlord-Friendly · R+10
- County
- — inherits STATE
- City
- — inherits STATE
ZIP-level market 63304
- Rents YoY
- 2.5%
- Active inventory
- 278
- Price-to-rent
- 12.5×
Monthly cashflow live
- Estimated rent
- $2,327 medium interval (Pro) →
- Mortgage (P&I)
- −$1,833
- Tax from tax record
- −$213 /mo · $2,555/yr
- Insurance
- −$146
- HOA
- −$0
- Vacancy / Maint / Mgmt
- −$489
- Net cashflow
- $-353
Break-even live
Sensitivity live
| Price | -10% $-155 | -5% $-254 | +0% $-353 | +5% $-452 | +10% $-551 |
|---|---|---|---|---|---|
| Rent | -10% $-537 | -5% $-445 | +0% $-353 | +5% $-261 | +10% $-169 |
| Rate | -1.0pp $-177 | -0.5pp $-264 | base $-353 | +0.5pp $-444 | +1.0pp $-536 |
UW: 25.0% down · 7.5% · 30yr · 1.5% tax · 5.0% vac · 8.0% maint · 8.0% mgmt
Financing live
Cash to close
- Down payment
- $87,375
- Closing costs
- $10,485
- Reserves months
- —
- Total cash needed
- —
Loan-product check · same deal, 3 products live
Conventional
25% down · 7.5% · 30yr
- Down + closing
- —
- Monthly P&I
- —
- Monthly cashflow
- —
- DSCR
- —
- Eligible?
- —
Personal DTI + credit; lowest rate.
DSCR
20% down · 8.5% · 30yr
- Down + closing
- —
- Monthly P&I
- —
- Monthly cashflow
- —
- DSCR
- —
- Eligible?
- —
No personal income docs; deal must DSCR.
Hard money
10% down · 12.0% · 12mo
- Down + closing
- —
- Monthly P&I
- —
- Monthly cashflow
- —
- DSCR
- —
- Eligible?
- —
Short-term bridge; refi at stabilization.
Rent comps 4 comps
| Address | Beds | Baths | Sqft | Rent | $/sqft | DOM | Units | Dist |
|---|---|---|---|---|---|---|---|---|
| 4801 Greenburg Dr Saint Peters, MO | 4.0 | 2.5 | 2500 | $2,606 | $1.04 | 8d | 1 | 0.87mi |
| 100 Grenache Blanc Dr St Peters, MO | 1.0–3.0 | 1.0–2.0 | 1203 | $2,098 | $1.74 | 2d | 27 | 0.97mi |
| 2000 Styling Ridge Dr Saint Charles, MO | 1.0–3.0 | 1.0–2.0 | 1042 | $1,889 | $1.81 | 3d | 9 | 1.07mi |
| 106 Estes Dr St Peters, MO | 2.0–3.0 | 2.5 | 1518 | $2,800 | $1.84 | 4d | 5 | 1.36mi |
Listing history 8 events
-
2026-05-19price $349,500 1239-char remark
-
2026-05-14price $355,000 1239-char remark
-
2026-05-06$365,000 Active 1239-char remark
-
2026-04-29historical $365,000 1239-char remark
-
2026-02-17soldstatus
-
2002-12-04soldstatus $135,000
-
2002-11-14soldstatus
-
1994-01-01soldstatus
ⓘ Source: listings_history table (triggers on properties + properties_extension) + one-shot
backfill from property_details.listing_events for pre-trigger history.
Tax reassessment forecast MO · Resets to sale price
- Current annual tax
- $2,555 · $213/mo
- Projected year-2 tax
- $3,390 · $283/mo
- Expected delta
- +$835/yr (+$70/mo · 32.7%)
ⓘ Screening estimate from a state-policy table — verify with the county assessor before closing.
Climate risk First Street
- Flood 1/10 Low FEMA zone X (unshaded) · 0% chance over 30 yrs
- Wildfire 1/10 Low
- Heat 5/10 Major 7 d/yr ≥107°F today · 20 d/yr by 30 yrs out
- Wind 2/10 Low 100% chance of damaging wind over 30 yrs
- Air quality 2/10 Low 2 unhealthy d/yr today · 2 by 30 yrs out
Nearby sold comps map
Loading sold comps map…
Walkable amenities ~0.75 mi
Loading nearby amenities…
Taxation est. · year 1
- Rental income
- $27,921
- − Mortgage interest
- −$19,577
- − Property taxes
- −$2,555
- − Insurance
- −$1,748
- − Repairs & maintenance
- −$2,234
- − Management
- −$2,234
- − Depreciation
- −$10,167
- Taxable loss
- −$10,594
- Est. tax savings @ 24.0%
- +$2,542
- After-tax cash flow
- $-1,696/yr
For passive investors: Depreciation is non-cash, so a rental often shows a tax loss while cash-flowing — sheltering income. Rental losses are passive: they offset passive income freely, and up to $25,000/yr can offset ordinary (W-2) income if you actively participate and your MAGI is under $100k (phasing out to $0 by $150k); unused losses carry forward. On sale, claimed depreciation is recaptured at up to 25%, and gains may owe capital-gains tax (a 1031 exchange can defer both). Figures are a year-1 estimate at your 24.0% rate — not tax advice; consult a CPA.
Schools (NCES district)
- District
- Francis Howell R-III
- NCES district ID
- 2928950
- Math proficiency
- 53% ▼ -12.00%
- Reading proficiency
- 63% ▼ -5.00%
- Median HH income
- $79,768
- Composite
- 52.23/100
- National rank
- #1602
- State rank
- #11 of 324 in MO
Livability — Weldon Spring
- Score
- 73/100
- State rank
- #78
- US rank
- #5250
Category grades
Schools grade is shown separately in the Schools card above.
Census & demographics
- County
- Saint Charles County · 399,703 people
- Metro
- St. Louis, MO-IL
- Population (ZIP)
- 43,195
- Household income
- $114,442
- Rent vs Own
- Severe rent burden
- 560.0
Population outlook (St. Charles County) Hauer SSP2
- Today (2025)
- 437,857 people
- By 2030
- 461,707 · +5.4%
- By 2040
- 503,222 · +14.9%
- By 2050
- 534,684 · +22.1%
- By 2075
- 597,047 · +36.4%
- By 2100
- 609,682 · +39.2%
Race, ethnicity, and origin ACS 2023
- Neighborhood character
- Predominantly White (87%)
- Race & ethnicity
- White 87% Two or more races 4% Hispanic / Latino 4% Black 4% Asian 2%
- Common ancestry
- Lithuanian 3% Romanian 3% Italian 3%
- Foreign-born
- 5% · Canada
- Languages at home
- 95% English-only · Spanish 2% Other Indo-European 1% Russian/Polish/Slavic 1%
Political lean MEDSL · St. Charles
- 2024 margin
- R (+17.0) · D 40.8% · R 57.8% · Other 1.4%
- 2008→2024 swing
- -7.2pp toward R · 2008: -9.7pp · 2024: -17.0pp
- All cycles
- 2024: R+17.0 2020: R+17.5 2016: R+26.4 2012: R+21.0 2008: R+9.7
Not yet ingested
- Civics
- —
Market trends
- HPI YoY
- ▼ -225.72%
- Current HPI
- 233.745
- Rent YoY
- ▲ 2.52%
- Metro
- St. Louis, MO-IL
- State GDP YoY
- ▲ 1.84%
- F500 in state
- 20
Industry mix (Fortune 500 HQ in MO)
| Industry | F500 HQs | Revenue |
|---|---|---|
| Healthcare | 1 | $163B |
|
||
| Insurance | 1 | $21B |
|
||
| Industrial Technology | 1 | $17B |
|
||
| Retail | 1 | $16B |
|
||
| Industrial Distribution | 1 | $10B |
|
||
| Utilities | 1 | $9B |
|
||
Price history
+158.9% since first listed9 events — show timeline
- 2026-05-21 Pending — MARIS as Distributed by MLS Grid
- 2026-05-19 Price Changed $349,500 MARIS as Distributed by MLS Grid
- 2026-05-14 Price Changed $355,000 MARIS as Distributed by MLS Grid
- 2026-05-06 Listed $365,000 MARIS as Distributed by MLS Grid
- 2026-04-29 Coming Soon $365,000 MARIS as Distributed by MLS Grid
- 2026-02-17 Sold (Public Records) — Public Records
- 2002-12-04 Sold (Public Records) $135,000 Public Records
- 2002-11-14 Sold (Public Records) — Public Records
- 1994-01-01 Sold (Public Records) — Public Records
Property tax history
+3.8%/yrLatest (2025): $2,555 · +12.3% YoY. Source: county tax records.
Cash-flow waterfall
monthlySold comps — $/sqft
last 12 mo · ≤1 miLoading sold comps…