 Multi-family
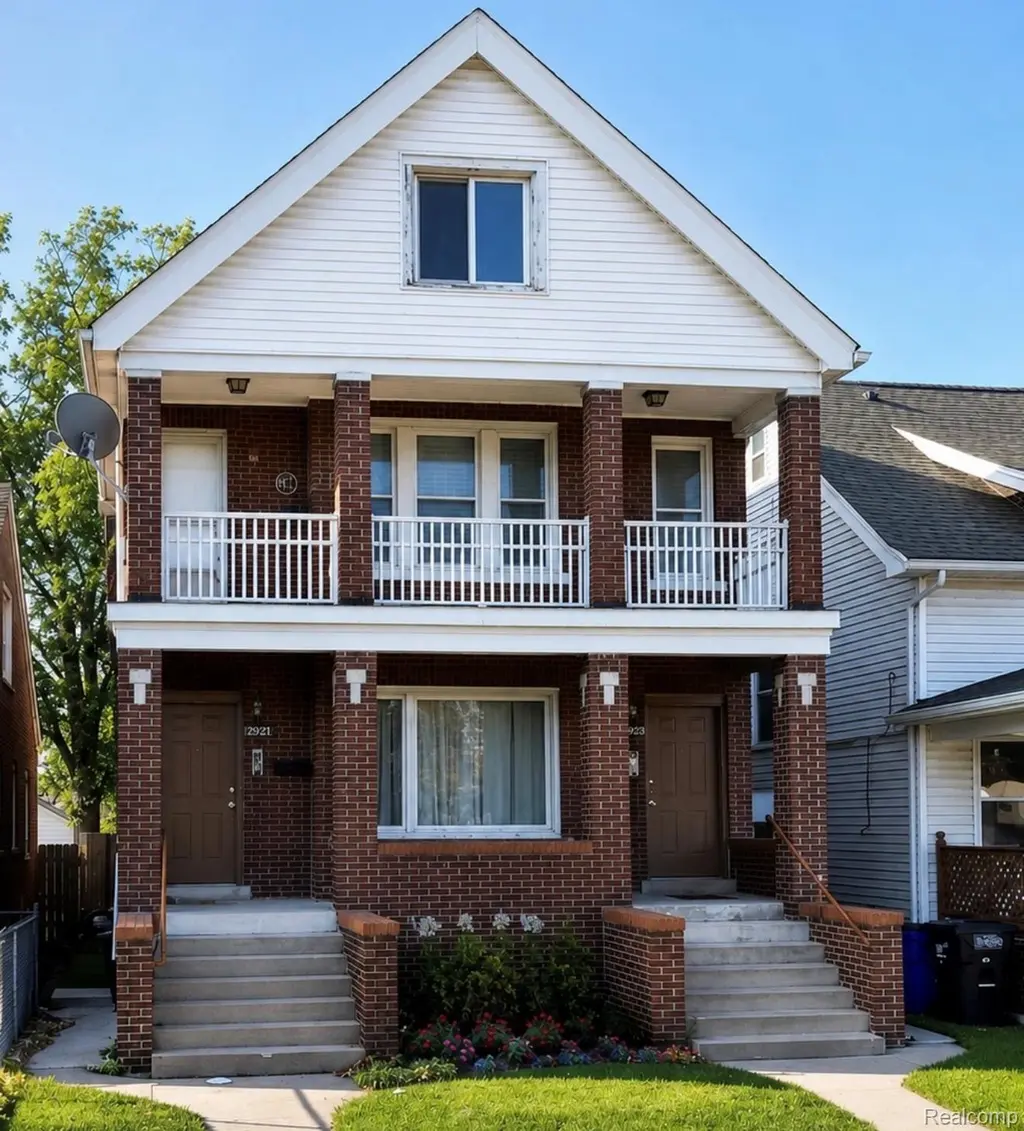
2393 N Green St · Detroit, MI
Flood risk 1/10 · Minimal
- FEMA flood zone
- X (unshaded)
- Chance of flooding over 30 yrs
- 0.0%
- Est. flood insurance / yr
- $473 – $860
Fire risk 1/10 · Minimal
- Est. fire insurance / yr
- $784 – $1,456
Heat risk 3/10 · Minor
- Hot days now (above 95°F)
- 7 days/yr
- Hot days in 30 yrs
- 15 days/yr
Wind risk 2/10 · Minimal
- Chance of severe wind over 30 yrs
- —
Air-quality risk 4/10 · Minor
- Unhealthy air days now
- 6 days/yr
- Unhealthy air days in 30 yrs
- 8 days/yr
Risk factors via First Street. Map © Google.
Why this score? — see what drove the C grade
The composite is a weighted blend of 9 inputs, each scored 0–100. Each bar is that input's sub-score; the figure is the points it added to the 100-point composite (weight × sub-score).
- Cash flow +20.3/30.0
- Appreciation +10.0/10.0
- DSCR +6.4/10.0
- 1% rule +5.2/10.0
- ARV discount +3.8/15.0
- Livability +3.7/5.0
- Rent growth +2.5/5.0
- Condition / age +2.5/5.0
- Schools +1.3/10.0
$239,500
🖨 Deal sheet 📄 Offer letter ✓ Due diligence
Multi-family units
County records classify this as Multi-Family (2-4 Unit). Listing-text estimate: 1 unit. estimate disagrees with records
Listing remarks MLS
Excellent investment opportunity in the heart of Southwest Detroit! This versatile multi-family property offers strong income-producing potential with separate utilities, including individual water, gas, and electric services for each unit. The first unit features 3 bedrooms, a spacious living room, formal dining room, and kitchen. The second unit offers 2 bedrooms, a full living room, dining room, kitchen, and potential for a third bedroom, providing flexibility for increased rental income. Additional features include a full basement, detached garage, off-street parking, and separate utility services, making management convenient for both owner-occupants and investors. With solid rental potential and room to add value, this property presents an excellent opportunity to build long-term wealth through real estate. Whether you're looking to expand your portfolio or live in one unit while generating income from the other, this property is worth a look. Schedule your showing today! 2393 Green Street | Detroit, MI 48209 2 Units | Separate Utilities | Garage | Basement | Off-Street Parking Great Investment Potential
Key facts
- Separate utilities
- Full basement
- Off-street parking
Tags
Property features AI
Finance
- Other:
- Financial info:
- HOA & community:
Exterior
- Parking:
- Security:
- Utilities: Public water; Public sewer
- Home design: Multi-family residential income property; Two levels
- Construction: Brick construction; Block foundation
- Exterior features: Paved road access; Lot dimensions approximately 30 x 121 (0.08 acres); Zoned for multiple uses; Pets not allowed
Interior
- Kitchen:
- Bedrooms:
- Flooring:
- Bathrooms: Two full bathrooms and one half bathroom
- Heating & cooling: Forced air heating; Natural gas heating; No central cooling
- Interior features: Unfinished basement
- Laundry & utility:
Neighborhood map
What this means for you Summary
Snapshot
- This is a 5-bed/2.5-bath multifamily listed at $240k.
Deal economics
- At list price, monthly cash flow is $306 ($4k/yr) — positive.
- The deal already cash-flows at list — no discount required.
- Meets the 1% rule at list price ($2k rent vs $240k).
- Recommended offer: $236k (1.5% below list) — sets the bar for market timing.
- Cap rate 7.8% vs local median 10.2% in Detroit — below-typical yield; the buyer is paying a premium for something (appreciation thesis, condition, location) that the cap rate doesn't capture.
Location & tenants
- Location reads 73/100 on livability (#218 in MI) — a middle-class / working-renter tenant base. Strengths: amenities A+, commute A+, cost of living A+; Watch: schools F, crime F, employment F.
- Detroit Public Schools Community District (urban): math 10% / reading 24% proficiency, ranked #499 of 540 in MI (top 92%) — low school quality limits family demand, transient renter base, plan for 1-2y turnover; 90% free/reduced lunch — lower-income household profile, screen leases tightly.
- Market conditions: 66 active listings in the ZIP; 2 comparable units currently listed for rent nearby; lower-income renter base — watch delinquency; 2,639 units permitted in Wayne County in 2024 (1,216 in 5+ unit buildings).
- At $2,448/mo this rent would consume 68% of the median local household income ($43k/yr) (locally 831% of renters already pay >50% of income on rent) — very limited rent-growth headroom before tenants either downsize or default.
Forward outlook
- In year one you build about $26k of equity ($2k loan paydown + $24k appreciation (10.0% local appreciation)).
- Wayne County population projected at -17% by 2050 — secular population decline; favor cash flow + early exit over multi-decade hold.
- At projected returns (10.0% appreciation + 3.0% rent growth), your $67k cash investment doubles in ~3 years — after that, you're playing with house money.
- By year 2, paydown + projected appreciation supports a ~$41k cash-out refi (75% LTV) — recoverable capital for the next deal without selling this one.
Negotiation context
- It's been on market 16 days — a 2% lower offer ($236k) is reasonable based on typical stale-listing flexibility.
- 4 sale attempts since 10y ago with the ask held roughly flat each time — persistent listings suggest the price (not the market) is what's stuck; bring a comps-based counter.
- Current owner paid $40k; list at $240k implies a 499% gain — meaningful room to come down on a strong offer.
Risks & watch-outs
- Watch-outs: built in 1917 — expect roof / HVAC / electrical / plumbing capex.
Questions for the listing agent
- Built in 1917 — when were the roof, HVAC, electrical panel, plumbing, and water heater last replaced?
- Is there a deadline driving the sale (1031 exchange, divorce, estate, relocation)? That informs how much negotiation room exists.
- Schools are F-rated, which usually means shorter tenancies and higher turnover. Who's the typical renter profile here, and what's been the actual vacancy rate?
- Crime grade is F in this area — have there been break-ins, vandalism, or insurance claims at this property in the last 3 years? What carrier currently insures it and at what premium?
- What's the average days-on-market for RENTAL listings here right now (not sales)? A rising rental-DOM trend means longer vacancies and softer asking-rent achievability than the comps imply.
- What's the recent tenant-quality profile in this submarket — average credit score on applications, eviction rate, late-payment / NSF rate, and stable-employment percentage? A property-management company in the area should have these aggregated.
- How much new apartment / multifamily construction is in the pipeline within 1–3 miles? Heavy new supply (>2% of stock underway) typically softens rents 12–24 months out; light construction supports rent growth.
Investment metrics
- 1% rule
- 1.02% ✓
- Cap rate
- 7.83%
- Cash-on-cash
- 5.48%
- DSCR
- 1.24
- GRM
- 8.2
CMA / ARV
- ARV (on-the-fly)
- $221,464
- Comps found
- 4
Show comp detail 4 sales within ~0.75 mi
| Address | Dist | Beds/Ba | Sqft | Sold | Price | $/sf | Match |
|---|---|---|---|---|---|---|---|
| 1943 Central St | 0.33mi | 6/2.0 (+1) | 2,200 (-7%) | 10mo | $110,000 | $50 | 58 |
| 1216 Waterman St | 0.72mi | 6/2.5 (+1) | 2,500 (+6%) | 6mo | $235,000 | $94 | 47 |
| 7753-7755 Senator St | 0.31mi | 4/2.0 (-1) | 2,016 (-14%) | 12mo | $165,000 | $82 | 45 |
| 2555 Military St | 0.67mi | 4/2.0 (-1) | 2,200 (-7%) | 13mo | $240,000 | $109 | 40 |
Match score weights: distance 35% · size 25% · config 20% · recency 20%. Top-matched comps best support the ARV.
Projected returns pro-forma
10.0% appreciation · 3.0% rent growth · sell at horizon
- IRR
- 28.3%
- Equity multiple
- 3.24×
- Total profit
- $149,956
- Equity at exit
- $215,761
- IRR
- 24.6%
- Equity multiple
- 7.36×
- Total profit
- $426,304
- Equity at exit
- $465,296
Cash invested: $67,060 (down + closing). Projections, not guarantees.
Landlord ↔ Tenant lean methodology
- Overall (STATE)
- 62 Landlord-Friendly
- State Michigan
- 62 Landlord-Friendly · EVEN
- County
- — inherits STATE
- City
- — inherits STATE
ZIP-level market 48209
- Home prices YoY
- 21.8%
- Active inventory
- 66
- Price-to-rent
- 15.8×
Monthly cashflow live
- Estimated rent
- $2,448 high interval (Pro) →
- Mortgage (P&I)
- −$1,256
- Tax from tax record
- −$272 /mo · $3,264/yr
- Insurance
- −$100
- HOA
- −$0
- Vacancy / Maint / Mgmt
- −$514
- Net cashflow
- $306
Break-even live
2-unit breakdown (identical units grouped — click to expand)
| Units | Beds | Baths | Est. rent |
|---|---|---|---|
| 1× unit | 3 | 1 | $1,266 |
| 1× unit | 2 | 1 | $1,182 |
| Total (2 units) | $2,448 | ||
UW: 25.0% down · 7.5% · 30yr · 1.5% tax · 5.0% vac · 8.0% maint · 8.0% mgmt
Financing live
Cash to close
- Down payment
- $59,875
- Closing costs
- $7,185
- Reserves months
- —
- Total cash needed
- —
Loan-product check · same deal, 3 products live
Conventional
25% down · 7.5% · 30yr
- Down + closing
- —
- Monthly P&I
- —
- Monthly cashflow
- —
- DSCR
- —
- Eligible?
- —
Personal DTI + credit; lowest rate.
DSCR
20% down · 8.5% · 30yr
- Down + closing
- —
- Monthly P&I
- —
- Monthly cashflow
- —
- DSCR
- —
- Eligible?
- —
No personal income docs; deal must DSCR.
Hard money
10% down · 12.0% · 12mo
- Down + closing
- —
- Monthly P&I
- —
- Monthly cashflow
- —
- DSCR
- —
- Eligible?
- —
Short-term bridge; refi at stabilization.
Rent comps 2 comps
| Address | Beds | Baths | Sqft | Rent | $/sqft | DOM | Units | Dist |
|---|---|---|---|---|---|---|---|---|
| 8804 Mason Pl Detroit, MI | 5.0 | 2.0 | 1680 | $2,800 | $1.67 | 1d | 1 | 0.84mi |
| 1646 Mc Kinstry St Unit 1F McKinstry Detroit, MI | 4.0 | 1.0 | 1879 | $1,200 | $0.64 | 4d | 1 | 1.34mi |
Listing history 11 events
-
2026-06-18days on market $239,500 Active 16 DOM
-
2026-06-17days on market $239,500 Active 15 DOM
-
2026-06-16days on market $239,500 Active 14 DOM
-
2026-06-15days on market $239,500 Active 13 DOM
-
2026-06-13days on market $239,500 Active 11 DOM
-
2026-06-13days on market $239,500 Active 10 DOM
-
2026-06-09days on market $239,500 Active 7 DOM
-
2026-06-08days on market $239,500 Active 6 DOM
-
2026-06-07days on market $239,500 Active 5 DOM
-
2026-06-04days on market $239,500 Active 2 DOM
-
2026-06-03$239,500 Active 1 DOM
ⓘ Source: listings_history table (triggers on properties + properties_extension) + one-shot
backfill from property_details.listing_events for pre-trigger history.
Tax reassessment forecast MI · Partial reset (capped growth)
- Current annual tax
- $3,264 · $272/mo
- Projected year-2 tax
- $3,476 · $290/mo
- Expected delta
- +$212/yr (+$18/mo · 6.5%)
ⓘ Screening estimate from a state-policy table — verify with the county assessor before closing.
Climate risk First Street
- Flood 1/10 Low FEMA zone X (unshaded) · 0% chance over 30 yrs
- Wildfire 1/10 Low
- Heat 3/10 Moderate 7 d/yr ≥95°F today · 15 d/yr by 30 yrs out
- Wind 2/10 Low
- Air quality 4/10 Moderate 6 unhealthy d/yr today · 8 by 30 yrs out
Nearby sold comps map
Loading sold comps map…
Walkable amenities ~0.75 mi
Loading nearby amenities…
Taxation est. · year 1
- Rental income
- $29,376
- − Mortgage interest
- −$13,416
- − Property taxes
- −$3,264
- − Insurance
- −$1,198
- − Repairs & maintenance
- −$2,350
- − Management
- −$2,350
- − Depreciation
- −$6,967
- Taxable loss
- −$169
- Est. tax savings @ 24.0%
- +$41
- After-tax cash flow
- $3,714/yr
For passive investors: Depreciation is non-cash, so a rental often shows a tax loss while cash-flowing — sheltering income. Rental losses are passive: they offset passive income freely, and up to $25,000/yr can offset ordinary (W-2) income if you actively participate and your MAGI is under $100k (phasing out to $0 by $150k); unused losses carry forward. On sale, claimed depreciation is recaptured at up to 25%, and gains may owe capital-gains tax (a 1031 exchange can defer both). Figures are a year-1 estimate at your 24.0% rate — not tax advice; consult a CPA.
Schools (NCES district)
- District
- Detroit Public Schools Community District
- NCES district ID
- 2601103
- Math proficiency
- 10% ▼ -2.00%
- Reading proficiency
- 24% ▲ 6.00%
- Median HH income
- $25,815
- Composite
- 13.06/100
- National rank
- #9564
- State rank
- #499 of 540 in MI
Livability — Detroit
- Score
- 73/100
- State rank
- #218
- US rank
- #5427
Category grades
Schools grade is shown separately in the Schools card above.
Census & demographics
- Census place
- Detroit, MI
- County
- Wayne County · 1,562,939 people
- City population
- 572,865
- Metro
- Detroit-Warren-Dearborn, MI
- Population (ZIP)
- 27,184
- Household income
- $43,161
- Rent vs Own
- Severe rent burden
- 831.0
Population outlook (Wayne County) Hauer SSP2
- Today (2025)
- 1,675,273 people
- By 2030
- 1,620,300 · -3.3%
- By 2040
- 1,502,341 · -10.3%
- By 2050
- 1,384,039 · -17.4%
- By 2075
- 1,124,592 · -32.9%
- By 2100
- 881,193 · -47.4%
Race, ethnicity, and origin ACS 2023
- Neighborhood character
- Predominantly Hispanic (76%)
- Race & ethnicity
- Hispanic / Latino 76% White 17% Two or more races 14% Black 6% Native American 2%
- Hispanic origin (detail)
- Mexican 58% Puerto Rican 7% Cuban 1%
- Common ancestry
- Romanian 2% Lithuanian 0%
- Foreign-born
- 26% · Canada
- Languages at home
- 38% English-only · Spanish 62%
Political lean MEDSL · Wayne
- 2024 margin
- Strong D (+29.0) · D 62.7% · R 33.7% · Other 3.6%
- 2008→2024 swing
- -20.5pp toward R · 2008: 49.5pp · 2024: 29.0pp
- All cycles
- 2024: D+29.0 2020: D+38.1 2016: D+37.3 2012: D+46.9 2008: D+49.5
Not yet ingested
- Civics
- —
Market trends
- HPI YoY
- ▲ 73.77%
- Current HPI
- 412.9753
- Rent YoY
- —
- Metro
- Detroit-Warren-Dearborn, MI
- State GDP YoY
- ▲ 1.37%
- F500 in state
- 28
Industry mix (Fortune 500 HQ in MI)
| Industry | F500 HQs | Revenue |
|---|---|---|
| Automotive Parts | 3 | $48B |
|
||
| Automotive | 2 | $372B |
|
||
| Chemicals | 1 | $45B |
|
||
| Automotive Retail | 1 | $29B |
|
||
| Healthcare / Medical Devices | 1 | $23B |
|
||
| Automotive Technology | 1 | $20B |
|
||
Price history
+701.0% since first listed12 events — show timeline
- 2026-06-02 Listed $239,500 MiRealSource-MiMLS
- 2026-06-02 Listed $239,500 REALCOMP
- 2017-01-11 Listing Removed — MiRealSource-MiMLS
- 2017-01-06 Sold (MLS) $40,000 MiRealSource-MiMLS
- 2017-01-06 Sold (MLS) $40,000 REALCOMP
- 2016-11-30 Pending — MiRealSource-MiMLS
- 2016-11-30 Pending — REALCOMP
- 2016-11-23 Price Changed $51,900 MiRealSource-MiMLS
- 2016-11-22 Price Changed $51,900 REALCOMP
- 2016-08-01 Listed $55,000 MiRealSource-MiMLS
- 2016-07-30 Listed $55,000 REALCOMP
- 1992-02-21 Sold (Public Records) $29,900 Public Records
Property tax history
+4.4%/yrLatest (2025): $3,264 · +4.3% YoY. Source: county tax records.
Cash-flow waterfall
monthlySold comps — $/sqft
last 12 mo · ≤1 miLoading sold comps…