1111 N 2000 W #84 · Farr West, UT
Flood risk 1/10 · Minimal
- FEMA flood zone
- X (unshaded)
- Chance of flooding over 30 yrs
- 0.0%
- Est. flood insurance / yr
- $507 – $1,088
Fire risk 3/10 · Minor
- Est. fire insurance / yr
- $453 – $841
Heat risk 4/10 · Minor
- Hot days now (above 95°F)
- 7 days/yr
- Hot days in 30 yrs
- 18 days/yr
Wind risk 1/10 · Minimal
- Chance of severe wind over 30 yrs
- —
Air-quality risk 3/10 · Minor
- Unhealthy air days now
- 2 days/yr
- Unhealthy air days in 30 yrs
- 3 days/yr
Risk factors via First Street. Map © Google.
Why this score? — see what drove the D+ grade
The composite is a weighted blend of 9 inputs, each scored 0–100. Each bar is that input's sub-score; the figure is the points it added to the 100-point composite (weight × sub-score).
- Cash flow +14.4/30.0
- 1% rule +10.0/10.0
- ARV discount +7.5/15.0
- DSCR +4.4/10.0
- Livability +3.7/5.0
- Schools +3.2/10.0
- Rent growth +3.1/5.0
- Condition / age +2.5/5.0
- Appreciation +0.0/10.0
$92,000
🖨 Deal sheet 📄 Offer letter ✓ Due diligence
Listing remarks
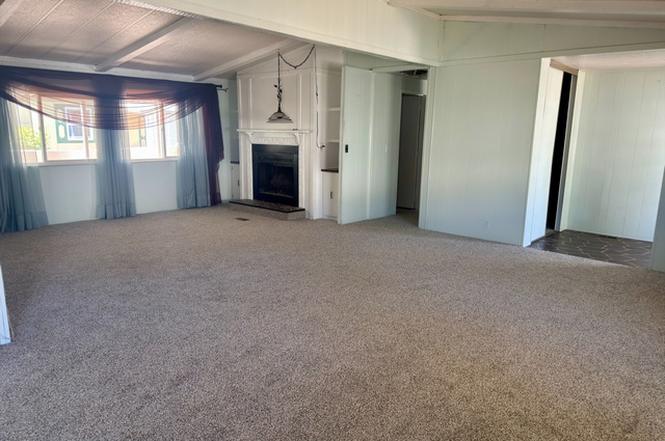
Welcome home to this spacious and inviting 1,799 sq. ft. modular home located in a desirable 55+ community featuring a community pool for residents to enjoy. Offering 3 bedrooms and 2 full bathrooms, this well-maintained home provides comfortable living with a functional floor plan and generous living spaces. Brand-new carpet throughout creates a fresh and welcoming atmosphere, while the cozy fireplace adds warmth and charm to the main living area. Step outside to the covered deck, perfect for relaxing, entertaining, or enjoying peaceful mornings and evenings. With its thoughtful updates, community amenities, and move-in-ready condition, this home is a wonderful opportunity to enjoy low-mai
Key facts
- 5 parking spots
- Community pool
- Built 1982
Property features AI
Finance
- HOA & community: Homeowners association with monthly fee; Association amenities include clubhouse, fitness center, pool, sauna, spa/hot tub, RV parking, picnic area, management, snow removal; sewer and water included in fee; pet rules allow pets; Senior community; Subdivision: WESTWOOD VILLAGE
Exterior
- Parking: Total parking for 5 vehicles; Two covered/carport spaces; Two covered parking spaces; Three open parking spaces; RV parking and common RV parking
- Utilities: Natural gas connected; Electricity connected; Water connected (culinary and secondary); Sewer connected
- Home design: Modular construction; Single-level living; Fully accessible; Faces west; Residential property
- Construction: Asphalt roof; Built/standing condition
- Exterior features: Covered patio; Covered patio/porch; Double pane windows; Exterior lighting; Storm doors; Spa/Hot Tub
Interior
- Kitchen: Wall oven; Countertop range; Disposal
- Bedrooms: Three main-level bedrooms; Primary bedroom on the first floor
- Flooring: Carpet; Tile
- Bathrooms: One full bathroom; One three-quarter bathroom
- Heating & cooling: Forced air heating (gas central); Central air conditioning
- Interior features: Separate tub and shower in bath; Disposal; Wall oven; Countertop range; Vaulted ceilings; Blinds and drapes
- Laundry & utility: No basement
Neighborhood map
What this means for you Summary
Snapshot
- This is a 3-bed/2.0-bath manufactured listed at $92k.
Deal economics
- At list price, monthly cash flow is $19 ($227/yr) — positive.
- The deal already cash-flows at list — no discount required.
- Meets the 1% rule at list price ($2k rent vs $92k).
- Recommended offer: $81k (12.0% below list) — sets the bar for market timing.
Location & tenants
- Location reads 74/100 on livability (#67 in UT, #4,515 nationally) — a middle-class / working-renter tenant base. Strengths: crime A+, commute A+, employment A+; Watch: amenities F, health & safety F.
- Weber District (suburban): math 36% / reading 35% proficiency, ranked #56 of 80 in UT (top 70%) — families likely to look elsewhere, expect single-tenant / working-renter base with shorter leases.
- Zoned schools: Farr West School (math 48% / reading 41%, grade F, #240 of 585 statewide, top 43%, 788 students, 13% FRL); Wahlquist Jr High (math 41% / reading 31%, grade F, #93 of 138 statewide, top 67%, 1,260 students, 12% FRL); Fremont High (math 28% / reading 48%, grade F, #75 of 171 statewide, top 44%, 2,160 students, 10% FRL).
- Market conditions: Rents rising (+2.3%/yr); 611 active listings in the ZIP; solid renter incomes; 1,630 units permitted in Weber County in 2024 (521 in 5+ unit buildings).
Forward outlook
- Local home prices are declining (-3.0%/yr); year-one equity from $636 of loan paydown is wiped out by about $3k of value loss. Plan a longer hold.
- Weber County population projected at +24% by 2050 — long-run rental-demand tailwind backs the buy-and-hold thesis.
Negotiation context
- It's been on market 198 days — a 12% lower offer ($81k) is reasonable based on typical stale-listing flexibility.
- 2 sale attempts; this cycle's ask is 8% above the opening price — seller raised mid-cycle; expect resistance to lowballs.
Risks & watch-outs
- Watch-outs: HOA is 44% of rent.
Questions for the listing agent
- It's been on market 198 days. Have you received any prior offers? Is the seller open to a 12% concession, seller financing, or rate buy-down credit?
- What does the HOA fee cover, when was the last increase, and are there any pending special assessments or reserve-fund shortfalls?
- Why hasn't it sold? Are there any deal-killer items the seller is aware of (foundation, flood, title, zoning, code violations)?
- Is there a deadline driving the sale (1031 exchange, divorce, estate, relocation)? That informs how much negotiation room exists.
- The area grade is low — what's the realistic commute time and amenity access for the typical tenant pool here? Any planned neighborhood developments (good or bad) we should know about?
- What's the average days-on-market for RENTAL listings here right now (not sales)? A rising rental-DOM trend means longer vacancies and softer asking-rent achievability than the comps imply.
- What's the recent tenant-quality profile in this submarket — average credit score on applications, eviction rate, late-payment / NSF rate, and stable-employment percentage? A property-management company in the area should have these aggregated.
- How much new for-sale + rental construction is in the pipeline within 1–3 miles? Heavy new supply typically softens prices + rents 12–24 months out; constrained supply supports both.
Investment metrics
- 1% rule
- 2.05% ✓
- Cap rate
- 6.54%
- Cash-on-cash
- 0.88%
- DSCR
- 1.04
- GRM
- 4.1
CMA / ARV
No comps found within radius.
Projected returns pro-forma
-3.0% appreciation · 2.33% rent growth · sell at horizon
- IRR
- -15.9%
- Equity multiple
- 0.44×
- Total profit
- $-14,425
- Equity at exit
- $13,717
- IRR
- -9.1%
- Equity multiple
- 0.46×
- Total profit
- $-13,925
- Equity at exit
- $7,954
Cash invested: $25,760 (down + closing). Projections, not guarantees.
Landlord ↔ Tenant lean methodology
- Overall (STATE)
- 86 Strongly Landlord-Friendly
- State Utah
- 86 Strongly Landlord-Friendly · R+15
- County
- — inherits STATE
- City
- — inherits STATE
ZIP-level market 84404
- Rents YoY
- 2.3%
- Active inventory
- 611
- Price-to-rent
- 4.1×
Monthly cashflow live
- Estimated rent
- $1,890 medium interval (Pro) →
- Mortgage (P&I)
- −$482
- Tax est. 1.5%
- −$115 /mo · $1,380/yr
- Insurance
- −$38
- HOA
- −$838
- Vacancy / Maint / Mgmt
- −$397
- Net cashflow
- $19
Break-even live
UW: 25.0% down · 7.5% · 30yr · 1.5% tax · 5.0% vac · 8.0% maint · 8.0% mgmt
Financing live
Cash to close
- Down payment
- $23,000
- Closing costs
- $2,760
- Reserves months
- —
- Total cash needed
- —
Loan-product check · same deal, 3 products live
Conventional
25% down · 7.5% · 30yr
- Down + closing
- —
- Monthly P&I
- —
- Monthly cashflow
- —
- DSCR
- —
- Eligible?
- —
Personal DTI + credit; lowest rate.
DSCR
20% down · 8.5% · 30yr
- Down + closing
- —
- Monthly P&I
- —
- Monthly cashflow
- —
- DSCR
- —
- Eligible?
- —
No personal income docs; deal must DSCR.
Hard money
10% down · 12.0% · 12mo
- Down + closing
- —
- Monthly P&I
- —
- Monthly cashflow
- —
- DSCR
- —
- Eligible?
- —
Short-term bridge; refi at stabilization.
HOA detail
- Monthly dues
- $838 · $10,056/yr
- Likely covers
- pool
Listing history 25 events
-
2026-06-18remarks 699-char remark
-
2026-06-18days on market $92,000 Active 198 DOM
-
2026-06-17days on market $92,000 Active 197 DOM
-
2026-06-16days on market $92,000 Active 196 DOM
-
2026-06-15days on market $92,000 Active 195 DOM
-
2026-06-14remarks 489-char remark
-
2026-06-14days on market $92,000 Active 193 DOM
-
2026-06-10days on market $92,000 Active 190 DOM
-
2026-06-09days on market $92,000 Active 189 DOM
-
2026-06-08days on market $92,000 Active 188 DOM
-
2026-06-07days on market $92,000 Active 187 DOM
-
2026-06-05days on market $92,000 Active 184 DOM
-
2026-06-03days on market $92,000 Active 183 DOM
-
2026-06-02days on market $92,000 Active 182 DOM
-
2026-06-01days on market $92,000 Active 181 DOM
-
2026-05-31days on market $92,000 Active 180 DOM
-
2026-05-31days on market $92,000 Active 179 DOM
-
2025-12-02$85,000 Active
-
2025-11-29historical
-
2025-10-28price $97,500
-
2025-08-14price $99,900
-
2025-07-22price $104,900
-
2025-06-27price $109,900
-
2025-06-09price $114,900
-
2025-05-27$119,900 Active
ⓘ Source: listings_history table (triggers on properties + properties_extension) + one-shot
backfill from property_details.listing_events for pre-trigger history.
Climate risk First Street
- Flood 1/10 Low FEMA zone X (unshaded) · 0% chance over 30 yrs
- Wildfire 3/10 Moderate
- Heat 4/10 Moderate 7 d/yr ≥95°F today · 18 d/yr by 30 yrs out
- Wind 1/10 Low
- Air quality 3/10 Moderate 2 unhealthy d/yr today · 3 by 30 yrs out
Nearby sold comps map
Loading sold comps map…
Walkable amenities ~0.75 mi
Loading nearby amenities…
Taxation est. · year 1
- Rental income
- $22,674
- − Mortgage interest
- −$5,153
- − Property taxes
- −$1,380
- − Insurance
- −$460
- − Repairs & maintenance
- −$1,814
- − Management
- −$1,814
- − HOA
- −$10,056
- − Depreciation
- −$2,676
- Taxable loss
- −$680
- Est. tax savings @ 24.0%
- +$163
- After-tax cash flow
- $390/yr
For passive investors: Depreciation is non-cash, so a rental often shows a tax loss while cash-flowing — sheltering income. Rental losses are passive: they offset passive income freely, and up to $25,000/yr can offset ordinary (W-2) income if you actively participate and your MAGI is under $100k (phasing out to $0 by $150k); unused losses carry forward. On sale, claimed depreciation is recaptured at up to 25%, and gains may owe capital-gains tax (a 1031 exchange can defer both). Figures are a year-1 estimate at your 24.0% rate — not tax advice; consult a CPA.
Schools (NCES district)
- District
- Weber District
- NCES district ID
- 4901200
- Math proficiency
- 36% ▼ -4.00%
- Reading proficiency
- 35% ▼ -5.00%
- Median HH income
- $65,750
- Composite
- 32.28/100
- National rank
- #5757
- State rank
- #56 of 80 in UT
Livability — Farr West
- Score
- 74/100
- State rank
- #67
- US rank
- #4515
Category grades
Schools grade is shown separately in the Schools card above.
Census & demographics
- Census place
- Farr West, UT
- County
- Weber County · 260,557 people
- Metro
- Ogden-Clearfield, UT
- Population (ZIP)
- 66,587
- Household income
- $85,057
- Rent vs Own
- Severe rent burden
- 1201.0
Population outlook (Weber County) Hauer SSP2
- Today (2025)
- 274,329 people
- By 2030
- 288,577 · +5.2%
- By 2040
- 314,848 · +14.8%
- By 2050
- 338,710 · +23.5%
- By 2075
- 384,412 · +40.1%
- By 2100
- 409,305 · +49.2%
Race, ethnicity, and origin ACS 2023
- Neighborhood character
- Predominantly White (70%)
- Race & ethnicity
- White 70% Hispanic / Latino 24% Two or more races 7% Asian 1%
- Hispanic origin (detail)
- Mexican 20%
- Common ancestry
- Italian 5% Slovak 4% Iranian 3%
- Foreign-born
- 8% · Canada
- Languages at home
- 83% English-only · Spanish 15% Other Indo-European 1%
Political lean MEDSL · Weber
- 2024 margin
- Strong R (+23.5) · D 36.8% · R 60.3% · Other 2.9%
- 2008→2024 swing
- +4.1pp toward D · 2008: -27.6pp · 2024: -23.5pp
- All cycles
- 2024: R+23.5 2020: R+22.7 2016: R+20.0 2012: R+46.0 2008: R+27.6
Not yet ingested
- Civics
- —
Market trends
- HPI YoY
- ▼ -317.85%
- Current HPI
- 323.2499
- Rent YoY
- ▲ 2.33%
- Metro
- Ogden-Clearfield, UT
- State GDP YoY
- ▲ 3.54%
- F500 in state
- 2
Industry mix (Fortune 500 HQ in UT)
| Industry | F500 HQs | Revenue |
|---|---|---|
| Financial Services | 1 | $3B |
|
||
Price history
-29.1% since first listed8 events — show timeline
- 2025-12-02 Listed $85,000 WFRMLS
- 2025-11-29 Listing Removed — WFRMLS
- 2025-10-28 Price Changed $97,500 WFRMLS
- 2025-08-14 Price Changed $99,900 WFRMLS
- 2025-07-22 Price Changed $104,900 WFRMLS
- 2025-06-27 Price Changed $109,900 WFRMLS
- 2025-06-09 Price Changed $114,900 WFRMLS
- 2025-05-27 Listed $119,900 WFRMLS
Cash-flow waterfall
monthlySold comps — $/sqft
last 12 mo · ≤1 miLoading sold comps…