8284 New Bowling Green Rd · Smiths Grove, KY
Flood risk 1/10 · Minimal
- FEMA flood zone
- X (unshaded)
- Chance of flooding over 30 yrs
- 0.0%
- Est. flood insurance / yr
- $507 – $1,088
Fire risk 2/10 · Minimal
- Est. fire insurance / yr
- $839 – $1,559
Heat risk 5/10 · Moderate
- Hot days now (above 108°F)
- 7 days/yr
- Hot days in 30 yrs
- 19 days/yr
Wind risk 4/10 · Minor
- Chance of severe wind over 30 yrs
- 10.0%
Air-quality risk 2/10 · Minimal
- Unhealthy air days now
- 1 days/yr
- Unhealthy air days in 30 yrs
- 2 days/yr
Risk factors via First Street. Map © Google.
Why this score? — see what drove the B- grade
The composite is a weighted blend of 9 inputs, each scored 0–100. Each bar is that input's sub-score; the figure is the points it added to the 100-point composite (weight × sub-score).
- Cash flow +30.0/30.0
- 1% rule +10.0/10.0
- DSCR +10.0/10.0
- ARV discount +7.5/15.0
- Livability +3.2/5.0
- Schools +3.1/10.0
- Rent growth +2.5/5.0
- Condition / age +1.0/5.0
- Appreciation +0.0/10.0
$60,000
🖨 Deal sheet 📄 Offer letter ✓ Due diligence
Listing remarks MLS
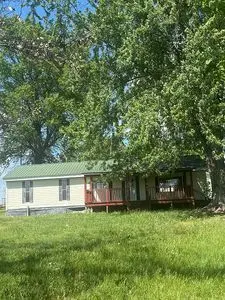
Possible 3rd bedroom,huge great room,54 x 24 doublewide, metal roof 4 years old, to be sold as, needs TLC
Key facts
- Central air and heat
- .75 acre
- Listed 36 days
Tags
Neighborhood map
What this means for you Summary
Snapshot
- This is a 3-bed/1.0-bath single-family listed at $60k. Condition is rated poor.
Deal economics
- At list price, monthly cash flow is $570 ($7k/yr) — positive.
- The deal already cash-flows at list — no discount required.
- Meets the 1% rule at list price ($1k rent vs $60k).
- Recommended offer: $58k (3.0% below list) — sets the bar for market timing.
- Cap rate 17.7% vs local median 3.2% in Smiths Grove — top-decile yield for the area; either an underpriced asset or a hidden risk that comps aren't pricing in. Stress-test before assuming the spread holds.
Location & tenants
- Location reads 65/100 on livability (#256 in KY) — a middle-class / working-renter tenant base. Strengths: cost of living A+, housing A+; Watch: schools C-, employment D, crime F.
- Barren County (rural): math 31% / reading 42% proficiency, ranked #52 of 165 in KY (top 32%) — families likely to look elsewhere, expect single-tenant / working-renter base with shorter leases.
- Market conditions: 75 active listings in the ZIP; 283 units permitted in Barren County in 2024 (64 in 5+ unit buildings).
Forward outlook
- Local home prices are declining (-3.0%/yr); year-one equity from $415 of loan paydown is wiped out by about $2k of value loss. Plan a longer hold.
- Barren County population projected at +13% by 2050 — modest demand growth; plan on rents tracking national, not racing it.
- At projected returns (-3.0% appreciation + 3.0% rent growth), your $17k cash investment doubles in ~3 years — after that, you're playing with house money.
Negotiation context
- It's been on market 37 days — a 3% lower offer ($58k) is reasonable based on typical stale-listing flexibility.
- 2 sale attempts since 16y ago with the ask held roughly flat each time — persistent listings suggest the price (not the market) is what's stuck; bring a comps-based counter.
- Current owner paid $21k; list at $60k implies a 186% gain — meaningful room to come down on a strong offer.
Risks & watch-outs
- Climate carrying-cost: extreme-heat days projected 7→19/yr by 2055 (HVAC capex compounding) — expect insurance premiums to compound above CPI over the hold.
Questions for the listing agent
- It's been on market 37 days. Have you received any prior offers? Is the seller open to a 3% concession, seller financing, or rate buy-down credit?
- Have any recent inspections been done? Can we get a copy of the seller's disclosures and any deferred-maintenance estimates?
- Is there a deadline driving the sale (1031 exchange, divorce, estate, relocation)? That informs how much negotiation room exists.
- Crime grade is F in this area — have there been break-ins, vandalism, or insurance claims at this property in the last 3 years? What carrier currently insures it and at what premium?
- What's the average days-on-market for RENTAL listings here right now (not sales)? A rising rental-DOM trend means longer vacancies and softer asking-rent achievability than the comps imply.
- What's the recent tenant-quality profile in this submarket — average credit score on applications, eviction rate, late-payment / NSF rate, and stable-employment percentage? A property-management company in the area should have these aggregated.
- How much new for-sale + rental construction is in the pipeline within 1–3 miles? Heavy new supply typically softens prices + rents 12–24 months out; constrained supply supports both.
Investment metrics
- 1% rule
- 2.08% ✓
- Cap rate
- 17.70%
- Cash-on-cash
- 40.73%
- DSCR
- 2.81
- GRM
- 4.0
CMA / ARV
No comps found within radius.
Projected returns pro-forma
-3.0% appreciation · 3.0% rent growth · sell at horizon
- IRR
- 37.2%
- Equity multiple
- 2.58×
- Total profit
- $26,617
- Equity at exit
- $8,946
- IRR
- 43.8%
- Equity multiple
- 5.17×
- Total profit
- $70,023
- Equity at exit
- $5,188
Cash invested: $16,800 (down + closing). Projections, not guarantees.
Landlord ↔ Tenant lean methodology
- Overall (STATE)
- 83 Strongly Landlord-Friendly
- State Kentucky
- 83 Strongly Landlord-Friendly · R+16
- County
- — inherits STATE
- City
- — inherits STATE
ZIP-level market 42171
- Home prices YoY
- -12.6%
- Active inventory
- 75
- Price-to-rent
- 4.0×
Monthly cashflow live
- Estimated rent
- $1,247 medium interval (Pro) →
- Mortgage (P&I)
- −$315
- Tax est. 1.5%
- −$75 /mo · $900/yr
- Insurance
- −$25
- HOA
- −$0
- Vacancy / Maint / Mgmt
- −$262
- Net cashflow
- $570
Break-even live
UW: 25.0% down · 7.5% · 30yr · 1.5% tax · 5.0% vac · 8.0% maint · 8.0% mgmt
Financing live
Cash to close
- Down payment
- $15,000
- Closing costs
- $1,800
- Reserves months
- —
- Total cash needed
- —
Loan-product check · same deal, 3 products live
Conventional
25% down · 7.5% · 30yr
- Down + closing
- —
- Monthly P&I
- —
- Monthly cashflow
- —
- DSCR
- —
- Eligible?
- —
Personal DTI + credit; lowest rate.
DSCR
20% down · 8.5% · 30yr
- Down + closing
- —
- Monthly P&I
- —
- Monthly cashflow
- —
- DSCR
- —
- Eligible?
- —
No personal income docs; deal must DSCR.
Hard money
10% down · 12.0% · 12mo
- Down + closing
- —
- Monthly P&I
- —
- Monthly cashflow
- —
- DSCR
- —
- Eligible?
- —
Short-term bridge; refi at stabilization.
Listing history 18 events
-
2026-06-18days on market $60,000 Active 37 DOM
-
2026-06-17days on market $60,000 Active 36 DOM
-
2026-06-16days on market $60,000 Active 35 DOM
-
2026-06-15days on market $60,000 Active 34 DOM
-
2026-06-13days on market $60,000 Active 32 DOM
-
2026-06-12days on market $60,000 Active 31 DOM
-
2026-06-09days on market $60,000 Active 28 DOM
-
2026-06-08days on market $60,000 Active 27 DOM
-
2026-06-07days on market $60,000 Active 26 DOM
-
2026-06-07days on market $60,000 Active 25 DOM
-
2026-06-04days on market $60,000 Active 22 DOM
-
2026-06-02days on market $60,000 Active 21 DOM
-
2026-06-01days on market $60,000 Active 20 DOM
-
2026-05-31days on market $60,000 Active 19 DOM
-
2026-05-31days on market $60,000 Active 18 DOM
-
2026-05-12$60,000 Active
-
2011-11-29soldstatus $21,000 105-char remark
Show marketing remark (105 chars)
Possible 3rd bedroom,huge great room,54 x 24 doublewide, metal roof 4 years old, to be sold as, needs TLC
-
2010-07-02$32,900 105-char remark
Show marketing remark (105 chars)
Possible 3rd bedroom,huge great room,54 x 24 doublewide, metal roof 4 years old, to be sold as, needs TLC
ⓘ Source: listings_history table (triggers on properties + properties_extension) + one-shot
backfill from property_details.listing_events for pre-trigger history.
Climate risk First Street
- Flood 1/10 Low FEMA zone X (unshaded) · 0% chance over 30 yrs
- Wildfire 2/10 Low
- Heat 5/10 Major 7 d/yr ≥108°F today · 19 d/yr by 30 yrs out
- Wind 4/10 Moderate 10% chance of damaging wind over 30 yrs
- Air quality 2/10 Low 1 unhealthy d/yr today · 2 by 30 yrs out
Nearby sold comps map
Loading sold comps map…
Walkable amenities ~0.75 mi
Loading nearby amenities…
Taxation est. · year 1
- Rental income
- $14,961
- − Mortgage interest
- −$3,361
- − Property taxes
- −$900
- − Insurance
- −$300
- − Repairs & maintenance
- −$1,197
- − Management
- −$1,197
- − Depreciation
- −$1,745
- Taxable income
- $6,261
- Est. tax owed @ 24.0%
- −$1,503
- After-tax cash flow
- $5,341/yr
For passive investors: Depreciation is non-cash, so a rental often shows a tax loss while cash-flowing — sheltering income. Rental losses are passive: they offset passive income freely, and up to $25,000/yr can offset ordinary (W-2) income if you actively participate and your MAGI is under $100k (phasing out to $0 by $150k); unused losses carry forward. On sale, claimed depreciation is recaptured at up to 25%, and gains may owe capital-gains tax (a 1031 exchange can defer both). Figures are a year-1 estimate at your 24.0% rate — not tax advice; consult a CPA.
Condition & rehab AI · 1 photo
This mobile home requires extensive repairs and maintenance, including new siding and roof, to become move-in ready.
Repairs flagged
- Major exterior siding — Significant wear and tear
- Major roof — No visible roof condition
Value-add opportunities
- Both new exterior siding — Enhances curb appeal and structural integrity
- Both new roof — Improves home's value and extends lifespan
Renovation cost estimate screening
| Repair item | Severity | Est. cost |
|---|---|---|
| exterior siding · Significant wear and tear | Major | $15,000–50,000 |
| roof · No visible roof condition | Major | $15,000–50,000 |
| Total estimated repair cost · 2 items | $30,000–100,000 |
Value-add ROI direction
- Both new exterior siding — Enhances curb appeal and structural integrity ↑
- Both new roof — Improves home's value and extends lifespan ↑
ⓘ Cost ranges are severity-bucket heuristics (US national rule-of-thumb). Get contractor quotes + a written scope before underwriting a rehab budget.
Schools (NCES district)
- District
- Barren County
- NCES district ID
- 2100300
- Math proficiency
- 31% ▼ -18.00%
- Reading proficiency
- 42% ▼ -18.00%
- Median HH income
- $45,000
- Composite
- 31.08/100
- National rank
- #6077
- State rank
- #52 of 165 in KY
Livability — Smiths Grove
- Score
- 65/100
- State rank
- #256
- US rank
- #12802
Category grades
Schools grade is shown separately in the Schools card above.
Census & demographics
- Population (ZIP)
- 7,189
Population outlook (Barren County) Hauer SSP2
- Today (2025)
- 46,858 people
- By 2030
- 48,311 · +3.1%
- By 2040
- 50,931 · +8.7%
- By 2050
- 52,820 · +12.7%
- By 2075
- 56,499 · +20.6%
- By 2100
- 55,831 · +19.1%
Race, ethnicity, and origin ACS 2023
- Neighborhood character
- Predominantly White (93%)
- Race & ethnicity
- White 93% Two or more races 4% Black 2%
- Common ancestry
- Lithuanian 2% Polish 2% Portuguese 1%
- Foreign-born
- 0%
- Languages at home
- 97% English-only · German/W. Germanic 2% Spanish 1%
Political lean MEDSL · Barren
- 2024 margin
- Solid R (+52.8) · D 23.1% · R 75.9% · Other 1.1%
- 2008→2024 swing
- -18.9pp toward R · 2008: -33.9pp · 2024: -52.8pp
- All cycles
- 2024: R+52.8 2020: R+47.5 2016: R+49.9 2012: R+33.3 2008: R+33.9
Not yet ingested
- Civics
- —
Market trends
- HPI YoY
- ▼ -44.24%
- Current HPI
- 307.0886
- Rent YoY
- —
- Metro
- —
- State GDP YoY
- ▲ 1.81%
- F500 in state
- 4
Industry mix (Fortune 500 HQ in KY)
| Industry | F500 HQs | Revenue |
|---|---|---|
| Healthcare | 1 | $118B |
|
||
| Food / Beverage | 1 | $7B |
|
||
Price history
+82.4% since first listed3 events — show timeline
- 2026-05-12 Listed $60,000 FSBO.com
- 2011-11-29 Sold (MLS) $21,000 Metro Search MLS
- 2010-07-02 Listed $32,900 Metro Search MLS
Cash-flow waterfall
monthlySold comps — $/sqft
last 12 mo · ≤1 miLoading sold comps…