871 Shumard Way · Lady Lake, FL
Flood risk 4/10 · Minor
- FEMA flood zone
- X (unshaded)
- Chance of flooding over 30 yrs
- 0.2%
- Est. flood insurance / yr
- $507 – $1,088
Fire risk 5/10 · Moderate
- Est. fire insurance / yr
- $947 – $1,759
Heat risk 9/10 · Severe
- Hot days now (above 108°F)
- 7 days/yr
- Hot days in 30 yrs
- 23 days/yr
Wind risk 9/10 · Severe
- Chance of severe wind over 30 yrs
- 99.0%
Air-quality risk 3/10 · Minor
- Unhealthy air days now
- 2 days/yr
- Unhealthy air days in 30 yrs
- 4 days/yr
Risk factors via First Street. Map © Google.
Why this score? — see what drove the C grade
The composite is a weighted blend of 9 inputs, each scored 0–100. Each bar is that input's sub-score; the figure is the points it added to the 100-point composite (weight × sub-score).
- Cash flow +17.6/30.0
- ARV discount +15.0/15.0
- DSCR +5.5/10.0
- 1% rule +5.3/10.0
- Schools +4.2/10.0
- Rent growth +3.5/5.0
- Livability +3.5/5.0
- Condition / age +2.5/5.0
- Appreciation +0.0/10.0
$297,990
🖨 Deal sheet 📄 Offer letter ✓ Due diligence
Listing remarks
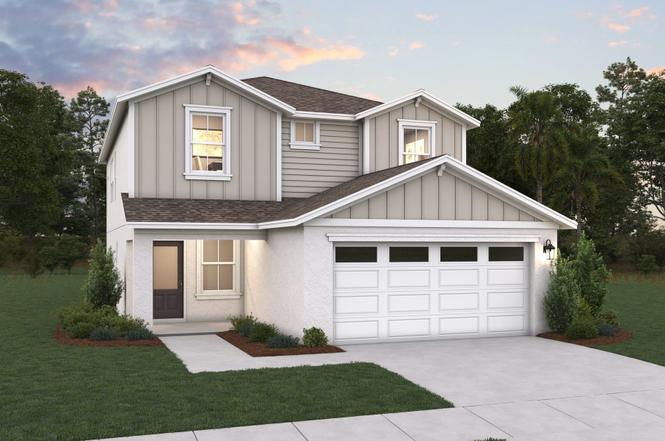
One or more photo(s) has been virtually staged. SAMPLE IMAGE The Magellan floorplan is a versatile two-story home offering 3 bedrooms and two and a half bathrooms with ample space, spanning 2281 sq. ft. Ideal for families or those who love hosting, this layout combines functionality with modern design. The main floor opens up to a spacious great room, dining area, and covered patio, perfect for entertaining or relaxing evenings at home. Upstairs, the owner's suite boasts a spacious walk-in closet and a well-appointed bathroom, ensuring your comfort. The Magellan is thoughtfully designed for comfort and style, making it a perfect home base.
Key facts
- 5,320 sq ft lot
- 2 garage spots
- Community pool
Property features AI
Finance
- Other: Home warranty included
- Financial info: Other annual assessment reported ($1,450); Lease restrictions apply
- HOA & community: HOA required (Rizzetta And Company/Kenneth Zilke); Monthly HOA approximately $134.67; Quarterly association fee (reported $404); Association amenities include clubhouse, pool, playground, tennis courts, and fence restrictions; Community features include clubhouse, community mailbox, dog park, sidewalks, and deed restrictions; Pets allowed
Exterior
- Parking: Attached 2-car garage (19 x 20); Driveway
- Security: Smoke detectors
- Utilities: Public water; Public sewer; Electricity available; Cable available; Underground utilities; Irrigation equipment
- Home design: Single family residence; New construction; Two levels; West-facing
- Construction: Block and frame construction; Shingle roof; Slab foundation; Built by Dream Finders Homes (Model: Magellan)
- Exterior features: Covered front and rear porches; Sidewalk; Sliding doors; Cleared, level lot; Paved, asphalt road
Interior
- Kitchen: Dishwasher; Disposal; Microwave; Range; Electric water heater
- Bedrooms: 3 bedrooms
- Flooring: Carpet; Ceramic tile; Laminate; Tile
- Bathrooms: 2 full bathrooms; 1 half bathroom
- Heating & cooling: Central heating (electric); Heat recovery unit; Central air conditioning
- Interior features: Living room/dining room combo; Open floorplan; Split bedroom layout; Stone countertops; Thermostat; Walk-in closets
- Laundry & utility: Inside laundry room
Neighborhood map
What this means for you Summary
Snapshot
- This is a 3-bed/2.5-bath single-family listed at $298k.
Deal economics
- At list price, monthly cash flow is $233 ($3k/yr) — positive.
- The deal already cash-flows at list — no discount required.
- Meets the 1% rule at list price ($3k rent vs $298k).
- Recommended offer: $262k (12.0% below list) — sets the bar for market timing.
- Cap rate 7.2% vs local median 4.1% in Lady Lake — top-decile yield for the area; either an underpriced asset or a hidden risk that comps aren't pricing in. Stress-test before assuming the spread holds.
Location & tenants
- Location reads 69/100 on livability (#457 in FL) — a middle-class / working-renter tenant base. Strengths: cost of living A+, housing A+, health & safety A-; Watch: employment D, amenities F, commute F.
- Lake (suburban): math 49% / reading 50% proficiency, ranked #37 of 73 in FL (top 51%) — families likely to look elsewhere, expect single-tenant / working-renter base with shorter leases.
- Zoned schools: The Villages Elementary of Lady Lake School (math 63% / reading 61%, grade B, #608 of 2,144 statewide, top 29%, 761 students, 61% FRL); Leesburg High School (math 24% / reading 32%, grade F, #464 of 667 statewide, top 70%, 1,641 students, 58% FRL).
- Market conditions: Rents rising fast (+4.0%/yr); 576 active listings in the ZIP; 2 comparable units currently listed for rent nearby; 4,799 units permitted in Lake County in 2024 (814 in 5+ unit buildings).
- At $3,071/mo this rent would consume 63% of the median local household income ($59k/yr) (locally 1047% of renters already pay >50% of income on rent) — very limited rent-growth headroom before tenants either downsize or default.
Forward outlook
- Local home prices are declining (-3.0%/yr); year-one equity from $2k of loan paydown is wiped out by about $9k of value loss. Plan a longer hold.
- Lake County population projected at +37% by 2050 — long-run rental-demand tailwind backs the buy-and-hold thesis.
Negotiation context
- It's been on market 152 days — a 12% lower offer ($262k) is reasonable based on typical stale-listing flexibility.
- 3 sale attempts; this cycle's ask has dropped $32k (10%) from the opening price — seller is motivated, your offer sets the floor, not the list.
Risks & watch-outs
- Climate carrying-cost: severe wind risk, 99% chance of damaging wind over 30y; moderate wildfire risk; extreme-heat days projected 7→23/yr by 2055 (HVAC capex compounding) — expect insurance premiums to compound above CPI over the hold.
Questions for the listing agent
- It's been on market 152 days. Have you received any prior offers? Is the seller open to a 12% concession, seller financing, or rate buy-down credit?
- What does the HOA fee cover, when was the last increase, and are there any pending special assessments or reserve-fund shortfalls?
- Why hasn't it sold? Are there any deal-killer items the seller is aware of (foundation, flood, title, zoning, code violations)?
- Is there a deadline driving the sale (1031 exchange, divorce, estate, relocation)? That informs how much negotiation room exists.
- Schools are B-rated — typically a magnet for longer-tenancy family renters. What's the average tenant stay here, and is there a school-zone premium baked into asking?
- What's the average days-on-market for RENTAL listings here right now (not sales)? A rising rental-DOM trend means longer vacancies and softer asking-rent achievability than the comps imply.
- What's the recent tenant-quality profile in this submarket — average credit score on applications, eviction rate, late-payment / NSF rate, and stable-employment percentage? A property-management company in the area should have these aggregated.
- How much new for-sale + rental construction is in the pipeline within 1–3 miles? Heavy new supply typically softens prices + rents 12–24 months out; constrained supply supports both.
Investment metrics
- 1% rule
- 1.03% ✓
- Cap rate
- 7.23%
- Cash-on-cash
- 3.34%
- DSCR
- 1.15
- GRM
- 8.1
CMA / ARV
- ARV (on-the-fly)
- $369,522
- Comps found
- 7
Show comp detail 7 sales within ~0.75 mi
| Address | Dist | Beds/Ba | Sqft | Sold | Price | $/sf | Match |
|---|---|---|---|---|---|---|---|
| 858 Sunshower Dr | 0.17mi | 3/2.5 | 2,281 (0%) | 4mo | $299,990 | $132 | 89 |
| 998 Swamp Chestnut Loop | 0.03mi | 4/3.0 (+1) | 2,110 (-8%) | 2mo | $322,990 | $153 | 78 |
| 862 Sunshower Dr | 0.17mi | 4/3.0 (+1) | 2,417 (+6%) | 0mo | $312,990 | $129 | 75 |
| 708 Sunshower Dr | 0.31mi | 4/2.0 (+1) | 2,110 (-8%) | 9mo | $416,143 | $197 | 59 |
| 716 Sunshower Dr | 0.45mi | 4/3.0 (+1) | 2,417 (+6%) | 9mo | $399,000 | $165 | 54 |
| 744 Sunshower Dr | 0.32mi | 4/2.5 (+1) | 1,938 (-15%) | 1mo | $312,990 | $162 | 54 |
| 38049 Rolling Acres Rd | 0.56mi | 2/2.0 (-1) | 2,070 (-9%) | 13mo | $400,000 | $193 | 40 |
Match score weights: distance 35% · size 25% · config 20% · recency 20%. Top-matched comps best support the ARV.
Projected returns pro-forma
-3.0% appreciation · 4.03% rent growth · sell at horizon
- IRR
- -9.8%
- Equity multiple
- 0.64×
- Total profit
- $-30,133
- Equity at exit
- $44,431
- IRR
- 1.1%
- Equity multiple
- 1.08×
- Total profit
- $6,827
- Equity at exit
- $25,765
Cash invested: $83,437 (down + closing). Projections, not guarantees.
Landlord ↔ Tenant lean methodology
- Overall (STATE)
- 87 Strongly Landlord-Friendly
- State Florida
- 87 Strongly Landlord-Friendly · R+3
- County
- — inherits STATE
- City
- — inherits STATE
ZIP-level market 32159
- Home prices YoY
- -16.0%
- Rents YoY
- 4.0%
- Active inventory
- 576
- Price-to-rent
- 8.1×
Monthly cashflow live
- Estimated rent
- $3,071 medium interval (Pro) →
- Mortgage (P&I)
- −$1,563
- Tax est. 1.5%
- −$372 /mo · $4,470/yr
- Insurance
- −$124
- HOA
- −$134
- Vacancy / Maint / Mgmt
- −$645
- Net cashflow
- $233
Break-even live
UW: 25.0% down · 7.5% · 30yr · 1.5% tax · 5.0% vac · 8.0% maint · 8.0% mgmt
Financing live
Cash to close
- Down payment
- $74,498
- Closing costs
- $8,940
- Reserves months
- —
- Total cash needed
- —
Loan-product check · same deal, 3 products live
Conventional
25% down · 7.5% · 30yr
- Down + closing
- —
- Monthly P&I
- —
- Monthly cashflow
- —
- DSCR
- —
- Eligible?
- —
Personal DTI + credit; lowest rate.
DSCR
20% down · 8.5% · 30yr
- Down + closing
- —
- Monthly P&I
- —
- Monthly cashflow
- —
- DSCR
- —
- Eligible?
- —
No personal income docs; deal must DSCR.
Hard money
10% down · 12.0% · 12mo
- Down + closing
- —
- Monthly P&I
- —
- Monthly cashflow
- —
- DSCR
- —
- Eligible?
- —
Short-term bridge; refi at stabilization.
Rent comps 2 comps
| Address | Beds | Baths | Sqft | Rent | $/sqft | DOM | Units | Dist |
|---|---|---|---|---|---|---|---|---|
| 1252 Vanderway Ln Lady Lake, FL | 3.0–4.0 | 2.0 | 1698 | $2,050 | $1.21 | 5d | 1 | 1.44mi |
| 2111 Jem Path The Villages, FL | 3.0 | 2.0 | 2000 | $5,800 | $2.90 | 21d | 1 | 1.48mi |
HOA detail
- Monthly dues
- $134 · $1,608/yr
Listing history 22 events
-
2026-06-18days on market $297,990 Active 152 DOM
-
2026-06-17days on market $297,990 Active 151 DOM
-
2026-06-16days on market $297,990 Active 150 DOM
-
2026-06-15days on market $297,990 Active 149 DOM
-
2026-06-13days on market $297,990 Active 147 DOM
-
2026-06-09days on market $297,990 Active 143 DOM
-
2026-06-08days on market $297,990 Active 142 DOM
-
2026-06-07pricedays on market $297,990 Active 141 DOM
-
2026-06-04days on market $302,990 Active 138 DOM
-
2026-06-03days on market $302,990 Active 137 DOM
-
2026-06-02days on market $302,990 Active 136 DOM
-
2026-06-02days on market $302,990 Active 135 DOM
-
2026-05-31days on market $302,990 Active 134 DOM
-
2026-05-07status Active
-
2026-04-24historical
-
2026-03-16price $302,990
-
2026-02-09price $312,990
-
2026-01-06price $309,990
-
2026-01-04$329,989 Active
-
2025-08-22historical
-
2025-08-22price $380,548
-
2025-07-12$408,736 Active
ⓘ Source: listings_history table (triggers on properties + properties_extension) + one-shot
backfill from property_details.listing_events for pre-trigger history.
Climate risk First Street
- Flood 4/10 Moderate FEMA zone X (unshaded) · 20% chance over 30 yrs
- Wildfire 5/10 Major
- Heat 9/10 Extreme 7 d/yr ≥108°F today · 23 d/yr by 30 yrs out
- Wind 9/10 Extreme 99% chance of damaging wind over 30 yrs
- Air quality 3/10 Moderate 2 unhealthy d/yr today · 4 by 30 yrs out
Nearby sold comps map
Loading sold comps map…
Walkable amenities ~0.75 mi
Loading nearby amenities…
Taxation est. · year 1
- Rental income
- $36,849
- − Mortgage interest
- −$16,692
- − Property taxes
- −$4,470
- − Insurance
- −$1,490
- − Repairs & maintenance
- −$2,948
- − Management
- −$2,948
- − HOA
- −$1,608
- − Depreciation
- −$8,669
- Taxable loss
- −$1,976
- Est. tax savings @ 24.0%
- +$474
- After-tax cash flow
- $3,265/yr
For passive investors: Depreciation is non-cash, so a rental often shows a tax loss while cash-flowing — sheltering income. Rental losses are passive: they offset passive income freely, and up to $25,000/yr can offset ordinary (W-2) income if you actively participate and your MAGI is under $100k (phasing out to $0 by $150k); unused losses carry forward. On sale, claimed depreciation is recaptured at up to 25%, and gains may owe capital-gains tax (a 1031 exchange can defer both). Figures are a year-1 estimate at your 24.0% rate — not tax advice; consult a CPA.
Schools (NCES district)
- District
- Lake
- NCES district ID
- 1201050
- Math proficiency
- 49% ▼ -7.00%
- Reading proficiency
- 50% ▼ -4.00%
- Median HH income
- $46,632
- Composite
- 42.05/100
- National rank
- #3327
- State rank
- #37 of 73 in FL
Livability — Lady Lake
- Score
- 69/100
- State rank
- #457
- US rank
- #8302
Category grades
Schools grade is shown separately in the Schools card above.
Census & demographics
- Census place
- Lady Lake, FL
- County
- Lake County · 364,602 people
- City population
- 32,107
- Metro
- Orlando-Kissimmee-Sanford, FL
- Population (ZIP)
- 32,107
- Household income
- $58,518
- Rent vs Own
- Severe rent burden
- 1047.0
Population outlook (Lake County) Hauer SSP2
- Today (2025)
- 386,640 people
- By 2030
- 417,107 · +7.9%
- By 2040
- 476,676 · +23.3%
- By 2050
- 531,296 · +37.4%
- By 2075
- 648,303 · +67.7%
- By 2100
- 698,530 · +80.7%
Race, ethnicity, and origin ACS 2023
- Neighborhood character
- Predominantly White (86%)
- Race & ethnicity
- White 86% Hispanic / Latino 6% Two or more races 5% Black 4% Asian 1%
- Hispanic origin (detail)
- Puerto Rican 3%
- Common ancestry
- Romanian 4% Lithuanian 3% Slovak 3%
- Foreign-born
- 5% · Canada, Jamaica
- Languages at home
- 93% English-only · Spanish 4% German/W. Germanic 1% Other Indo-European 1%
Political lean MEDSL · Lake
- 2024 margin
- Strong R (+24.7) · D 37.3% · R 62.0%
- 2008→2024 swing
- -11.2pp toward R · 2008: -13.5pp · 2024: -24.7pp
- All cycles
- 2024: R+24.7 2020: R+20.0 2016: R+23.1 2012: R+17.1 2008: R+13.5
Not yet ingested
- Civics
- —
Market trends
- HPI YoY
- ▼ -45.24%
- Current HPI
- 237.6208
- Rent YoY
- ▲ 4.03%
- Metro
- Orlando-Kissimmee-Sanford, FL
- State GDP YoY
- ▲ 3.28%
- F500 in state
- 36
Industry mix (Fortune 500 HQ in FL)
| Industry | F500 HQs | Revenue |
|---|---|---|
| Industrial Technology | 2 | $29B |
|
||
| Insurance | 2 | $17B |
|
||
| Retail | 1 | $60B |
|
||
| Technology Distribution | 1 | $58B |
|
||
| Homebuilding | 1 | $35B |
|
||
| Technology Manufacturing | 1 | $35B |
|
||
Price history
-25.9% since first listed9 events — show timeline
- 2026-05-07 Relisted — Stellar MLS as Distributed by MLS Grid
- 2026-04-24 Listing Removed — Stellar MLS as Distributed by MLS Grid
- 2026-03-16 Price Changed $302,990 Stellar MLS as Distributed by MLS Grid
- 2026-02-09 Price Changed $312,990 Stellar MLS as Distributed by MLS Grid
- 2026-01-06 Price Changed $309,990 Stellar MLS as Distributed by MLS Grid
- 2026-01-04 Listed $329,989 Stellar MLS as Distributed by MLS Grid
- 2025-08-22 Listing Removed — Stellar MLS as Distributed by MLS Grid
- 2025-08-22 Price Changed $380,548 Stellar MLS as Distributed by MLS Grid
- 2025-07-12 Listed $408,736 Stellar MLS as Distributed by MLS Grid
Cash-flow waterfall
monthlySold comps — $/sqft
last 12 mo · ≤1 miLoading sold comps…