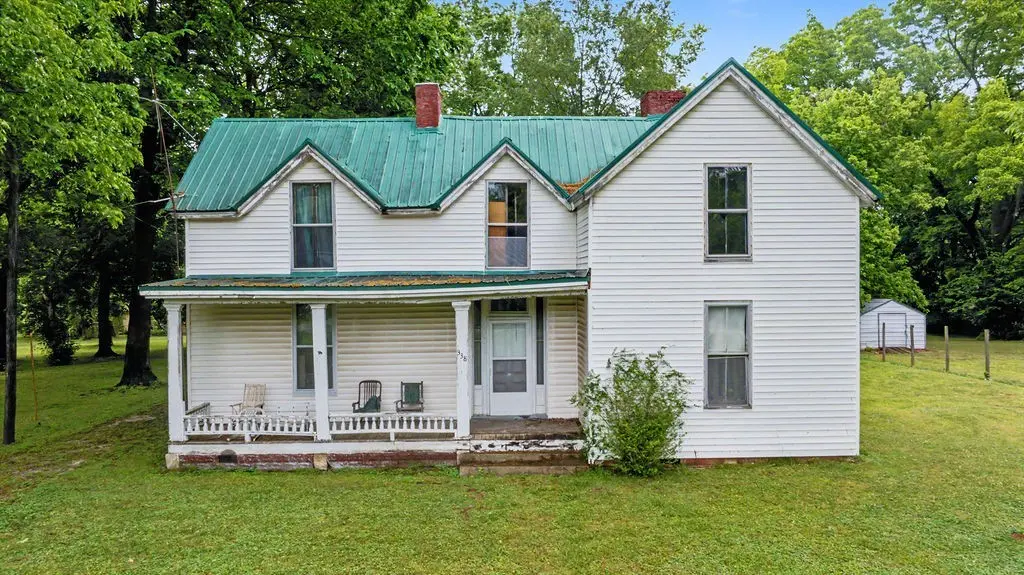
338 W Park St · Guthrie, KY
Flood risk 6/10 · Moderate
- FEMA flood zone
- X (unshaded)
- Chance of flooding over 30 yrs
- 0.74%
- Est. flood insurance / yr
- $507 – $1,088
Fire risk 1/10 · Minimal
- Est. fire insurance / yr
- $839 – $1,559
Heat risk 5/10 · Moderate
- Hot days now (above 107°F)
- 7 days/yr
- Hot days in 30 yrs
- 20 days/yr
Wind risk 4/10 · Minor
- Chance of severe wind over 30 yrs
- 10.0%
Air-quality risk 2/10 · Minimal
- Unhealthy air days now
- 0 days/yr
- Unhealthy air days in 30 yrs
- 1 days/yr
Risk factors via First Street. Map © Google.
Why this score? — see what drove the C+ grade
The composite is a weighted blend of 9 inputs, each scored 0–100. Each bar is that input's sub-score; the figure is the points it added to the 100-point composite (weight × sub-score).
- Cash flow +26.1/30.0
- DSCR +8.8/10.0
- ARV discount +7.5/15.0
- 1% rule +6.9/10.0
- Livability +3.2/5.0
- Schools +2.6/10.0
- Rent growth +2.5/5.0
- Condition / age +2.5/5.0
- Appreciation +0.5/10.0
$125,000
🖨 Deal sheet (PDF) 📄 Offer letter ✓ Due diligence
Listing remarks
🏡 CHARACTER, SPACE & SMALL-TOWN CHARM! 🏡 Welcome to 338 West Park Street in Guthrie, Kentucky! This spacious 4-bedroom, 1-bath home offers approximately 2,432 square feet filled with timeless character and endless potential. ✨ Features You'll Love: ✔️ Beautiful mature trees on a generous 7/10ths acre lot ✔️ Detached garage for storage or workshop space ✔️ Cozy fireplaces full of vintage charm ✔️ A magical staircase that adds character you just can’t find in newer homes ✔️ Large rooms and classic farmhouse feel ✔️ Metal roof and inviting front porch Built in 1950, this property is perfect for someone looking for space, charm, and the opportunity to make a historic home their ow
Key facts
- 0.7 acre lot
- Garage
- Built 1952
Neighborhood map
What this means for you Summary
Snapshot
- This is a 4-bed/1.0-bath single-family listed at $125k.
Deal economics
- At list price, monthly cash flow is $316 ($4k/yr) — positive.
- The deal already cash-flows at list — no discount required.
- Meets the 1% rule at list price ($1k rent vs $125k).
- Recommended offer: $123k (1.5% below list) — sets the bar for market timing.
- Cap rate 9.3% vs local median 1.6% in Guthrie — top-decile yield for the area; either an underpriced asset or a hidden risk that comps aren't pricing in. Stress-test before assuming the spread holds.
Location & tenants
- Location reads 63/100 on livability (#328 in KY) — a middle-class / working-renter tenant base. Strengths: crime A+, cost of living A+, housing A+; Watch: schools C-, amenities F, commute F.
- Todd County (rural): math 23% / reading 39% proficiency, ranked #99 of 165 in KY (top 60%) — families likely to look elsewhere, expect single-tenant / working-renter base with shorter leases.
- Market conditions: 14 active listings in the ZIP; 42 units permitted in Todd County in 2024 (0 in 5+ unit buildings).
Forward outlook
- Local home prices are declining (-3.0%/yr); year-one equity from $864 of loan paydown is wiped out by about $4k of value loss. Plan a longer hold.
- Todd County population projected at -15% by 2050 — secular population decline; favor cash flow + early exit over multi-decade hold.
- At projected returns (-3.0% appreciation + 3.0% rent growth), your $35k cash investment doubles in ~10 years — after that, you're playing with house money.
Negotiation context
- It's been on market 27 days — a 2% lower offer ($123k) is reasonable based on typical stale-listing flexibility.
- Current owner paid $25k; list at $125k implies a 400% gain — meaningful room to come down on a strong offer.
Risks & watch-outs
- Watch-outs: built in 1952 — expect roof / HVAC / electrical / plumbing capex.
- Climate carrying-cost: major flood risk; extreme-heat days projected 7→20/yr by 2055 (HVAC capex compounding) — expect insurance premiums to compound above CPI over the hold.
Questions for the listing agent
- Built in 1952 — when were the roof, HVAC, electrical panel, plumbing, and water heater last replaced?
- Is there a deadline driving the sale (1031 exchange, divorce, estate, relocation)? That informs how much negotiation room exists.
- What's the average days-on-market for RENTAL listings here right now (not sales)? A rising rental-DOM trend means longer vacancies and softer asking-rent achievability than the comps imply.
- What's the recent tenant-quality profile in this submarket — average credit score on applications, eviction rate, late-payment / NSF rate, and stable-employment percentage? A property-management company in the area should have these aggregated.
- How much new for-sale + rental construction is in the pipeline within 1–3 miles? Heavy new supply typically softens prices + rents 12–24 months out; constrained supply supports both.
Investment metrics
- 1% rule
- 1.19% ✓
- Cap rate
- 9.32%
- Cash-on-cash
- 10.83%
- DSCR
- 1.48
- GRM
- 7.0
CMA / ARV
- ARV (on-the-fly)
- $617,728
- Comps found
- 2
Show comp detail 2 sales within ~0.75 mi
| Address | Dist | Beds/Ba | Sqft | Sold | Price | $/sf | Match |
|---|---|---|---|---|---|---|---|
| 389 Third St | 0.58mi | 5/2.0 (+1) | 2,480 (+2%) | 2mo | $125,000 | $50 | 59 |
| 137 Royal View Way | 0.64mi | 3/3.5 (-1) | 2,616 (+8%) | 9mo | $665,655 | $254 | 35 |
Match score weights: distance 35% · size 25% · config 20% · recency 20%. Top-matched comps best support the ARV.
Projected returns pro-forma
-3.0% appreciation · 3.0% rent growth · sell at horizon
- IRR
- -0.1%
- Equity multiple
- 1.00×
- Total profit
- $-117
- Equity at exit
- $18,638
- IRR
- 9.6%
- Equity multiple
- 1.74×
- Total profit
- $25,892
- Equity at exit
- $10,808
Cash invested: $35,000 (down + closing). Projections, not guarantees.
Landlord ↔ Tenant lean methodology
- Overall (STATE)
- 83 Strongly Landlord-Friendly
- State Kentucky
- 83 Strongly Landlord-Friendly · R+16
- County
- — inherits STATE
- City
- — inherits STATE
ZIP-level market 42234
- Home prices YoY
- -2.9%
- Active inventory
- 14
- Price-to-rent
- 7.0×
Monthly cashflow live
- Estimated rent
- $1,493 medium interval (Pro) →
- Mortgage (P&I)
- −$656
- Tax est. 1.5%
- −$156 /mo · $1,875/yr
- Insurance
- −$52
- HOA
- −$0
- Vacancy / Maint / Mgmt
- −$314
- Net cashflow
- $316
Break-even live
Sensitivity live
| Price | -10% $402 | -5% $359 | +0% $316 | +5% $273 | +10% $229 |
|---|---|---|---|---|---|
| Rent | -10% $198 | -5% $257 | +0% $316 | +5% $375 | +10% $434 |
| Rate | -1.0pp $379 | -0.5pp $348 | base $316 | +0.5pp $283 | +1.0pp $250 |
UW: 25.0% down · 7.5% · 30yr · 1.5% tax · 5.0% vac · 8.0% maint · 8.0% mgmt
Financing live
Cash to close
- Down payment
- $31,250
- Closing costs
- $3,750
- Reserves months
- —
- Total cash needed
- —
Loan-product check · same deal, 3 products live
Conventional
25% down · 7.5% · 30yr
- Down + closing
- —
- Monthly P&I
- —
- Monthly cashflow
- —
- DSCR
- —
- Eligible?
- —
Personal DTI + credit; lowest rate.
DSCR
20% down · 8.5% · 30yr
- Down + closing
- —
- Monthly P&I
- —
- Monthly cashflow
- —
- DSCR
- —
- Eligible?
- —
No personal income docs; deal must DSCR.
Hard money
10% down · 12.0% · 12mo
- Down + closing
- —
- Monthly P&I
- —
- Monthly cashflow
- —
- DSCR
- —
- Eligible?
- —
Short-term bridge; refi at stabilization.
Listing history 16 events
-
2026-06-18days on market $125,000 Active 27 DOM
-
2026-06-17days on market $125,000 Active 26 DOM
-
2026-06-16days on market $125,000 Active 25 DOM
-
2026-06-15days on market $125,000 Active 24 DOM
-
2026-06-14days on market $125,000 Active 22 DOM
-
2026-06-13days on market $125,000 Active 21 DOM
-
2026-06-10days on market $125,000 Active 19 DOM
-
2026-06-09days on market $125,000 Active 18 DOM
-
2026-06-08days on market $125,000 Active 17 DOM
-
2026-06-07days on market $125,000 Active 16 DOM
-
2026-06-02days on market $125,000 Active 11 DOM
-
2026-06-01days on market $125,000 Active 10 DOM
-
2026-05-31days on market $125,000 Active 9 DOM
-
2026-05-30days on market $125,000 Active 8 DOM
-
2026-05-22$125,000 Active
-
1998-11-01soldstatus $25,000
ⓘ Source: listings_history table (triggers on properties + properties_extension) + one-shot
backfill from property_details.listing_events for pre-trigger history.
Climate risk First Street
- Flood 6/10 Major FEMA zone X (unshaded) · 74% chance over 30 yrs
- Wildfire 1/10 Low
- Heat 5/10 Major 7 d/yr ≥107°F today · 20 d/yr by 30 yrs out
- Wind 4/10 Moderate 10% chance of damaging wind over 30 yrs
- Air quality 2/10 Low 0 unhealthy d/yr today · 1 by 30 yrs out
Nearby sold comps map
Loading sold comps map…
Walkable amenities ~0.75 mi
Loading nearby amenities…
Taxation est. · year 1
- Rental income
- $17,919
- − Mortgage interest
- −$7,002
- − Property taxes
- −$1,875
- − Insurance
- −$625
- − Repairs & maintenance
- −$1,434
- − Management
- −$1,434
- − Depreciation
- −$3,636
- Taxable income
- $1,914
- Est. tax owed @ 24.0%
- −$459
- After-tax cash flow
- $3,331/yr
For passive investors: Depreciation is non-cash, so a rental often shows a tax loss while cash-flowing — sheltering income. Rental losses are passive: they offset passive income freely, and up to $25,000/yr can offset ordinary (W-2) income if you actively participate and your MAGI is under $100k (phasing out to $0 by $150k); unused losses carry forward. On sale, claimed depreciation is recaptured at up to 25%, and gains may owe capital-gains tax (a 1031 exchange can defer both). Figures are a year-1 estimate at your 24.0% rate — not tax advice; consult a CPA.
Schools (NCES district)
- District
- Todd County
- NCES district ID
- 2105550
- Math proficiency
- 23% ▼ -16.00%
- Reading proficiency
- 39% ▼ -15.00%
- Median HH income
- $39,989
- Composite
- 26.01/100
- National rank
- #7315
- State rank
- #99 of 165 in KY
Livability — Guthrie
- Score
- 63/100
- State rank
- #328
- US rank
- #15684
Category grades
Schools grade is shown separately in the Schools card above.
Census & demographics
- Census place
- Guthrie, KY
- Population (ZIP)
- 2,299
Population outlook (Todd County) Hauer SSP2
- Today (2025)
- 12,073 people
- By 2030
- 11,770 · -2.5%
- By 2040
- 11,082 · -8.2%
- By 2050
- 10,250 · -15.1%
- By 2075
- 8,037 · -33.4%
- By 2100
- 5,654 · -53.2%
Race, ethnicity, and origin ACS 2023
- Neighborhood character
- Predominantly White (69%)
- Race & ethnicity
- White 69% Black 18% Hispanic / Latino 10% Two or more races 4%
- Hispanic origin (detail)
- Mexican 8%
- Common ancestry
- Slovak 1% Polish 1% Lithuanian 1%
- Foreign-born
- 4% · Canada
- Languages at home
- 77% English-only · German/W. Germanic 16% Spanish 7%
Political lean MEDSL · Todd
- 2024 margin
- Solid R (+57.9) · D 20.6% · R 78.4% · Other 1.0%
- 2008→2024 swing
- -21.6pp toward R · 2008: -36.3pp · 2024: -57.9pp
- All cycles
- 2024: R+57.9 2020: R+53.3 2016: R+53.9 2012: R+39.1 2008: R+36.3
Not yet ingested
- Civics
- —
Market trends
- HPI YoY
- ▼ -8.98%
- Current HPI
- 299.0887
- Rent YoY
- —
- Metro
- —
- State GDP YoY
- ▲ 1.81%
- F500 in state
- 4
Industry mix (Fortune 500 HQ in KY)
| Industry | F500 HQs | Revenue |
|---|---|---|
| Healthcare | 1 | $118B |
|
||
| Food / Beverage | 1 | $7B |
|
||
Price history
+400.0% since first listed2 events — show timeline
- 2026-05-22 Listed $125,000 REALTRACS as Distributed by MLS Grid
- 1998-11-01 Sold (Public Records) $25,000 Public Records
Property tax history
+1.0%/yrLatest (2025): $83 · -0.1% YoY. Source: county tax records.
Cash-flow waterfall
monthlySold comps — $/sqft
last 12 mo · ≤1 miLoading sold comps…