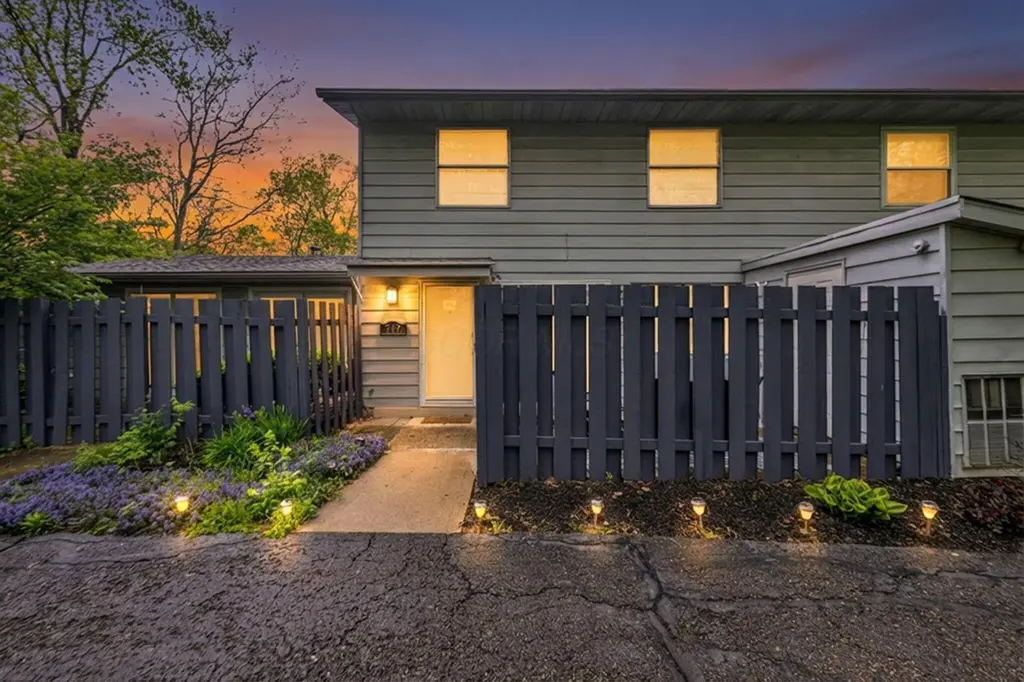
717 Cherry Hollow Rd Unit B · Columbus, OH
Flood risk 1/10 · Minimal
- FEMA flood zone
- X (unshaded)
- Chance of flooding over 30 yrs
- 0.0%
- Est. flood insurance / yr
- $507 – $1,088
Fire risk 1/10 · Minimal
- Est. fire insurance / yr
- $713 – $1,323
Heat risk 3/10 · Minor
- Hot days now (above 100°F)
- 7 days/yr
- Hot days in 30 yrs
- 17 days/yr
Wind risk 2/10 · Minimal
- Chance of severe wind over 30 yrs
- 1.0%
Air-quality risk 2/10 · Minimal
- Unhealthy air days now
- 1 days/yr
- Unhealthy air days in 30 yrs
- 2 days/yr
Risk factors via First Street. Map © Google.
Why this score? — see what drove the C grade
The composite is a weighted blend of 9 inputs, each scored 0–100. Each bar is that input's sub-score; the figure is the points it added to the 100-point composite (weight × sub-score).
- Cash flow +19.0/30.0
- ARV discount +14.5/15.0
- 1% rule +6.8/10.0
- DSCR +6.0/10.0
- Livability +4.0/5.0
- Schools +3.8/10.0
- Condition / age +2.5/5.0
- Rent growth +2.3/5.0
- Appreciation +0.0/10.0
$110,000
🖨 Deal sheet 📄 Offer letter ✓ Due diligence
Listing remarks
HUGE PRICE REDUCTION - NOW OFFERED AT ONLY $110,000! Incredible opportunity for owner occupants or investors. Welcome to this beautifully maintained end-unit condo in Cherry Creek Villas, offering one of the most private settings in the community. The open concept main living space feels bright and inviting, highlighted by a brick accent wall that adds warmth and character. The kitchen features GE Profile stainless steel appliances and connects seamlessly to the living area, making it perfect for everyday living or entertaining. You'll also find an updated bathroom, newer Maytag washer and dryer (2021) that will convey, and updated lighting and ceiling fans throughout, complemented by neutr
Key facts
- $203 HOA
- Garage
- Built 1972
Property features AI
Finance
- Other: Subdivision: Cherry Creek Villas
- HOA & community: Homeowners association with monthly fee of $203; HOA covers lawn care, trash, and snow removal
Exterior
- Parking: Attached garage with garage door opener (1 car)
- Utilities: Public water; Public sewer
- Home design: Condominium townhouse; Two levels; Built in 1972
- Construction: Other foundation
- Exterior features: Patio; End unit with shared walls (2+ common walls)
Interior
- Flooring: Laminate flooring; Carpeted areas
- Bathrooms: 1 full bathroom
- Heating & cooling: Central air conditioning; Forced air heating
- Interior features: Insulated windows throughout; Living area approximately 960
Neighborhood map
What this means for you Summary
Snapshot
- This is a 2-bed/1.0-bath condo listed at $110k.
Deal economics
- At list price, monthly cash flow is $116 ($1k/yr) — positive.
- The deal already cash-flows at list — no discount required.
- Meets the 1% rule at list price ($1k rent vs $110k).
- Recommended offer: $108k (1.5% below list) — sets the bar for market timing.
- Cap rate 7.6% vs local median 3.8% in Columbus — top-decile yield for the area; either an underpriced asset or a hidden risk that comps aren't pricing in. Stress-test before assuming the spread holds.
Location & tenants
- Location reads 81/100 on livability (#97 in OH, #1,491 nationally) — a professional / high-income tenant draw. Strengths: commute A+, cost of living A+, housing A+; Watch: employment C-, crime F.
- South-Western City (suburban): math 40% / reading 48% proficiency, ranked #500 of 656 in OH (top 76%) — families likely to look elsewhere, expect single-tenant / working-renter base with shorter leases.
- Market conditions: Rents soft (-0.6%/yr); 192 active listings in the ZIP; 34 comparable units currently listed for rent nearby; rentals at typical pace (median 15d on market — plan ~3-4 weeks tenant-placement turnaround); 8,139 units permitted in Franklin County in 2024 (5,940 in 5+ unit buildings).
Forward outlook
- Local home prices are declining (-3.0%/yr); year-one equity from $761 of loan paydown is wiped out by about $3k of value loss. Plan a longer hold.
- Franklin County population projected at +34% by 2050 — long-run rental-demand tailwind backs the buy-and-hold thesis.
Negotiation context
- It's been on market 18 days — a 2% lower offer ($108k) is reasonable based on typical stale-listing flexibility.
- Current owner paid $57k; list at $110k implies a 93% gain — meaningful room to come down on a strong offer.
Questions for the listing agent
- Built in 1972 — when were the roof, HVAC, electrical panel, plumbing, and water heater last replaced?
- What does the HOA fee cover, when was the last increase, and are there any pending special assessments or reserve-fund shortfalls?
- Any open or pending special assessments — roof, HVAC, plumbing, elevator, façade? What's the per-unit balance and payoff schedule, and is the seller paying it off at close or rolling it to the buyer?
- Is there a deadline driving the sale (1031 exchange, divorce, estate, relocation)? That informs how much negotiation room exists.
- Crime grade is F in this area — have there been break-ins, vandalism, or insurance claims at this property in the last 3 years? What carrier currently insures it and at what premium?
- What's the average days-on-market for RENTAL listings here right now (not sales)? A rising rental-DOM trend means longer vacancies and softer asking-rent achievability than the comps imply.
- What's the recent tenant-quality profile in this submarket — average credit score on applications, eviction rate, late-payment / NSF rate, and stable-employment percentage? A property-management company in the area should have these aggregated.
- How much new apartment / multifamily construction is in the pipeline within 1–3 miles? Heavy new supply (>2% of stock underway) typically softens rents 12–24 months out; light construction supports rent growth.
Investment metrics
- 1% rule
- 1.18% ✓
- Cap rate
- 7.55%
- Cash-on-cash
- 4.51%
- DSCR
- 1.20
- GRM
- 7.1
CMA / ARV
- ARV (median comp)
- $130,107
- List price
- $110,000
- Delta
- -15.45%
- Verdict
- UNDERPRICED
- Comps
- 20 within 1.0 mi
Projected returns pro-forma
-3.0% appreciation · 0.0% rent growth · sell at horizon
- IRR
- -13.2%
- Equity multiple
- 0.54×
- Total profit
- $-14,151
- Equity at exit
- $16,401
- IRR
- -10.9%
- Equity multiple
- 0.45×
- Total profit
- $-17,084
- Equity at exit
- $9,511
Cash invested: $30,800 (down + closing). Projections, not guarantees.
Landlord ↔ Tenant lean methodology
- Overall (STATE)
- 73 Landlord-Friendly
- State Ohio
- 73 Landlord-Friendly · R+6
- County
- — inherits STATE
- City
- — inherits STATE
ZIP-level market 43228
- Rents YoY
- -0.6%
- Active inventory
- 192
- Price-to-rent
- 7.1×
Monthly cashflow live
- Estimated rent
- $1,298 high interval (Pro) →
- Mortgage (P&I)
- −$577
- Tax from tax record
- −$84 /mo · $1,008/yr
- Insurance
- −$46
- HOA
- −$203
- Vacancy / Maint / Mgmt
- −$273
- Net cashflow
- $116
Break-even live
UW: 25.0% down · 7.5% · 30yr · 1.5% tax · 5.0% vac · 8.0% maint · 8.0% mgmt
Financing live
Cash to close
- Down payment
- $27,500
- Closing costs
- $3,300
- Reserves months
- —
- Total cash needed
- —
Loan-product check · same deal, 3 products live
Conventional
25% down · 7.5% · 30yr
- Down + closing
- —
- Monthly P&I
- —
- Monthly cashflow
- —
- DSCR
- —
- Eligible?
- —
Personal DTI + credit; lowest rate.
DSCR
20% down · 8.5% · 30yr
- Down + closing
- —
- Monthly P&I
- —
- Monthly cashflow
- —
- DSCR
- —
- Eligible?
- —
No personal income docs; deal must DSCR.
Hard money
10% down · 12.0% · 12mo
- Down + closing
- —
- Monthly P&I
- —
- Monthly cashflow
- —
- DSCR
- —
- Eligible?
- —
Short-term bridge; refi at stabilization.
Rent comps 34 comps
| Address | Beds | Baths | Sqft | Rent | $/sqft | DOM | Units | Dist |
|---|---|---|---|---|---|---|---|---|
| 550 Brandenbush Ln Columbus, OH | 2.0 | 1.0 | 878 | $1,060 | $1.21 | 3d | 7 | 0.47mi |
| 4800 Hall Rd Columbus, OH | 1.0–3.0 | 1.0–2.0 | 880 | $1,074 | $1.22 | 2d | 24 | 0.52mi |
| 1050 Plumrose Dr Columbus, OH | 1.0 | 1.0 | 576 | $1,005 | $1.74 | 7d | 3 | 0.54mi |
| 5580 Leigh Run Ct Columbus, OH | 2.0 | 1.0 | 950 | $1,244 | $1.31 | 1d | 3 | 0.61mi |
| 931 Muirwood Village Dr Columbus, OH | 1.0–2.0 | 1.0 | 800 | $1,399 | $1.75 | 3d | 11 | 0.62mi |
| 1112 Ashberry Village Dr Columbus, OH | 2.0 | 1.0 | 850 | $974 | $1.15 | 1d | 6 | 0.67mi |
| 4573 Westport Rd Unit 670-106 Columbus, OH | 3.0 | 1.5 | 1095 | $1,417 | $1.29 | 43d | 1 | 0.75mi |
| 4573 Westport Rd Unit 4507-107 Columbus, OH | 3.0 | 1.5 | 1095 | $1,417 | $1.29 | 12d | 1 | 0.75mi |
| 4573 Westport Rd Unit 690-205 Columbus, OH | 2.0 | 1.5 | 919 | $1,471 | $1.60 | 43d | 1 | 0.75mi |
| 4573 Westport Rd Unit 670-201 Columbus, OH | 2.0 | 1.5 | 919 | $1,226 | $1.33 | 43d | 1 | 0.75mi |
| 4573 Westport Rd Unit 670-205 Columbus, OH | 2.0 | 1.5 | 919 | $1,471 | $1.60 | 12d | 1 | 0.75mi |
| 4573 Westport Rd Unit 4567-101 Columbus, OH | 3.0 | 1.5 | 1095 | $1,701 | $1.55 | 43d | 1 | 0.75mi |
| 5500 Floral Cir S Columbus, OH | 1.0–3.0 | 1.0–2.0 | 762 | $1,152 | $1.51 | 3d | 22 | 0.76mi |
| 5445 Eaglecrest Dr Galloway, OH | 1.0–2.0 | 1.0–2.0 | 800 | $1,290 | $1.61 | 14d | 7 | 0.78mi |
| 2791 Chopper Ln Columbus, OH | 1.0–2.0 | 1.0–2.5 | 1004 | $2,884 | $2.87 | 1d | 25 | 0.80mi |
| 4551 Durrow Dr Columbus, OH | 1.0–2.0 | 1.0–2.5 | 970 | $1,645 | $1.70 | 3d | 22 | 0.84mi |
| 4436 Westport Rd Columbus, OH | 2.0 | 1.0 | 866 | $1,004 | $1.16 | 21d | 7 | 0.85mi |
| 5400 Lindbergh Blvd Columbus, OH | 1.0–2.0 | 1.0 | 749 | $1,120 | $1.49 | 3d | 8 | 0.88mi |
| 4707 Hilton Ave Columbus, OH | 1.0 | 1.0 | 550 | $850 | $1.55 | 43d | 1 | 0.99mi |
| 4651 Hilton Ave Unit B Columbus, OH | 2.0 | 1.0 | 900 | $945 | $1.05 | 43d | 1 | 1.01mi |
| 4688 Hilton Ave Unit B Columbus, OH | 2.0 | 1.0 | 800 | $1,025 | $1.28 | 43d | 1 | 1.03mi |
| 5591 Rustling Way LN Galloway, OH | 1.0–3.0 | 1.0–2.5 | 962 | $1,427 | $1.48 | 1d | 8 | 1.12mi |
| 626 Bantry Bay Ct Galloway, OH | 1.0 | 1.0 | 610 | $999 | $1.64 | 23d | 1 | 1.12mi |
| 1595 Georgesville Rd Columbus, OH | 1.0–3.0 | 1.0–2.0 | 953 | $1,575 | $1.65 | 1d | 1 | 1.24mi |
| 80 Tarryton Ct E Unit 80 Columbus, OH | 2.0 | 1.5 | 992 | $1,650 | $1.66 | 43d | 1 | 1.26mi |
| 500 Dove Tree Dr Galloway, OH | 1.0–2.0 | 1.0–1.5 | 804 | $1,419 | $1.76 | 1d | 1 | 1.26mi |
| 4696 Tarryton Ct S Columbus, OH | 1.0–2.0 | 1.0 | 818 | $949 | $1.16 | 43d | 2 | 1.28mi |
| 4696 Tarryton Ct S Columbus, OH | 2.0 | 1.0 | 852 | $949 | $1.11 | 23d | 1 | 1.28mi |
| 90 Old Village Rd Columbus, OH | 3.0 | 1.0 | 1100 | $995 | $0.90 | 43d | 1 | 1.30mi |
| 5809-5811 Pepperwood Ct Unit 5809 Galloway, OH | 2.0 | 1.0 | 910 | $1,349 | $1.48 | 19d | 1 | 1.33mi |
| 4711 Bay Run Dr Columbus, OH | 1.0–2.0 | 1.0 | 765 | $1,175 | $1.54 | 14d | 6 | 1.35mi |
| 5605 W Broad St Columbus, OH | 1.0–2.0 | 1.0–2.0 | 823 | $1,465 | $1.78 | 1d | 30 | 1.36mi |
| 5761 Ricardo Dr Galloway, OH | 3.0 | 2.0 | 1102 | $2,010 | $1.82 | 43d | 1 | 1.45mi |
| 815 Galloway Rd Galloway, OH | 1.0–3.0 | 1.0–2.0 | 953 | $1,512 | $1.59 | 1d | 1 | 1.46mi |
HOA detail condo
- Monthly dues
- $203 · $2,436/yr
- Assessments
- None detected in remarks — confirm with the listing agent.
Listing history 9 events
-
2026-05-12status Pending 1021-char remark
-
2026-05-08price $110,000 1021-char remark
-
2026-05-07price $133,000 1021-char remark
-
2026-04-24$134,900 Active 1021-char remark
-
2026-04-23historical $134,900 1021-char remark
-
2004-09-10soldstatus $57,000
-
1996-10-29soldstatus $39,500
-
1990-08-28soldstatus $31,000
-
1988-06-08soldstatus $32,000
ⓘ Source: listings_history table (triggers on properties + properties_extension) + one-shot
backfill from property_details.listing_events for pre-trigger history.
Tax reassessment forecast OH · Partial reset (capped growth)
- Current annual tax
- $1,008 · $84/mo
- Projected year-2 tax
- $1,362 · $114/mo
- Expected delta
- +$354/yr (+$29/mo · 35.1%)
ⓘ Screening estimate from a state-policy table — verify with the county assessor before closing.
Climate risk First Street
- Flood 1/10 Low FEMA zone X (unshaded) · 0% chance over 30 yrs
- Wildfire 1/10 Low
- Heat 3/10 Moderate 7 d/yr ≥100°F today · 17 d/yr by 30 yrs out
- Wind 2/10 Low 100% chance of damaging wind over 30 yrs
- Air quality 2/10 Low 1 unhealthy d/yr today · 2 by 30 yrs out
Nearby sold comps map
Loading sold comps map…
Walkable amenities ~0.75 mi
Loading nearby amenities…
Taxation est. · year 1
- Rental income
- $15,575
- − Mortgage interest
- −$6,162
- − Property taxes
- −$1,008
- − Insurance
- −$550
- − Repairs & maintenance
- −$1,246
- − Management
- −$1,246
- − HOA
- −$2,436
- − Depreciation
- −$3,200
- Taxable loss
- −$273
- Est. tax savings @ 24.0%
- +$65
- After-tax cash flow
- $1,453/yr
For passive investors: Depreciation is non-cash, so a rental often shows a tax loss while cash-flowing — sheltering income. Rental losses are passive: they offset passive income freely, and up to $25,000/yr can offset ordinary (W-2) income if you actively participate and your MAGI is under $100k (phasing out to $0 by $150k); unused losses carry forward. On sale, claimed depreciation is recaptured at up to 25%, and gains may owe capital-gains tax (a 1031 exchange can defer both). Figures are a year-1 estimate at your 24.0% rate — not tax advice; consult a CPA.
Schools (NCES district)
- District
- South-Western City
- NCES district ID
- 3904480
- Math proficiency
- 40% ▼ -18.00%
- Reading proficiency
- 48% ▼ -10.00%
- Median HH income
- $51,689
- Composite
- 37.95/100
- National rank
- #4305
- State rank
- #500 of 656 in OH
Livability — Columbus
- Score
- 81/100
- State rank
- #97
- US rank
- #1491
Category grades
Schools grade is shown separately in the Schools card above.
Census & demographics
- Census place
- Columbus, OH
- County
- Franklin County · 1,351,780 people
- City population
- 612,189
- Metro
- Columbus, OH
- Population (ZIP)
- 59,077
- Household income
- $61,713
- Rent vs Own
- Severe rent burden
- 3284.0
Population outlook (Franklin County) Hauer SSP2
- Today (2025)
- 1,456,139 people
- By 2030
- 1,556,890 · +6.9%
- By 2040
- 1,757,349 · +20.7%
- By 2050
- 1,950,539 · +34.0%
- By 2075
- 2,376,171 · +63.2%
- By 2100
- 2,636,796 · +81.1%
Race, ethnicity, and origin ACS 2023
- Neighborhood character
- Diverse neighborhood (Simpson 0.64)
- Race & ethnicity
- White 54% Black 23% Hispanic / Latino 14% Two or more races 11% Asian 3%
- Hispanic origin (detail)
- Mexican 8% Dominican 1%
- Common ancestry
- Slovak 2% Italian 1% Romanian 1%
- Foreign-born
- 19% · Canada, Jamaica
- Languages at home
- 74% English-only · Spanish 12% Other Indo-European 1% Other Asian/Pacific 1%
Political lean MEDSL · Franklin
- 2024 margin
- Strong D (+28.4) · D 63.7% · R 35.3% · Other 1.0%
- 2008→2024 swing
- +7.7pp toward D · 2008: 20.7pp · 2024: 28.4pp
- All cycles
- 2024: D+28.4 2020: D+31.4 2016: D+25.9 2012: D+21.7 2008: D+20.7
Not yet ingested
- Civics
- —
Market trends
- HPI YoY
- ▼ -245.97%
- Current HPI
- 234.1992
- Rent YoY
- ▼ -0.63%
- Metro
- Columbus, OH
- State GDP YoY
- ▲ 1.98%
- F500 in state
- 48
Industry mix (Fortune 500 HQ in OH)
| Industry | F500 HQs | Revenue |
|---|---|---|
| Insurance | 3 | $145B |
|
||
| Industrial Machinery | 3 | $49B |
|
||
| Financial Services | 3 | $24B |
|
||
| Consumer Goods | 2 | $93B |
|
||
| Aerospace / Defense | 2 | $47B |
|
||
| Utilities | 2 | $33B |
|
||
Price history
+243.8% since first listed9 events — show timeline
- 2026-05-12 Pending — CBRMLS
- 2026-05-08 Price Changed $110,000 CBRMLS
- 2026-05-07 Price Changed $133,000 CBRMLS
- 2026-04-24 Listed $134,900 CBRMLS
- 2026-04-23 Coming Soon $134,900 CBRMLS
- 2004-09-10 Sold (Public Records) $57,000 Public Records
- 1996-10-29 Sold (Public Records) $39,500 Public Records
- 1990-08-28 Sold (Public Records) $31,000 Public Records
- 1988-06-08 Sold (Public Records) $32,000 Public Records
Property tax history
+2.6%/yrLatest (2024): $1,008 · +1.8% YoY. Source: county tax records.
Cash-flow waterfall
monthlySold comps — $/sqft
last 12 mo · ≤1 miLoading sold comps…