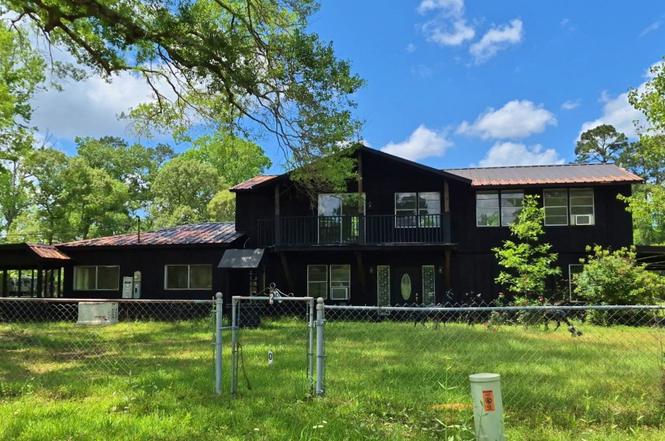
20810 Deuster Ln · Porter Heights, TX
Flood risk 1/10 · Minimal
- FEMA flood zone
- X (unshaded)
- Chance of flooding over 30 yrs
- 0.0%
- Est. flood insurance / yr
- $507 – $1,088
Fire risk 2/10 · Minimal
- Est. fire insurance / yr
- $1,222 – $2,270
Heat risk 8/10 · Major
- Hot days now (above 110°F)
- 7 days/yr
- Hot days in 30 yrs
- 24 days/yr
Wind risk 8/10 · Major
- Chance of severe wind over 30 yrs
- 99.0%
Air-quality risk 3/10 · Minor
- Unhealthy air days now
- 3 days/yr
- Unhealthy air days in 30 yrs
- 3 days/yr
Risk factors via First Street. Map © Google.
Why this score? — see what drove the C grade
The composite is a weighted blend of 9 inputs, each scored 0–100. Each bar is that input's sub-score; the figure is the points it added to the 100-point composite (weight × sub-score).
- Cash flow +20.9/30.0
- ARV discount +15.0/15.0
- DSCR +6.7/10.0
- 1% rule +5.6/10.0
- Livability +3.2/5.0
- Rent growth +2.9/5.0
- Schools +2.8/10.0
- Condition / age +2.5/5.0
- Appreciation +0.0/10.0
$215,001
🖨 Deal sheet 📄 Offer letter ✓ Due diligence
Listing remarks
4 Bedroom 2.5 Bath 2 Car Carport with workshop. Situated on a 1-acre lot in Porter Texas. This custom home has it ALL! 4 BED/2 FULL BATH/1 HALF BATH/ 2-CAR CARPORT, ELEVATOR & GENERATOR. Full Size Kitchen upstairs and a Kitchenette downstairs. Master bedroom on the 1st floor with access to a large patio. The additional room on the 1st floor could be used as a 2nd bedroom or Study/office. Two bedrooms upstairs with access to Full Size Kitchen and Full bathroom. RV connection w/ power hookup near the workshop. The large workshop can be used for storage. There is an additional room attached to the workshop that could be used for additional living space. Great location with quick and easy
Key facts
- 1 acre lot
- 2 parking spots
- Built 1970
Neighborhood map
What this means for you Summary
Snapshot
- This is a 4-bed/1.5-bath single-family listed at $215k.
Deal economics
- At list price, monthly cash flow is $299 ($4k/yr) — positive.
- The deal already cash-flows at list — no discount required.
- Meets the 1% rule at list price ($2k rent vs $215k).
- Cap rate 8.0% vs local median 2.5% in Porter Heights — top-decile yield for the area; either an underpriced asset or a hidden risk that comps aren't pricing in. Stress-test before assuming the spread holds.
Location & tenants
- Location reads 65/100 on livability (#663 in TX) — a middle-class / working-renter tenant base. Strengths: crime A+, employment A+, cost of living A+; Watch: schools F, amenities F, commute F.
- New Caney ISD (suburban): math 31% / reading 32% proficiency, ranked #570 of 826 in TX (top 69%) — families likely to look elsewhere, expect single-tenant / working-renter base with shorter leases.
- Market conditions: Rents rising (+1.6%/yr); 941 active listings in the ZIP; solid renter incomes; 13,259 units permitted in Montgomery County in 2024 (1,402 in 5+ unit buildings).
Forward outlook
- Local home prices are declining (-3.0%/yr); year-one equity from $1k of loan paydown is wiped out by about $6k of value loss. Plan a longer hold.
- Montgomery County population projected at +65% by 2050 — long-run rental-demand tailwind backs the buy-and-hold thesis.
Negotiation context
- Only 1 days on market — expect competitive offers; lowballing is unlikely to land.
- 3 sale attempts; this cycle's ask has dropped $173k (45%) from the opening price — seller is motivated, your offer sets the floor, not the list.
Risks & watch-outs
- Climate carrying-cost: severe wind risk, 99% chance of damaging wind over 30y; extreme-heat days projected 7→24/yr by 2055 (HVAC capex compounding) — expect insurance premiums to compound above CPI over the hold.
Questions for the listing agent
- Built in 1970 — when were the roof, HVAC, electrical panel, plumbing, and water heater last replaced?
- Is there a deadline driving the sale (1031 exchange, divorce, estate, relocation)? That informs how much negotiation room exists.
- Schools are F-rated, which usually means shorter tenancies and higher turnover. Who's the typical renter profile here, and what's been the actual vacancy rate?
- What's the average days-on-market for RENTAL listings here right now (not sales)? A rising rental-DOM trend means longer vacancies and softer asking-rent achievability than the comps imply.
- What's the recent tenant-quality profile in this submarket — average credit score on applications, eviction rate, late-payment / NSF rate, and stable-employment percentage? A property-management company in the area should have these aggregated.
- How much new for-sale + rental construction is in the pipeline within 1–3 miles? Heavy new supply typically softens prices + rents 12–24 months out; constrained supply supports both.
Investment metrics
- 1% rule
- 1.06% ✓
- Cap rate
- 7.96%
- Cash-on-cash
- 5.97%
- DSCR
- 1.27
- GRM
- 7.8
CMA / ARV
- ARV (median comp)
- $413,557
- List price
- $215,001
- Delta
- -6.08%
- Verdict
- FAIR
- Comps
- 20 within 1.0 mi
Show comp detail 2 sales within ~0.75 mi
| Address | Dist | Beds/Ba | Sqft | Sold | Price | $/sf | Match |
|---|---|---|---|---|---|---|---|
| 20687 Alexander Ln | 0.15mi | 5/3.0 (+1) | 3,384 (-8%) | 18mo | $300,000 | $89 | 54 |
| 20596 Lakeside Dr | 0.68mi | 5/3.0 (+1) | 3,189 (-13%) | 18mo | $385,000 | $121 | 21 |
Match score weights: distance 35% · size 25% · config 20% · recency 20%. Top-matched comps best support the ARV.
Projected returns pro-forma
-3.0% appreciation · 1.65% rent growth · sell at horizon
- IRR
- -8.6%
- Equity multiple
- 0.69×
- Total profit
- $-18,798
- Equity at exit
- $32,057
- IRR
- -1.0%
- Equity multiple
- 0.94×
- Total profit
- $-3,879
- Equity at exit
- $18,589
Cash invested: $60,200 (down + closing). Projections, not guarantees.
Landlord ↔ Tenant lean methodology
- Overall (STATE)
- 87 Strongly Landlord-Friendly
- State Texas
- 87 Strongly Landlord-Friendly · R+5
- County
- — inherits STATE
- City
- — inherits STATE
ZIP-level market 77365
- Home prices YoY
- -33.0%
- Rents YoY
- 1.6%
- Active inventory
- 941
- Price-to-rent
- 7.8×
Monthly cashflow live
- Estimated rent
- $2,289 medium interval (Pro) →
- Mortgage (P&I)
- −$1,127
- Tax from tax record
- −$292 /mo · $3,505/yr
- Insurance
- −$90
- HOA
- −$0
- Vacancy / Maint / Mgmt
- −$481
- Net cashflow
- $299
Break-even live
UW: 25.0% down · 7.5% · 30yr · 1.5% tax · 5.0% vac · 8.0% maint · 8.0% mgmt
Financing live
Cash to close
- Down payment
- $53,750
- Closing costs
- $6,450
- Reserves months
- —
- Total cash needed
- —
Loan-product check · same deal, 3 products live
Conventional
25% down · 7.5% · 30yr
- Down + closing
- —
- Monthly P&I
- —
- Monthly cashflow
- —
- DSCR
- —
- Eligible?
- —
Personal DTI + credit; lowest rate.
DSCR
20% down · 8.5% · 30yr
- Down + closing
- —
- Monthly P&I
- —
- Monthly cashflow
- —
- DSCR
- —
- Eligible?
- —
No personal income docs; deal must DSCR.
Hard money
10% down · 12.0% · 12mo
- Down + closing
- —
- Monthly P&I
- —
- Monthly cashflow
- —
- DSCR
- —
- Eligible?
- —
Short-term bridge; refi at stabilization.
Listing history 8 events
-
2026-06-18pricestatusdays on market $215,001 Active 1 DOM
-
2026-05-12historical
-
2026-03-05historical $2,950
-
2026-02-11$388,400 Active
-
2025-12-22$2,950
-
2025-10-17historical
-
2025-08-27price $388,400
-
2025-07-30$400,000 Active
ⓘ Source: listings_history table (triggers on properties + properties_extension) + one-shot
backfill from property_details.listing_events for pre-trigger history.
Tax reassessment forecast TX · Resets to sale price
- Current annual tax
- $3,505 · $292/mo
- Projected year-2 tax
- $3,935 · $328/mo
- Expected delta
- +$429/yr (+$36/mo · 12.2%)
ⓘ Screening estimate from a state-policy table — verify with the county assessor before closing.
Climate risk First Street
- Flood 1/10 Low FEMA zone X (unshaded) · 0% chance over 30 yrs
- Wildfire 2/10 Low
- Heat 8/10 Severe 7 d/yr ≥110°F today · 24 d/yr by 30 yrs out
- Wind 8/10 Severe 99% chance of damaging wind over 30 yrs
- Air quality 3/10 Moderate 3 unhealthy d/yr today · 3 by 30 yrs out
Nearby sold comps map
Loading sold comps map…
Walkable amenities ~0.75 mi
Loading nearby amenities…
Taxation est. · year 1
- Rental income
- $27,470
- − Mortgage interest
- −$12,043
- − Property taxes
- −$3,505
- − Insurance
- −$1,075
- − Repairs & maintenance
- −$2,198
- − Management
- −$2,198
- − Depreciation
- −$6,255
- Taxable income
- $197
- Est. tax owed @ 24.0%
- −$47
- After-tax cash flow
- $3,544/yr
For passive investors: Depreciation is non-cash, so a rental often shows a tax loss while cash-flowing — sheltering income. Rental losses are passive: they offset passive income freely, and up to $25,000/yr can offset ordinary (W-2) income if you actively participate and your MAGI is under $100k (phasing out to $0 by $150k); unused losses carry forward. On sale, claimed depreciation is recaptured at up to 25%, and gains may owe capital-gains tax (a 1031 exchange can defer both). Figures are a year-1 estimate at your 24.0% rate — not tax advice; consult a CPA.
Schools (NCES district)
- District
- New Caney ISD
- NCES district ID
- 4832400
- Math proficiency
- 31% ▼ -16.00%
- Reading proficiency
- 32% ▼ -6.00%
- Median HH income
- $55,380
- Composite
- 27.97/100
- National rank
- #6857
- State rank
- #570 of 826 in TX
Livability — Porter Heights
- Score
- 65/100
- State rank
- #663
- US rank
- #12479
Category grades
Schools grade is shown separately in the Schools card above.
Census & demographics
- Census place
- Porter Heights, TX
- County
- Montgomery County · 663,713 people
- Metro
- Houston-The Woodlands-Sugar Land, TX
- Population (ZIP)
- 46,418
- Household income
- $95,702
- Rent vs Own
- Severe rent burden
- 1016.0
Population outlook (Montgomery County) Hauer SSP2
- Today (2025)
- 713,896 people
- By 2030
- 805,263 · +12.8%
- By 2040
- 992,708 · +39.1%
- By 2050
- 1,179,590 · +65.2%
- By 2075
- 1,628,084 · +128.1%
- By 2100
- 1,937,880 · +171.5%
Race, ethnicity, and origin ACS 2023
- Neighborhood character
- Diverse neighborhood (Simpson 0.59)
- Race & ethnicity
- Hispanic / Latino 46% White 44% Two or more races 15% Black 5% Asian 3%
- Hispanic origin (detail)
- Mexican 39% Puerto Rican 1%
- Common ancestry
- Lithuanian 4% Slovak 2% Romanian 2%
- Foreign-born
- 18% · Canada
- Languages at home
- 59% English-only · Spanish 36% Other Indo-European 2% Russian/Polish/Slavic 1%
Political lean MEDSL · Montgomery
- 2024 margin
- Solid R (+45.5) · D 26.8% · R 72.3%
- 2008→2024 swing
- +7.2pp toward D · 2008: -52.7pp · 2024: -45.5pp
- All cycles
- 2024: R+45.5 2020: R+43.8 2016: R+51.4 2012: R+60.7 2008: R+52.7
Not yet ingested
- Civics
- —
Market trends
- HPI YoY
- ▼ -111.46%
- Current HPI
- 225.9903
- Rent YoY
- ▲ 1.65%
- Metro
- Houston-The Woodlands-Sugar Land, TX
- State GDP YoY
- ▲ 3.95%
- F500 in state
- 110
Industry mix (Fortune 500 HQ in TX)
| Industry | F500 HQs | Revenue |
|---|---|---|
| Energy | 16 | $1,198B |
|
||
| Technology | 5 | $198B |
|
||
| Engineering / Construction | 4 | $72B |
|
||
| Energy Services | 3 | $60B |
|
||
| Utilities | 3 | $41B |
|
||
| Healthcare | 2 | $330B |
|
||
Price history
-99.3% since first listed7 events — show timeline
- 2026-05-12 Listing Removed — HARMLS
- 2026-03-05 Rental Removed $2,950 HARMLS
- 2026-02-11 Listed $388,400 HARMLS
- 2025-12-22 Listed for Rent $2,950 HARMLS
- 2025-10-17 Listing Removed — HARMLS
- 2025-08-27 Price Changed $388,400 HARMLS
- 2025-07-30 Listed $400,000 HARMLS
Property tax history
+7.1%/yrLatest (2025): $3,505 · -0.3% YoY. Source: county tax records.
Cash-flow waterfall
monthlySold comps — $/sqft
last 12 mo · ≤1 miLoading sold comps…