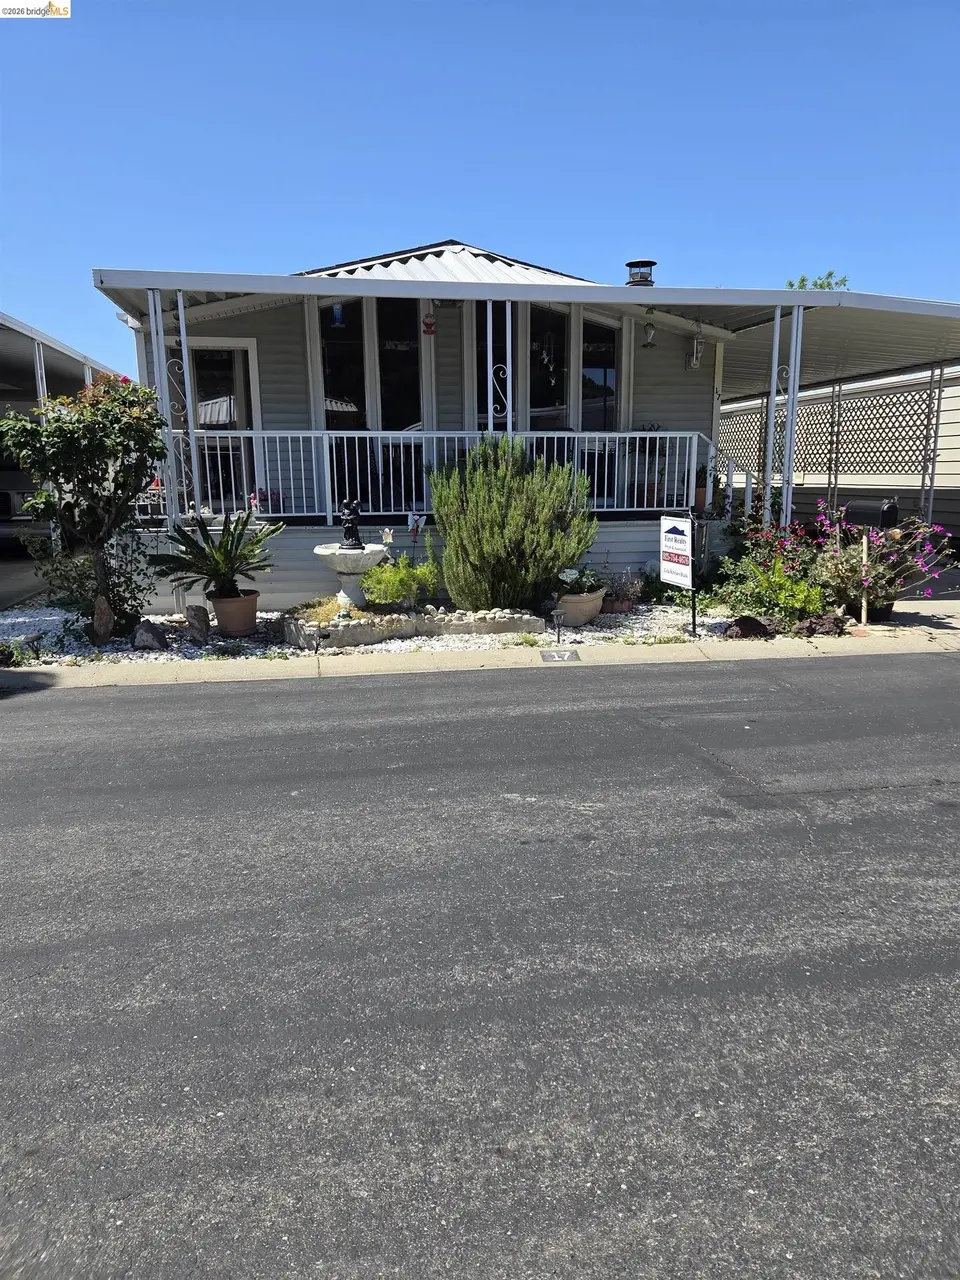
17 Bradley Ln · Antioch, CA
Flood risk 1/10 · Minimal
- FEMA flood zone
- X (unshaded)
- Chance of flooding over 30 yrs
- 0.0%
- Est. flood insurance / yr
- $507 – $1,088
Fire risk 7/10 · Major
- Est. fire insurance / yr
- $659 – $1,223
Heat risk 5/10 · Moderate
- Hot days now (above 100°F)
- 7 days/yr
- Hot days in 30 yrs
- 13 days/yr
Wind risk 1/10 · Minimal
- Chance of severe wind over 30 yrs
- —
Air-quality risk 9/10 · Severe
- Unhealthy air days now
- 16 days/yr
- Unhealthy air days in 30 yrs
- 19 days/yr
Risk factors via First Street. Map © Google.
Why this score? — see what drove the B- grade
The composite is a weighted blend of 9 inputs, each scored 0–100. Each bar is that input's sub-score; the figure is the points it added to the 100-point composite (weight × sub-score).
- Cash flow +30.0/30.0
- 1% rule +10.0/10.0
- DSCR +10.0/10.0
- ARV discount +7.5/15.0
- Schools +3.8/10.0
- Rent growth +2.8/5.0
- Livability +2.8/5.0
- Condition / age +2.5/5.0
- Appreciation +0.0/10.0
$99,000
🖨 Deal sheet 📄 Offer letter ✓ Due diligence
Listing remarks MLS
* SENIOR 55+ and Well maintained GATED Mobile Home Park* 1344 sq ft, 2 bed 2 bath!* No rear neighbors * Guest parking nearly. * Light and airy open floor plan with oversized living room & dining room with beamed ceilings*, spacious Kitchen ample counter top deck off the living room with fireplace,, storage shed* Water softener* Alll appliances are included,* Laundry room with lots of storage** Updated clubhouse with pool tables, tennis table, swimming pool, spa. exercise room* FAST CLOSE AND OCCUPANCY. SHOWN BY APPOINTMENT ONLY !Must be Park approved and income must be 2 -3 X the amount of the rent
Key facts
- Guest parking
- Exercise room
- Swimming pool
Tags
Neighborhood map
What this means for you Summary
Snapshot
- This is a 2-bed/2.0-bath manufactured listed at $99k.
Deal economics
- At list price, monthly cash flow is $1k ($16k/yr) — positive.
- The deal already cash-flows at list — no discount required.
- Meets the 1% rule at list price ($3k rent vs $99k).
- Recommended offer: $93k (6.0% below list) — sets the bar for market timing.
- Cap rate 22.3% vs local median 3.9% in Antioch — top-decile yield for the area; either an underpriced asset or a hidden risk that comps aren't pricing in. Stress-test before assuming the spread holds.
Location & tenants
- Location reads 56/100 on livability (#782 in CA) — a working-class tenant base; expect higher turnover. Strengths: employment A+, housing A+, health & safety A; Watch: schools F, crime F, amenities F.
- Antioch Unified (suburban): math 29% / reading 55% proficiency, ranked #200 of 517 in CA (top 39%) — families likely to look elsewhere, expect single-tenant / working-renter base with shorter leases.
- Market conditions: Rents rising (+1.1%/yr); 206 active listings in the ZIP; 20 comparable units currently listed for rent nearby; rentals lingering (median 44d on market — plan ~5-8 weeks vacancy on turnover, expect pricing pressure); 60% of comp listings sitting > 30 days — soft ceiling on asking rent; solid renter incomes; 2,169 units permitted in Contra Costa County in 2024 (896 in 5+ unit buildings).
- This rent runs 35% of the median local income ($86k/yr) — at the standard rent-burdened threshold; future hikes will face affordability resistance.
Forward outlook
- Local home prices are declining (-3.0%/yr); year-one equity from $684 of loan paydown is wiped out by about $3k of value loss. Plan a longer hold.
- Contra Costa County population projected at +26% by 2050 — long-run rental-demand tailwind backs the buy-and-hold thesis.
- At projected returns (-3.0% appreciation + 1.1% rent growth), your $28k cash investment doubles in ~3 years — after that, you're playing with house money.
Negotiation context
- It's been on market 77 days — a 6% lower offer ($93k) is reasonable based on typical stale-listing flexibility.
Risks & watch-outs
- Climate carrying-cost: major wildfire risk; extreme-heat days projected 7→13/yr by 2055 (HVAC capex compounding) — expect insurance premiums to compound above CPI over the hold.
Questions for the listing agent
- It's been on market 77 days. Have you received any prior offers? Is the seller open to a 6% concession, seller financing, or rate buy-down credit?
- Why hasn't it sold? Are there any deal-killer items the seller is aware of (foundation, flood, title, zoning, code violations)?
- Is there a deadline driving the sale (1031 exchange, divorce, estate, relocation)? That informs how much negotiation room exists.
- Schools are F-rated, which usually means shorter tenancies and higher turnover. Who's the typical renter profile here, and what's been the actual vacancy rate?
- Crime grade is F in this area — have there been break-ins, vandalism, or insurance claims at this property in the last 3 years? What carrier currently insures it and at what premium?
- What's the average days-on-market for RENTAL listings here right now (not sales)? A rising rental-DOM trend means longer vacancies and softer asking-rent achievability than the comps imply.
- What's the recent tenant-quality profile in this submarket — average credit score on applications, eviction rate, late-payment / NSF rate, and stable-employment percentage? A property-management company in the area should have these aggregated.
- How much new for-sale + rental construction is in the pipeline within 1–3 miles? Heavy new supply typically softens prices + rents 12–24 months out; constrained supply supports both.
Investment metrics
- 1% rule
- 2.57% ✓
- Cap rate
- 22.35%
- Cash-on-cash
- 57.33%
- DSCR
- 3.55
- GRM
- 3.2
CMA / ARV
- ARV (median comp)
- $65,911
- List price
- $99,000
- Delta
- 50.20%
- Verdict
- OVERPRICED
- Comps
- 13 within 1.0 mi
Show comp detail 12 sales within ~0.75 mi
| Address | Dist | Beds/Ba | Sqft | Sold | Price | $/sf | Match |
|---|---|---|---|---|---|---|---|
| 26 Bradley Ln | 0.07mi | 2/2.0 | 1,296 (-4%) | 8mo | $88,000 | $68 | 84 |
| 91 Diana Way | 0.16mi | 2/2.0 | 1,440 (+7%) | 5mo | $62,000 | $43 | 76 |
| 98 Diana Way | 0.19mi | 2/2.0 | 1,440 (+7%) | 4mo | $60,000 | $42 | 76 |
| 15 Bradley Ln | 0.02mi | 2/2.0 | 1,440 (+7%) | 17mo | $40,000 | $28 | 73 |
| 56 Creekside Dr | 0.12mi | 2/2.0 | 1,248 (-7%) | 12mo | $47,500 | $38 | 72 |
| 120 Paulette Way | 0.18mi | 2/2.0 | 1,440 (+7%) | 10mo | $38,000 | $26 | 71 |
| 1 Mark Ln | 0.13mi | 2/2.0 | 1,536 (+14%) | 1mo | $95,000 | $62 | 69 |
| 34 Mark Ln | 0.04mi | 2/2.0 | 1,152 (-14%) | 8mo | $65,000 | $56 | 67 |
| 121 Paulette | 0.19mi | 2/2.0 | 1,440 (+7%) | 15mo | $89,000 | $62 | 67 |
| 147 Paulette Way | 0.17mi | 2/2.0 | 1,152 (-14%) | 9mo | $59,000 | $51 | 61 |
| 86 Diana Way | 0.14mi | 2/2.0 | 1,152 (-14%) | 11mo | $71,500 | $62 | 60 |
| 3301 Buchanan Rd #75 | 0.25mi | 2/2.0 | 1,211 (-10%) | 17mo | $115,000 | $95 | 57 |
Match score weights: distance 35% · size 25% · config 20% · recency 20%. Top-matched comps best support the ARV.
Projected returns pro-forma
-3.0% appreciation · 1.09% rent growth · sell at horizon
- IRR
- 53.6%
- Equity multiple
- 3.29×
- Total profit
- $63,551
- Equity at exit
- $14,761
- IRR
- 58.1%
- Equity multiple
- 6.24×
- Total profit
- $145,173
- Equity at exit
- $8,560
Cash invested: $27,720 (down + closing). Projections, not guarantees.
Landlord ↔ Tenant lean methodology
- Overall (STATE)
- 18 Strongly Tenant-Friendly
- State California
- 18 Strongly Tenant-Friendly · D+13
- County
- — inherits STATE
- City
- — inherits STATE
ZIP-level market 94509
- Rents YoY
- 1.1%
- Active inventory
- 206
- Price-to-rent
- 3.2×
Monthly cashflow live
- Estimated rent
- $2,542 high interval (Pro) →
- Mortgage (P&I)
- −$519
- Tax est. 1.5%
- −$124 /mo · $1,485/yr
- Insurance
- −$41
- HOA
- −$0
- Vacancy / Maint / Mgmt
- −$534
- Net cashflow
- $1,324
Break-even live
UW: 25.0% down · 7.5% · 30yr · 1.5% tax · 5.0% vac · 8.0% maint · 8.0% mgmt
Financing live
Cash to close
- Down payment
- $24,750
- Closing costs
- $2,970
- Reserves months
- —
- Total cash needed
- —
Loan-product check · same deal, 3 products live
Conventional
25% down · 7.5% · 30yr
- Down + closing
- —
- Monthly P&I
- —
- Monthly cashflow
- —
- DSCR
- —
- Eligible?
- —
Personal DTI + credit; lowest rate.
DSCR
20% down · 8.5% · 30yr
- Down + closing
- —
- Monthly P&I
- —
- Monthly cashflow
- —
- DSCR
- —
- Eligible?
- —
No personal income docs; deal must DSCR.
Hard money
10% down · 12.0% · 12mo
- Down + closing
- —
- Monthly P&I
- —
- Monthly cashflow
- —
- DSCR
- —
- Eligible?
- —
Short-term bridge; refi at stabilization.
Rent comps 20 comps
| Address | Beds | Baths | Sqft | Rent | $/sqft | DOM | Units | Dist |
|---|---|---|---|---|---|---|---|---|
| 2433 Sequoia Dr Antioch, CA | 3.0 | 2.0 | 1058 | $2,795 | $2.64 | 43d | 1 | 0.13mi |
| 3101 Buchanan Rd Antioch, CA | 1.0–2.0 | 1.0–2.0 | 837 | $2,295 | $2.74 | 1d | 4 | 0.23mi |
| 2811 Cadiz Ln Antioch, CA | 1.0–2.0 | 1.0–2.0 | 803 | $2,023 | $2.52 | 1d | 1 | 0.41mi |
| 2201 San Jose Dr Antioch, CA | 1.0–2.0 | 1.0–2.0 | 686 | $2,437 | $3.55 | 1d | 8 | 0.85mi |
| 2500 Florida Ln Antioch, CA | 2.0 | 1.0 | 1000 | $2,395 | $2.40 | 43d | 1 | 0.86mi |
| 2608 Nevada Ln Antioch, CA | 3.0 | 1.5 | 1056 | $2,450 | $2.32 | 43d | 1 | 0.88mi |
| 1902 San Jose Dr Antioch, CA | 3.0 | 2.0 | 1152 | $3,100 | $2.69 | 43d | 1 | 1.02mi |
| 1312 Mission Dr Antioch, CA | 3.0 | 2.0 | 1440 | $2,975 | $2.07 | 4d | 1 | 1.04mi |
| 2415 Horizon Ln #129 Antioch, CA | 2.0 | 2.0 | 944 | $2,800 | $2.97 | 43d | 1 | 1.10mi |
| 2725 Entrada Cir Antioch, CA | 3.0 | 2.0 | 1302 | $2,000 | $1.54 | 17d | 1 | 1.14mi |
| 2201 Sycamore Dr Antioch, CA | 1.0–3.0 | 1.0–2.0 | 1015 | $1,922 | $1.89 | 1d | 10 | 1.16mi |
| 2221 Dogwood Way Antioch, CA | 3.0 | 2.0 | 1154 | $2,995 | $2.60 | 43d | 1 | 1.30mi |
| 2205 E Leland Rd Pittsburg, CA | 1.0–2.0 | 1.0–2.0 | 847 | $2,359 | $2.79 | 1d | 20 | 1.33mi |
| 2112 Banyan Way Antioch, CA | 3.0 | 2.0 | 1154 | $2,900 | $2.51 | 43d | 1 | 1.37mi |
| 1608 Sycamore Dr Apt 2 Antioch, CA | 2.0 | 1.0 | 900 | $2,150 | $2.39 | 5d | 1 | 1.39mi |
| 60 Xena Ct Pittsburg, CA | 3.0 | 2.5 | 1805 | $3,200 | $1.77 | 43d | 1 | 1.42mi |
| 2308 Lemontree Way #4 Antioch, CA | 2.0 | 1.0 | 925 | $1,695 | $1.83 | 43d | 1 | 1.42mi |
| 1015 Fitzuren Rd Unit 2 Antioch, CA | 2.0 | 2.0 | 1035 | $2,500 | $2.42 | 43d | 1 | 1.43mi |
| 1015 Fitzuren Rd Unit 18 Antioch, CA | 2.0 | 2.0 | 1034 | $2,800 | $2.71 | 43d | 1 | 1.43mi |
| 1508 Crestview Dr Antioch, CA | 3.0 | 2.0 | 1197 | $2,949 | $2.46 | 43d | 1 | 1.45mi |
Listing history 15 events
-
2026-06-18days on market $99,000 Active 77 DOM
-
2026-06-17days on market $99,000 Active 76 DOM
-
2026-06-16days on market $99,000 Active 75 DOM
-
2026-06-15days on market $99,000 Active 74 DOM
-
2026-06-13days on market $99,000 Active 72 DOM
-
2026-06-13days on market $99,000 Active 71 DOM
-
2026-06-09days on market $99,000 Active 68 DOM
-
2026-06-08days on market $99,000 Active 67 DOM
-
2026-06-07days on market $99,000 Active 66 DOM
-
2026-06-04days on market $99,000 Active 63 DOM
-
2026-06-03days on market $99,000 Active 62 DOM
-
2026-06-02days on market $99,000 Active 61 DOM
-
2026-06-01days on market $99,000 Active 60 DOM
-
2026-05-31days on market $99,000 Active 59 DOM
-
2026-04-02$99,000 Active 611-char remark
Show marketing remark (611 chars)
* SENIOR 55+ and Well maintained GATED Mobile Home Park* 1344 sq ft, 2 bed 2 bath!* No rear neighbors * Guest parking nearly. * Light and airy open floor plan with oversized living room & dining room with beamed ceilings*, spacious Kitchen ample counter top deck off the living room with fireplace,, storage shed* Water softener* Alll appliances are included,* Laundry room with lots of storage** Updated clubhouse with pool tables, tennis table, swimming pool, spa. exercise room* FAST CLOSE AND OCCUPANCY. SHOWN BY APPOINTMENT ONLY !Must be Park approved and income must be 2 -3 X the amount of the rent
ⓘ Source: listings_history table (triggers on properties + properties_extension) + one-shot
backfill from property_details.listing_events for pre-trigger history.
Climate risk First Street
- Flood 1/10 Low FEMA zone X (unshaded) · 0% chance over 30 yrs
- Wildfire 7/10 Severe
- Heat 5/10 Major 7 d/yr ≥100°F today · 13 d/yr by 30 yrs out
- Wind 1/10 Low
- Air quality 9/10 Extreme 16 unhealthy d/yr today · 19 by 30 yrs out
Nearby sold comps map
Loading sold comps map…
Walkable amenities ~0.75 mi
Loading nearby amenities…
Taxation est. · year 1
- Rental income
- $30,509
- − Mortgage interest
- −$5,546
- − Property taxes
- −$1,485
- − Insurance
- −$495
- − Repairs & maintenance
- −$2,441
- − Management
- −$2,441
- − Depreciation
- −$2,880
- Taxable income
- $15,222
- Est. tax owed @ 24.0%
- −$3,653
- After-tax cash flow
- $12,239/yr
For passive investors: Depreciation is non-cash, so a rental often shows a tax loss while cash-flowing — sheltering income. Rental losses are passive: they offset passive income freely, and up to $25,000/yr can offset ordinary (W-2) income if you actively participate and your MAGI is under $100k (phasing out to $0 by $150k); unused losses carry forward. On sale, claimed depreciation is recaptured at up to 25%, and gains may owe capital-gains tax (a 1031 exchange can defer both). Figures are a year-1 estimate at your 24.0% rate — not tax advice; consult a CPA.
Schools (NCES district)
- District
- Antioch Unified
- NCES district ID
- 0602850
- Math proficiency
- 29% ▲ 12.00%
- Reading proficiency
- 55% ▲ 25.00%
- Median HH income
- $65,935
- Composite
- 37.57/100
- National rank
- #4386
- State rank
- #200 of 517 in CA
Livability — Antioch
- Score
- 56/100
- State rank
- #782
- US rank
- #22472
Category grades
Schools grade is shown separately in the Schools card above.
Census & demographics
- Census place
- Antioch, CA
- County
- Contra Costa County · 1,059,880 people
- City population
- 116,477
- Metro
- San Francisco-Oakland-Berkeley, CA
- Population (ZIP)
- 70,090
- Household income
- $86,196
- Rent vs Own
- Severe rent burden
- 3063.0
Population outlook (Contra Costa County) Hauer SSP2
- Today (2025)
- 1,287,720 people
- By 2030
- 1,364,937 · +6.0%
- By 2040
- 1,506,209 · +17.0%
- By 2050
- 1,624,373 · +26.1%
- By 2075
- 1,853,193 · +43.9%
- By 2100
- 1,901,231 · +47.6%
Race, ethnicity, and origin ACS 2023
- Neighborhood character
- Highly diverse neighborhood (Simpson 0.72)
- Race & ethnicity
- Hispanic / Latino 43% White 25% Two or more races 18% Black 16% Asian 9% Native American 2% Pacific Islander 2%
- Hispanic origin (detail)
- Mexican 30%
- Common ancestry
- Russian 2% Italian 2% Lithuanian 1%
- Foreign-born
- 23% · Canada, China, Vietnam
- Languages at home
- 62% English-only · Spanish 29% Tagalog/Filipino 3% Other Asian/Pacific 1%
Political lean MEDSL · Contra Costa
- 2024 margin
- Solid D (+38.0) · D 67.3% · R 29.4% · Other 3.3%
- 2008→2024 swing
- +0.2pp no change · 2008: 37.8pp · 2024: 38.0pp
- All cycles
- 2024: D+38.0 2020: D+45.3 2016: D+43.5 2012: D+33.7 2008: D+37.8
Not yet ingested
- Civics
- —
Market trends
- HPI YoY
- ▼ -477.30%
- Current HPI
- 309.3499
- Rent YoY
- ▲ 1.09%
- Metro
- San Francisco-Oakland-Berkeley, CA
- State GDP YoY
- ▲ 3.21%
- F500 in state
- 116
Industry mix (Fortune 500 HQ in CA)
| Industry | F500 HQs | Revenue |
|---|---|---|
| Technology | 27 | $1,492B |
|
||
| Financial Services | 3 | $174B |
|
||
| Retail | 3 | $44B |
|
||
| Insurance | 3 | $26B |
|
||
| Media / Entertainment | 2 | $115B |
|
||
| Pharmaceuticals / Biotech | 2 | $62B |
|
||
Price history
1 event — show timeline
- 2026-04-02 Listed $99,000 bridgeMLS, Bay East AOR, or Contra Costa AOR
Property tax history
-0.2%/yrLatest (2025): $140 · +4.1% YoY. Source: county tax records.
Cash-flow waterfall
monthlySold comps — $/sqft
last 12 mo · ≤1 miLoading sold comps…