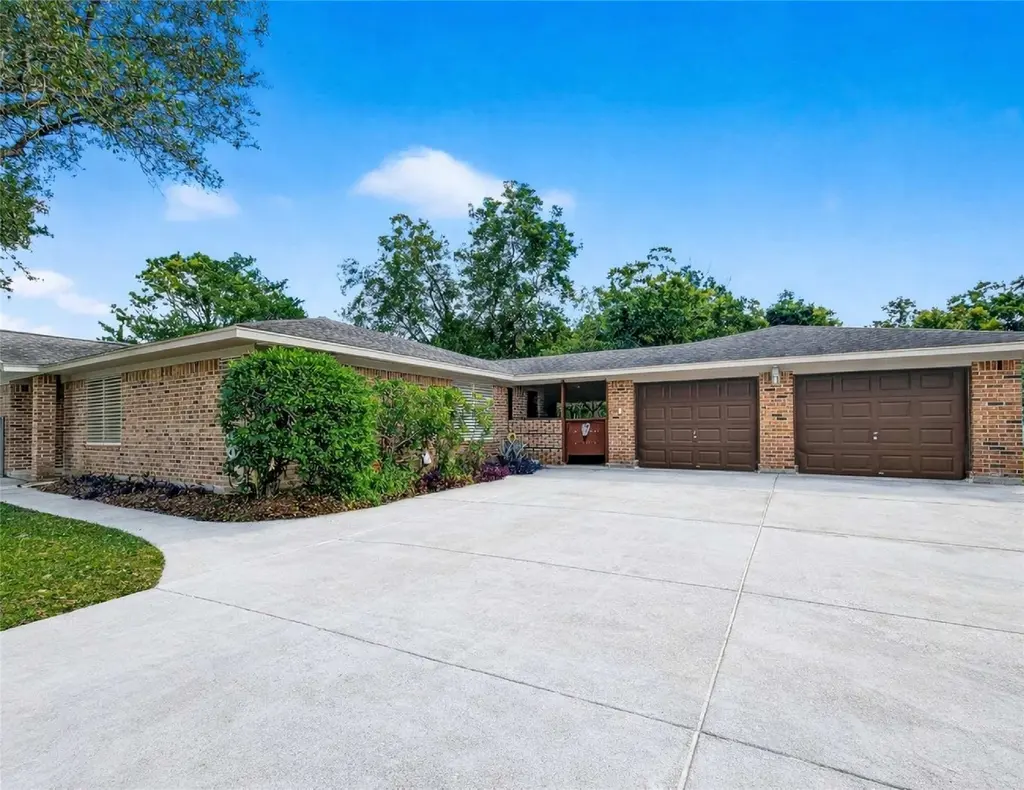
12021 7th 1/2 St · Santa Fe, TX
Flood risk 4/10 · Minor
- FEMA flood zone
- X (unshaded)
- Chance of flooding over 30 yrs
- 0.22%
- Est. flood insurance / yr
- $507 – $1,088
Fire risk 2/10 · Minimal
- Est. fire insurance / yr
- $1,222 – $2,270
Heat risk 10/10 · Severe
- Hot days now (above 110°F)
- 7 days/yr
- Hot days in 30 yrs
- 24 days/yr
Wind risk 9/10 · Severe
- Chance of severe wind over 30 yrs
- 99.0%
Air-quality risk 2/10 · Minimal
- Unhealthy air days now
- 1 days/yr
- Unhealthy air days in 30 yrs
- 1 days/yr
Risk factors via First Street. Map © Google.
Why this score? — see what drove the D grade
The composite is a weighted blend of 9 inputs, each scored 0–100. Each bar is that input's sub-score; the figure is the points it added to the 100-point composite (weight × sub-score).
- Cash flow +15.0/30.0
- ARV discount +7.5/15.0
- 1% rule +5.0/10.0
- DSCR +5.0/10.0
- Schools +3.5/10.0
- Livability +3.4/5.0
- Rent growth +2.5/5.0
- Condition / age +2.5/5.0
- Appreciation +0.0/10.0
$499,000
🖨 Deal sheet 📄 Offer letter ✓ Due diligence
Listing remarks
Tucked away on 2.32 tree-filled acres in Santa Fe, this 3-bedroom, 2-bath home offers a quiet, nostalgic kind of peace—the kind where squirrels play in the trees and evenings slow down. Surrounded by 50+ mature pecan and oak trees, the setting feels private, shaded, and timeless. Inside, the home features 1,950 sq ft of comfortable living space with thoughtful updates including a new HVAC system, insulation, and double-pane windows, keeping the home efficient year-round. A flex room adds space for a home office, study, or creative retreat, while a built-in wine fridge makes everyday moments feel special. A breezeway leads to a detached 2-car garage and 24x24 workshop, with a wide driv
Key facts
- Mature pecan trees
- Mature oak trees
- Flex room
Tags
Neighborhood map
What this means for you Summary
Snapshot
- This is a 3-bed/2.0-bath single-family listed at $499k.
Deal economics
- At list price, monthly cash flow is $21k ($254k/yr) — positive.
- The deal already cash-flows at list — no discount required.
- Meets the 1% rule at list price ($31k rent vs $499k).
- Recommended offer: $492k (1.5% below list) — sets the bar for market timing.
- Cap rate 57.1% vs local median 4.5% in Santa Fe — top-decile yield for the area; either an underpriced asset or a hidden risk that comps aren't pricing in. Stress-test before assuming the spread holds.
Location & tenants
- Location reads 67/100 on livability (#550 in TX) — a middle-class / working-renter tenant base. Strengths: crime A+, cost of living A+, housing A+; Watch: amenities F, commute F, health & safety F.
- Santa Fe ISD (suburban): math 38% / reading 39% proficiency, ranked #385 of 826 in TX (top 47%) — families likely to look elsewhere, expect single-tenant / working-renter base with shorter leases.
- Market conditions: 233 active listings in the ZIP; 2 comparable units currently listed for rent nearby; 3,258 units permitted in Galveston County in 2024 (0 in 5+ unit buildings).
Forward outlook
- Local home prices are declining (-3.0%/yr); year-one equity from $3k of loan paydown is wiped out by about $15k of value loss. Plan a longer hold.
- Galveston County population projected at +43% by 2050 — long-run rental-demand tailwind backs the buy-and-hold thesis.
- At projected returns (-3.0% appreciation + 3.0% rent growth), your $140k cash investment doubles in ~1 year — after that, you're playing with house money.
Negotiation context
- It's been on market 18 days — a 2% lower offer ($492k) is reasonable based on typical stale-listing flexibility.
- 2 sale attempts with the ask held roughly flat each time — persistent listings suggest the price (not the market) is what's stuck; bring a comps-based counter.
Risks & watch-outs
- Climate carrying-cost: severe wind risk, 99% chance of damaging wind over 30y; extreme-heat days projected 7→24/yr by 2055 (HVAC capex compounding) — expect insurance premiums to compound above CPI over the hold.
Questions for the listing agent
- Built in 1977 — when were the roof, HVAC, electrical panel, plumbing, and water heater last replaced?
- Is there a deadline driving the sale (1031 exchange, divorce, estate, relocation)? That informs how much negotiation room exists.
- The area grade is low — what's the realistic commute time and amenity access for the typical tenant pool here? Any planned neighborhood developments (good or bad) we should know about?
- What's the average days-on-market for RENTAL listings here right now (not sales)? A rising rental-DOM trend means longer vacancies and softer asking-rent achievability than the comps imply.
- What's the recent tenant-quality profile in this submarket — average credit score on applications, eviction rate, late-payment / NSF rate, and stable-employment percentage? A property-management company in the area should have these aggregated.
- How much new for-sale + rental construction is in the pipeline within 1–3 miles? Heavy new supply typically softens prices + rents 12–24 months out; constrained supply supports both.
Investment metrics
- 1% rule
- 6.26% ✓
- Cap rate
- 57.12%
- Cash-on-cash
- 181.54%
- DSCR
- 9.08
- GRM
- 1.3
CMA / ARV
- ARV (median comp)
- $313,754
- List price
- $499,000
- Delta
- 64.14%
- Verdict
- OVERPRICED
- Comps
- 20 within 1.0 mi
Show comp detail 12 sales within ~0.75 mi
| Address | Dist | Beds/Ba | Sqft | Sold | Price | $/sf | Match |
|---|---|---|---|---|---|---|---|
| 4018 Avenue L | 0.21mi | 3/2.0 | 1,948 (-0%) | 3mo | $359,000 | $184 | 88 |
| 12008 7th St | 0.13mi | 3/2.5 | 1,866 (-4%) | 9mo | $352,000 | $189 | 77 |
| 3826 Garden Hill Ln | 0.40mi | 3/2.0 | 1,904 (-2%) | 7mo | $332,990 | $175 | 72 |
| 3911 Redbud Ct | 0.30mi | 4/2.0 (+1) | 2,009 (+3%) | 8mo | $360,000 | $179 | 69 |
| 12026 Crooked Creek Ln | 0.56mi | 3/2.0 | 2,009 (+3%) | 2mo | $345,096 | $172 | 67 |
| 12418 A Bar Dr | 0.48mi | 3/2.0 | 2,054 (+5%) | 3mo | $284,900 | $139 | 66 |
| 12546 D Bar Dr | 0.58mi | 3/2.0 | 1,933 (-1%) | 7mo | $309,999 | $160 | 66 |
| 12131 Wooden Mill Ln N | 0.52mi | 3/2.0 | 2,009 (+3%) | 7mo | $330,000 | $164 | 65 |
| 12122 Blossom Dr | 0.33mi | 4/3.0 (+1) | 2,051 (+5%) | 4mo | $342,990 | $167 | 64 |
| 12106 Maple Ct | 0.37mi | 4/3.0 (+1) | 2,051 (+5%) | 8mo | $342,990 | $167 | 58 |
| 3859 Mulberry Farms Dr | 0.32mi | 4/3.0 (+1) | 2,140 (+10%) | 2mo | $387,840 | $181 | 58 |
| 3818 Garden Hill Ln | 0.42mi | 4/3.0 (+1) | 2,140 (+10%) | 4mo | $346,990 | $162 | 52 |
Match score weights: distance 35% · size 25% · config 20% · recency 20%. Top-matched comps best support the ARV.
Projected returns pro-forma
-3.0% appreciation · 3.0% rent growth · sell at horizon
- IRR
- —
- Equity multiple
- 10.06×
- Total profit
- $1,265,924
- Equity at exit
- $74,403
- IRR
- —
- Equity multiple
- 21.31×
- Total profit
- $2,837,996
- Equity at exit
- $43,144
Cash invested: $139,720 (down + closing). Projections, not guarantees.
Landlord ↔ Tenant lean methodology
- Overall (STATE)
- 87 Strongly Landlord-Friendly
- State Texas
- 87 Strongly Landlord-Friendly · R+5
- County
- — inherits STATE
- City
- — inherits STATE
ZIP-level market 77510
- Home prices YoY
- -15.3%
- Active inventory
- 233
- Price-to-rent
- 1.3×
Monthly cashflow live
- Estimated rent
- $31,229 medium interval (Pro) →
- Mortgage (P&I)
- −$2,617
- Tax from tax record
- −$709 /mo · $8,509/yr
- Insurance
- −$208
- HOA
- −$0
- Vacancy / Maint / Mgmt
- −$6,558
- Net cashflow
- $21,138
Break-even live
UW: 25.0% down · 7.5% · 30yr · 1.5% tax · 5.0% vac · 8.0% maint · 8.0% mgmt
Financing live
Cash to close
- Down payment
- $124,750
- Closing costs
- $14,970
- Reserves months
- —
- Total cash needed
- —
Loan-product check · same deal, 3 products live
Conventional
25% down · 7.5% · 30yr
- Down + closing
- —
- Monthly P&I
- —
- Monthly cashflow
- —
- DSCR
- —
- Eligible?
- —
Personal DTI + credit; lowest rate.
DSCR
20% down · 8.5% · 30yr
- Down + closing
- —
- Monthly P&I
- —
- Monthly cashflow
- —
- DSCR
- —
- Eligible?
- —
No personal income docs; deal must DSCR.
Hard money
10% down · 12.0% · 12mo
- Down + closing
- —
- Monthly P&I
- —
- Monthly cashflow
- —
- DSCR
- —
- Eligible?
- —
Short-term bridge; refi at stabilization.
Rent comps 2 comps
| Address | Beds | Baths | Sqft | Rent | $/sqft | DOM | Units | Dist |
|---|---|---|---|---|---|---|---|---|
| 11844 13th St Santa Fe, TX | 3.0 | 2.0 | 1472 | $1,750 | $1.19 | 21d | 1 | 0.56mi |
| 4120 Avenue O #10 Santa Fe, TX | 3.0 | 2.0 | 1280 | $74,621 | $58.30 | 43d | 1 | 0.72mi |
Listing history 17 events
-
2026-06-18days on market $499,000 Active 18 DOM
-
2026-06-17days on market $499,000 Active 17 DOM
-
2026-06-16days on market $499,000 Active 16 DOM
-
2026-06-15days on market $499,000 Active 15 DOM
-
2026-06-13days on market $499,000 Active 13 DOM
-
2026-06-09days on market $499,000 Active 9 DOM
-
2026-06-08days on market $499,000 Active 8 DOM
-
2026-06-07days on market $499,000 Active 7 DOM
-
2026-06-04days on market $499,000 Active 4 DOM
-
2026-06-03days on market $499,000 Active 3 DOM
-
2026-06-02days on market $499,000 Active 2 DOM
-
2026-06-01pricestatusdays on market $499,000 Active 1 DOM
-
2026-05-19historical
-
2026-04-22price $515,000
-
2026-02-06$525,000 Active
-
2026-02-06historical
-
2025-10-17$550,000 Active
ⓘ Source: listings_history table (triggers on properties + properties_extension) + one-shot
backfill from property_details.listing_events for pre-trigger history.
Tax reassessment forecast TX · Resets to sale price
- Current annual tax
- $8,509 · $709/mo
- Projected year-2 tax
- $9,132 · $761/mo
- Expected delta
- +$623/yr (+$52/mo · 7.3%)
ⓘ Screening estimate from a state-policy table — verify with the county assessor before closing.
Climate risk First Street
- Flood 4/10 Moderate FEMA zone X (unshaded) · 22% chance over 30 yrs
- Wildfire 2/10 Low
- Heat 10/10 Extreme 7 d/yr ≥110°F today · 24 d/yr by 30 yrs out
- Wind 9/10 Extreme 99% chance of damaging wind over 30 yrs
- Air quality 2/10 Low 1 unhealthy d/yr today · 1 by 30 yrs out
Nearby sold comps map
Loading sold comps map…
Walkable amenities ~0.75 mi
Loading nearby amenities…
Taxation est. · year 1
- Rental income
- $374,754
- − Mortgage interest
- −$27,952
- − Property taxes
- −$8,509
- − Insurance
- −$2,495
- − Repairs & maintenance
- −$29,980
- − Management
- −$29,980
- − Depreciation
- −$14,516
- Taxable income
- $261,322
- Est. tax owed @ 24.0%
- −$62,717
- After-tax cash flow
- $190,933/yr
For passive investors: Depreciation is non-cash, so a rental often shows a tax loss while cash-flowing — sheltering income. Rental losses are passive: they offset passive income freely, and up to $25,000/yr can offset ordinary (W-2) income if you actively participate and your MAGI is under $100k (phasing out to $0 by $150k); unused losses carry forward. On sale, claimed depreciation is recaptured at up to 25%, and gains may owe capital-gains tax (a 1031 exchange can defer both). Figures are a year-1 estimate at your 24.0% rate — not tax advice; consult a CPA.
Schools (NCES district)
- District
- Santa Fe ISD
- NCES district ID
- 4839270
- Math proficiency
- 38% ▼ -10.00%
- Reading proficiency
- 39% ▼ -2.00%
- Median HH income
- $66,769
- Composite
- 34.86/100
- National rank
- #5091
- State rank
- #385 of 826 in TX
Livability — Santa Fe
- Score
- 67/100
- State rank
- #550
- US rank
- #10637
Category grades
Schools grade is shown separately in the Schools card above.
Census & demographics
- Census place
- Santa Fe, TX
- Population (ZIP)
- 13,938
Population outlook (Galveston County) Hauer SSP2
- Today (2025)
- 390,640 people
- By 2030
- 425,226 · +8.9%
- By 2040
- 493,765 · +26.4%
- By 2050
- 559,698 · +43.3%
- By 2075
- 719,260 · +84.1%
- By 2100
- 819,628 · +109.8%
Race, ethnicity, and origin ACS 2023
- Neighborhood character
- Predominantly White (72%)
- Race & ethnicity
- White 72% Hispanic / Latino 21% Two or more races 17% Asian 2%
- Hispanic origin (detail)
- Mexican 14% Puerto Rican 3% Cuban 1%
- Common ancestry
- Lithuanian 4% Italian 3% Slovak 1%
- Foreign-born
- 5% · Canada
- Languages at home
- 89% English-only · Spanish 10% Tagalog/Filipino 1%
Political lean MEDSL · Galveston
- 2024 margin
- Strong R (+27.4) · D 35.7% · R 63.1% · Other 1.2%
- 2008→2024 swing
- -7.9pp toward R · 2008: -19.5pp · 2024: -27.4pp
- All cycles
- 2024: R+27.4 2020: R+22.6 2016: R+22.6 2012: R+26.9 2008: R+19.5
Not yet ingested
- Civics
- —
Market trends
- HPI YoY
- ▼ -54.15%
- Current HPI
- 299.2228
- Rent YoY
- —
- Metro
- —
- State GDP YoY
- ▲ 3.95%
- F500 in state
- 110
Industry mix (Fortune 500 HQ in TX)
| Industry | F500 HQs | Revenue |
|---|---|---|
| Energy | 16 | $1,198B |
|
||
| Technology | 5 | $198B |
|
||
| Engineering / Construction | 4 | $72B |
|
||
| Energy Services | 3 | $60B |
|
||
| Utilities | 3 | $41B |
|
||
| Healthcare | 2 | $330B |
|
||
Price history
-6.4% since first listed5 events — show timeline
- 2026-05-19 Listing Removed — HARMLS
- 2026-04-22 Price Changed $515,000 HARMLS
- 2026-02-06 Listing Removed — HARMLS
- 2026-02-06 Listed $525,000 HARMLS
- 2025-10-17 Listed $550,000 HARMLS
Property tax history
+6.2%/yrLatest (2025): $8,509 · -1.3% YoY. Source: county tax records.
Cash-flow waterfall
monthlySold comps — $/sqft
last 12 mo · ≤1 miLoading sold comps…