1421 S 11th St #118 · Port Aransas, TX
Flood risk No data
- FEMA flood zone
- —
- Chance of flooding over 30 yrs
- —
- Est. flood insurance / yr
- —
Fire risk No data
- Est. fire insurance / yr
- —
Heat risk No data
- Hot days now (above threshold)
- —
- Hot days in 30 yrs
- —
Wind risk No data
- Chance of severe wind over 30 yrs
- —
Air-quality risk No data
- Unhealthy air days now
- —
- Unhealthy air days in 30 yrs
- —
Risk factors via First Street. Map © Google.
Why this score? — see what drove the D grade
The composite is a weighted blend of 9 inputs, each scored 0–100. Each bar is that input's sub-score; the figure is the points it added to the 100-point composite (weight × sub-score).
- Cash flow +11.9/30.0
- ARV discount +7.5/15.0
- Schools +5.1/10.0
- 1% rule +4.7/10.0
- DSCR +3.5/10.0
- Livability +3.4/5.0
- Rent growth +2.5/5.0
- Condition / age +2.5/5.0
- Appreciation +0.0/10.0
$279,000
🖨 Deal sheet 📄 Offer letter ✓ Due diligence
Listing remarks MLS
Entered for Comp Purposes Only.
Key facts
- Community pool
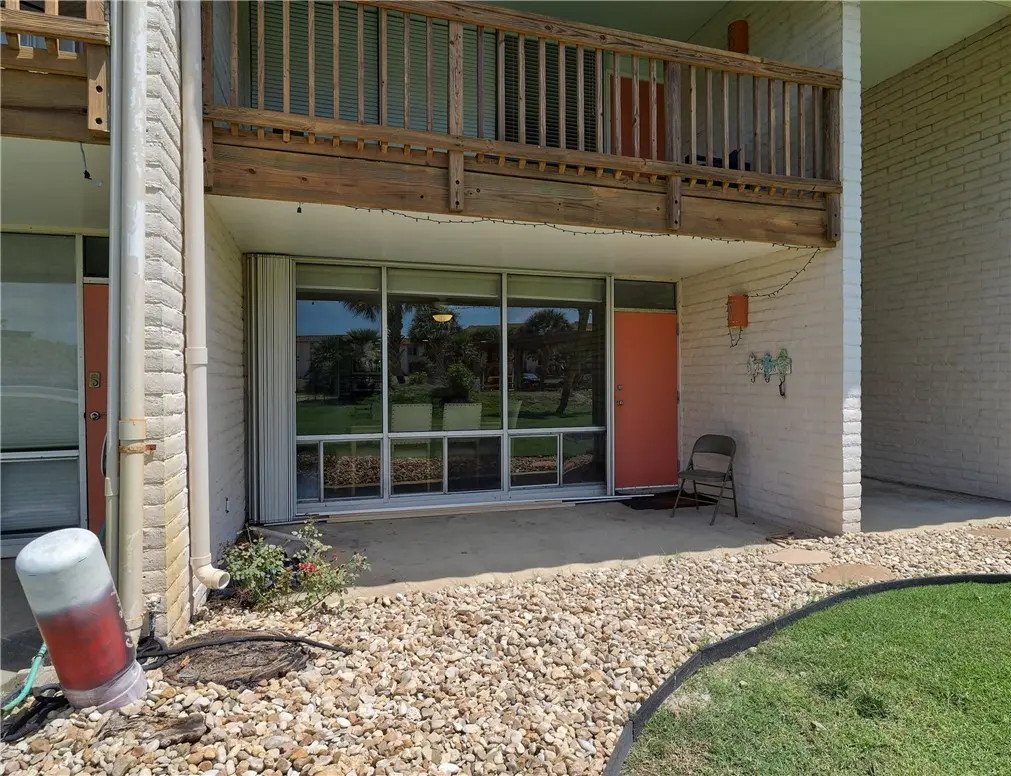
- Ground floor
- Open floorplan
Tags
Property features AI
Finance
- HOA & community: Homeowners association with a $375 monthly fee; HOA covers common areas, cable TV, grounds maintenance, structure maintenance, trash, and water; Community amenities include beach access, beach rights, and a pool; Short-term rentals allowed
Exterior
- Parking: Concrete front-entry parking
- Utilities: Municipal utilities
- Home design: Single-story; Brick construction; Shingle roof; Slab foundation
- Construction: Brick exterior
- Exterior features: Landscaped yard; Covered patio
Interior
- Kitchen: Dishwasher; Electric oven; Electric range; Garbage disposal; Microwave
- Bedrooms: One common wall (adjoins another unit)
- Flooring: Tile
- Bathrooms: 2 full bathrooms
- Heating & cooling: Central heating (electric); Central air conditioning
- Interior features: Window coverings; Window treatments; Breakfast bar
- Laundry & utility: Washer; Dryer
Neighborhood map
What this means for you Summary
Snapshot
- This is a 2-bed/2.0-bath condo listed at $279k.
Deal economics
- At list price, monthly cash flow is $-71 ($-855/yr) — negative.
- To cash-flow at today's rent, offer at most $266k (4.5% below list).
- To meet the 1% rule (rent ≥ 1% of price), the offer needs to be $271k (2.9% below list).
- Recommended offer: $266k (4.5% below list) — sets the bar for cash-flow.
- Cap rate 6.0% vs local median 1.1% in Port Aransas — top-decile yield for the area; either an underpriced asset or a hidden risk that comps aren't pricing in. Stress-test before assuming the spread holds.
Location & tenants
- Location reads 67/100 on livability (#525 in TX) — a middle-class / working-renter tenant base. Strengths: housing A+, employment A, schools A-; Watch: commute C-, crime F, amenities F.
- Port Aransas ISD (rural): math 57% / reading 63% proficiency, ranked #68 of 826 in TX (top 8%) — acceptable for families but not a draw, mixed tenant base, ~2y average lease.
- Market conditions: 1012 active listings in the ZIP; 5 comparable units currently listed for rent nearby; rentals at typical pace (median 14d on market — plan ~3-4 weeks tenant-placement turnaround); 40% of comp listings sitting > 30 days — soft ceiling on asking rent; 1,397 units permitted in Nueces County in 2024 (47 in 5+ unit buildings).
Forward outlook
- Local home prices are declining (-3.0%/yr); year-one equity from $2k of loan paydown is wiped out by about $8k of value loss. Plan a longer hold.
- Nueces County population projected at +36% by 2050 — long-run rental-demand tailwind backs the buy-and-hold thesis.
Negotiation context
- It's been on market 25 days — a 2% lower offer ($275k) is reasonable based on typical stale-listing flexibility.
- 4 sale attempts since 15y ago with the ask held roughly flat each time — persistent listings suggest the price (not the market) is what's stuck; bring a comps-based counter.
- Current owner paid $64k; list at $279k implies a 339% gain — meaningful room to come down on a strong offer.
Questions for the listing agent
- What do current leases actually rent for vs. the listed asking? Can we see a recent rent roll and the last 12 months of T-12 income?
- Built in 1979 — when were the roof, HVAC, electrical panel, plumbing, and water heater last replaced?
- What does the HOA fee cover, when was the last increase, and are there any pending special assessments or reserve-fund shortfalls?
- Any open or pending special assessments — roof, HVAC, plumbing, elevator, façade? What's the per-unit balance and payoff schedule, and is the seller paying it off at close or rolling it to the buyer?
- Is there a deadline driving the sale (1031 exchange, divorce, estate, relocation)? That informs how much negotiation room exists.
- Schools are A-rated — typically a magnet for longer-tenancy family renters. What's the average tenant stay here, and is there a school-zone premium baked into asking?
- Crime grade is F in this area — have there been break-ins, vandalism, or insurance claims at this property in the last 3 years? What carrier currently insures it and at what premium?
- The area grade is low — what's the realistic commute time and amenity access for the typical tenant pool here? Any planned neighborhood developments (good or bad) we should know about?
- What's the average days-on-market for RENTAL listings here right now (not sales)? A rising rental-DOM trend means longer vacancies and softer asking-rent achievability than the comps imply.
- What's the recent tenant-quality profile in this submarket — average credit score on applications, eviction rate, late-payment / NSF rate, and stable-employment percentage? A property-management company in the area should have these aggregated.
- How much new apartment / multifamily construction is in the pipeline within 1–3 miles? Heavy new supply (>2% of stock underway) typically softens rents 12–24 months out; light construction supports rent growth.
Investment metrics
- 1% rule
- 0.97% ✗
- Cap rate
- 5.99%
- Cash-on-cash
- -1.09%
- DSCR
- 0.95
- GRM
- 8.6
CMA / ARV
No comps found within radius.
Projected returns pro-forma
-3.0% appreciation · 3.0% rent growth · sell at horizon
- IRR
- -18.0%
- Equity multiple
- 0.37×
- Total profit
- $-49,533
- Equity at exit
- $41,600
- IRR
- -10.0%
- Equity multiple
- 0.38×
- Total profit
- $-48,104
- Equity at exit
- $24,123
Cash invested: $78,120 (down + closing). Projections, not guarantees.
Landlord ↔ Tenant lean methodology
- Overall (STATE)
- 87 Strongly Landlord-Friendly
- State Texas
- 87 Strongly Landlord-Friendly · R+5
- County
- — inherits STATE
- City
- — inherits STATE
ZIP-level market 78373
- Active inventory
- 1012
- Price-to-rent
- 8.6×
Monthly cashflow live
- Estimated rent
- $2,708 high interval (Pro) →
- Mortgage (P&I)
- −$1,463
- Tax from tax record
- −$256 /mo · $3,078/yr
- Insurance
- −$116
- HOA
- −$375
- Vacancy / Maint / Mgmt
- −$569
- Net cashflow
- $-71
Break-even live
UW: 25.0% down · 7.5% · 30yr · 1.5% tax · 5.0% vac · 8.0% maint · 8.0% mgmt
Financing live
Cash to close
- Down payment
- $69,750
- Closing costs
- $8,370
- Reserves months
- —
- Total cash needed
- —
Loan-product check · same deal, 3 products live
Conventional
25% down · 7.5% · 30yr
- Down + closing
- —
- Monthly P&I
- —
- Monthly cashflow
- —
- DSCR
- —
- Eligible?
- —
Personal DTI + credit; lowest rate.
DSCR
20% down · 8.5% · 30yr
- Down + closing
- —
- Monthly P&I
- —
- Monthly cashflow
- —
- DSCR
- —
- Eligible?
- —
No personal income docs; deal must DSCR.
Hard money
10% down · 12.0% · 12mo
- Down + closing
- —
- Monthly P&I
- —
- Monthly cashflow
- —
- DSCR
- —
- Eligible?
- —
Short-term bridge; refi at stabilization.
Rent comps 5 comps
| Address | Beds | Baths | Sqft | Rent | $/sqft | DOM | Units | Dist |
|---|---|---|---|---|---|---|---|---|
| 328 Sea Isle Dr Unit A Port Aransas, TX | 2.0 | 1.0 | 1040 | $2,200 | $2.12 | 14d | 1 | 0.74mi |
| 321 Seventh St Unit A Port Aransas, TX | 2.0 | 1.0 | 1344 | $2,775 | $2.06 | 14d | 1 | 0.84mi |
| 321 Seventh St Unit B Port Aransas, TX | 1.0 | 1.0 | 1344 | $1,775 | $1.32 | 14d | 1 | 0.84mi |
| 519 West Avenue C Unit B Port Aransas, TX | 3.0 | 3.0 | 1427 | $3,500 | $2.45 | 44d | 1 | 0.95mi |
| 200 W Cotter Ave Port Aransas, TX | 2.0 | 2.0 | 1230 | $4,000 | $3.25 | 44d | 1 | 1.25mi |
HOA detail condo
- Monthly dues
- $375 · $4,500/yr
- Assessments
- None detected in remarks — confirm with the listing agent.
Listing history 25 events
-
2026-06-18days on market $279,000 Active 25 DOM
-
2026-06-17days on market $279,000 Active 24 DOM
-
2026-06-16days on market $279,000 Active 23 DOM
-
2026-06-15days on market $279,000 Active 22 DOM
-
2026-06-14days on market $279,000 Active 20 DOM
-
2026-06-13days on market $279,000 Active 19 DOM
-
2026-06-10days on market $279,000 Active 17 DOM
-
2026-06-09days on market $279,000 Active 16 DOM
-
2026-06-08days on market $279,000 Active 15 DOM
-
2026-06-07days on market $279,000 Active 14 DOM
-
2026-06-03days on market $279,000 Active 10 DOM
-
2026-06-02days on market $279,000 Active 9 DOM
-
2026-06-01days on market $279,000 Active 8 DOM
-
2026-05-31days on market $279,000 Active 7 DOM
-
2026-05-30days on market $279,000 Active 6 DOM
-
2026-05-24$279,000 Active
-
2024-03-12soldstatus
-
2017-04-28historical 31-char remark
Show marketing remark (31 chars)
Entered for Comp Purposes Only.
-
2017-04-28$181,000 Active 31-char remark
Show marketing remark (31 chars)
Entered for Comp Purposes Only.
-
2017-04-28soldstatus Closed 31-char remark
Show marketing remark (31 chars)
Entered for Comp Purposes Only.
-
2014-10-19$164,000
-
2012-11-13soldstatus
-
2012-11-09soldstatus
-
2011-11-18$144,000
-
2000-04-07soldstatus $63,500
ⓘ Source: listings_history table (triggers on properties + properties_extension) + one-shot
backfill from property_details.listing_events for pre-trigger history.
Tax reassessment forecast TX · Resets to sale price
- Current annual tax
- $3,078 · $256/mo
- Projected year-2 tax
- $5,106 · $425/mo
- Expected delta
- +$2,028/yr (+$169/mo · 65.9%)
ⓘ Screening estimate from a state-policy table — verify with the county assessor before closing.
Nearby sold comps map
Loading sold comps map…
Walkable amenities ~0.75 mi
Loading nearby amenities…
Taxation est. · year 1
- Rental income
- $32,500
- − Mortgage interest
- −$15,628
- − Property taxes
- −$3,078
- − Insurance
- −$1,395
- − Repairs & maintenance
- −$2,600
- − Management
- −$2,600
- − HOA
- −$4,500
- − Depreciation
- −$8,116
- Taxable loss
- −$5,417
- Est. tax savings @ 24.0%
- +$1,300
- After-tax cash flow
- $445/yr
For passive investors: Depreciation is non-cash, so a rental often shows a tax loss while cash-flowing — sheltering income. Rental losses are passive: they offset passive income freely, and up to $25,000/yr can offset ordinary (W-2) income if you actively participate and your MAGI is under $100k (phasing out to $0 by $150k); unused losses carry forward. On sale, claimed depreciation is recaptured at up to 25%, and gains may owe capital-gains tax (a 1031 exchange can defer both). Figures are a year-1 estimate at your 24.0% rate — not tax advice; consult a CPA.
Schools (NCES district)
- District
- Port Aransas ISD
- NCES district ID
- 4835370
- Math proficiency
- 57% ▼ -9.00%
- Reading proficiency
- 63% ▼ -2.00%
- Median HH income
- $47,528
- Composite
- 50.82/100
- National rank
- #1803
- State rank
- #68 of 826 in TX
Livability — Port Aransas
- Score
- 67/100
- State rank
- #525
- US rank
- #10286
Category grades
Schools grade is shown separately in the Schools card above.
Census & demographics
- Census place
- Port Aransas, TX
- Population (ZIP)
- 3,314
Population outlook (Nueces County) Hauer SSP2
- Today (2025)
- 418,037 people
- By 2030
- 447,123 · +7.0%
- By 2040
- 505,911 · +21.0%
- By 2050
- 567,522 · +35.8%
- By 2075
- 729,686 · +74.6%
- By 2100
- 847,087 · +102.6%
Race, ethnicity, and origin ACS 2023
- Neighborhood character
- Predominantly White (87%)
- Race & ethnicity
- White 87% Two or more races 9% Hispanic / Latino 4%
- Common ancestry
- Serbian 2% Slovak 2% Iranian 2%
- Foreign-born
- 8% · Canada
- Languages at home
- 92% English-only · Other Indo-European 4% Spanish 3%
Political lean MEDSL · Nueces
- 2024 margin
- R (+11.5) · D 43.8% · R 55.3%
- 2008→2024 swing
- -7.1pp toward R · 2008: -4.4pp · 2024: -11.5pp
- All cycles
- 2024: R+11.5 2020: R+2.9 2016: R+1.5 2012: R+3.2 2008: R+4.4
Not yet ingested
- Civics
- —
Market trends
- HPI YoY
- ▼ -205.54%
- Current HPI
- 268.699
- Rent YoY
- —
- Metro
- —
- State GDP YoY
- ▲ 3.95%
- F500 in state
- 110
Industry mix (Fortune 500 HQ in TX)
| Industry | F500 HQs | Revenue |
|---|---|---|
| Energy | 16 | $1,198B |
|
||
| Technology | 5 | $198B |
|
||
| Engineering / Construction | 4 | $72B |
|
||
| Energy Services | 3 | $60B |
|
||
| Utilities | 3 | $41B |
|
||
| Healthcare | 2 | $330B |
|
||
Price history
+339.4% since first listed10 events — show timeline
- 2026-05-24 Listed $279,000 CBMLS
- 2024-03-12 Sold (Public Records) — Public Records
- 2017-04-28 Delisted — CBMLS
- 2017-04-28 Listed $181,000 CBMLS
- 2017-04-28 Sold (MLS) — CBMLS
- 2014-10-19 Listed $164,000 CBMLS
- 2012-11-13 Sold (Public Records) — Public Records
- 2012-11-09 Sold (MLS) — CBMLS
- 2011-11-18 Listed $144,000 CBMLS
- 2000-04-07 Sold (Public Records) $63,500 Public Records
Property tax history
+2.2%/yrLatest (2025): $3,078 · -27.8% YoY. Source: county tax records.
Cash-flow waterfall
monthlySold comps — $/sqft
last 12 mo · ≤1 miLoading sold comps…