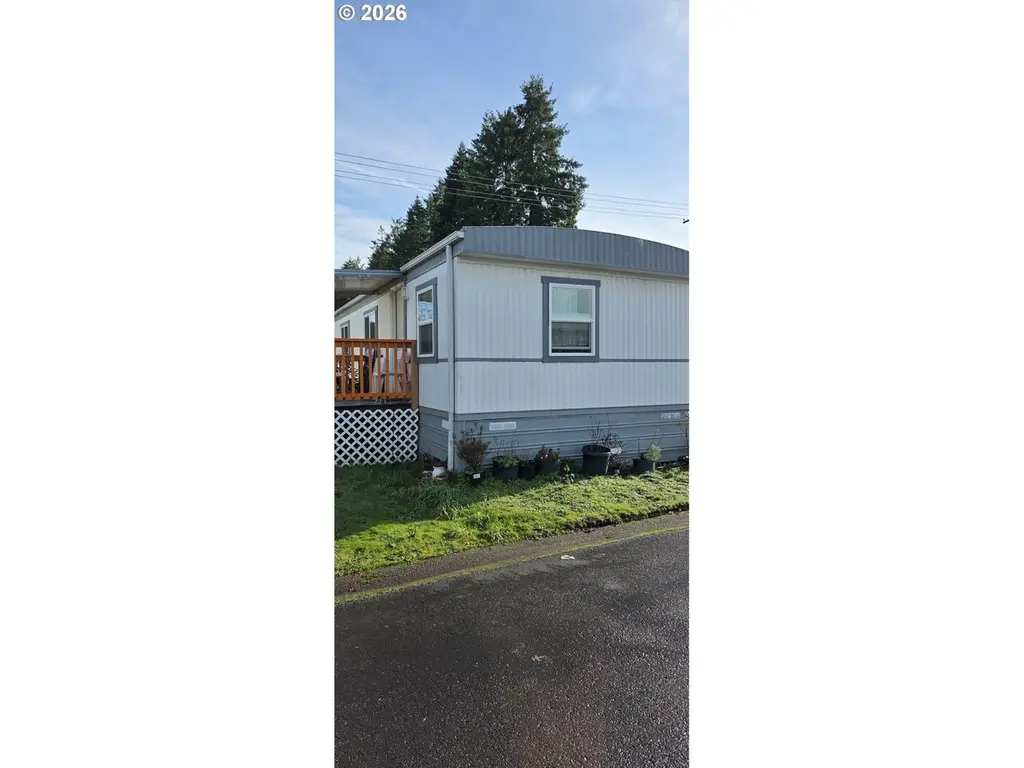
5335 Main #154 · Springfield, OR
Flood risk 1/10 · Minimal
- FEMA flood zone
- X (unshaded)
- Chance of flooding over 30 yrs
- 0.0%
- Est. flood insurance / yr
- $507 – $1,088
Fire risk 5/10 · Moderate
- Est. fire insurance / yr
- $498 – $926
Heat risk 4/10 · Minor
- Hot days now (above 91°F)
- 7 days/yr
- Hot days in 30 yrs
- 15 days/yr
Wind risk 1/10 · Minimal
- Chance of severe wind over 30 yrs
- —
Air-quality risk 10/10 · Severe
- Unhealthy air days now
- 13 days/yr
- Unhealthy air days in 30 yrs
- 15 days/yr
Risk factors via First Street. Map © Google.
Why this score? — see what drove the C- grade
The composite is a weighted blend of 9 inputs, each scored 0–100. Each bar is that input's sub-score; the figure is the points it added to the 100-point composite (weight × sub-score).
- Cash flow +15.0/30.0
- ARV discount +15.0/15.0
- 1% rule +5.0/10.0
- DSCR +5.0/10.0
- Livability +4.2/5.0
- Rent growth +3.3/5.0
- Condition / age +2.5/5.0
- Schools +2.4/10.0
- Appreciation +0.0/10.0
$25,000
🖨 Deal sheet 📄 Offer letter ✓ Due diligence
Listing remarks MLS
2 Bed, 1 Bath manufactured home in quiet 55+ park. Buyers must be approved by Park management prior to purchase. Recently floor updated in kitchen. All appliances (Including washer and dryer ) in As-Is condition, included with full-price offer.
Key facts
- Updated kitchen
- Garage
- Community pool
Tags
Neighborhood map
What this means for you Summary
Snapshot
- This is a 2-bed/1.0-bath manufactured listed at $25k.
Deal economics
- At list price, monthly cash flow is $1k ($12k/yr) — positive.
- The deal already cash-flows at list — no discount required.
- Meets the 1% rule at list price ($2k rent vs $25k).
- Recommended offer: $22k (12.0% below list) — sets the bar for market timing.
- Cap rate 55.8% vs local median 3.0% in Springfield — top-decile yield for the area; either an underpriced asset or a hidden risk that comps aren't pricing in. Stress-test before assuming the spread holds.
Location & tenants
- Location reads 83/100 on livability (#40 in OR, #934 nationally) — a professional / high-income tenant draw. Strengths: amenities A+, commute A+, housing A+; Watch: schools D+, crime D+, employment D+.
- Springfield SD 19 (suburban): math 19% / reading 38% proficiency, ranked #48 of 58 in OR (top 83%) — low school quality limits family demand, transient renter base, plan for 1-2y turnover.
- Market conditions: Rents rising (+3.4%/yr); 263 active listings in the ZIP; 1 comparable units currently listed for rent nearby; solid renter incomes; 1,808 units permitted in Lane County in 2024 (972 in 5+ unit buildings).
Forward outlook
- Local home prices are declining (-3.0%/yr); year-one equity from $173 of loan paydown is wiped out by about $750 of value loss. Plan a longer hold.
- Lane County population projected at +15% by 2050 — long-run rental-demand tailwind backs the buy-and-hold thesis.
- At projected returns (-3.0% appreciation + 3.4% rent growth), your $7k cash investment doubles in ~1 year — after that, you're playing with house money.
Negotiation context
- It's been on market 146 days — a 12% lower offer ($22k) is reasonable based on typical stale-listing flexibility.
Risks & watch-outs
- Climate carrying-cost: moderate wildfire risk — expect insurance premiums to compound above CPI over the hold.
Questions for the listing agent
- It's been on market 146 days. Have you received any prior offers? Is the seller open to a 12% concession, seller financing, or rate buy-down credit?
- Why hasn't it sold? Are there any deal-killer items the seller is aware of (foundation, flood, title, zoning, code violations)?
- Is there a deadline driving the sale (1031 exchange, divorce, estate, relocation)? That informs how much negotiation room exists.
- Schools are D-rated, which usually means shorter tenancies and higher turnover. Who's the typical renter profile here, and what's been the actual vacancy rate?
- Crime grade is D in this area — have there been break-ins, vandalism, or insurance claims at this property in the last 3 years? What carrier currently insures it and at what premium?
- What's the average days-on-market for RENTAL listings here right now (not sales)? A rising rental-DOM trend means longer vacancies and softer asking-rent achievability than the comps imply.
- What's the recent tenant-quality profile in this submarket — average credit score on applications, eviction rate, late-payment / NSF rate, and stable-employment percentage? A property-management company in the area should have these aggregated.
- How much new for-sale + rental construction is in the pipeline within 1–3 miles? Heavy new supply typically softens prices + rents 12–24 months out; constrained supply supports both.
Investment metrics
- 1% rule
- 6.03% ✓
- Cap rate
- 55.82%
- Cash-on-cash
- 176.88%
- DSCR
- 8.87
- GRM
- 1.4
CMA / ARV
- ARV (median comp)
- $39,018
- List price
- $25,000
- Delta
- -35.93%
- Verdict
- UNDERPRICED
- Comps
- 10 within 1.0 mi
Show comp detail 12 sales within ~0.75 mi
| Address | Dist | Beds/Ba | Sqft | Sold | Price | $/sf | Match |
|---|---|---|---|---|---|---|---|
| 5335 Main St #34 | 0.00mi | 2/1.0 | 728 (0%) | 0mo | $29,900 | $41 | 100 |
| 205 S 54th St #108 | 0.16mi | 2/1.0 | 728 (0%) | 7mo | $60,000 | $82 | 86 |
| 5335 Main St #187 | 0.00mi | 2/1.0 | 784 (+8%) | 2mo | $55,000 | $70 | 86 |
| 5335 Main St #187 | 0.08mi | 2/1.0 | 746 (+2%) | 19mo | $60,000 | $80 | 76 |
| 205 S 54th St #108 | 0.08mi | 2/1.0 | 710 (-2%) | 23mo | $60,900 | $86 | 73 |
| 205 S 54th St | 0.15mi | 2/1.0 | 672 (-8%) | 13mo | $31,400 | $47 | 70 |
| 205 S 54th St #107 | 0.16mi | 2/1.0 | 768 (+6%) | 17mo | $11,500 | $15 | 69 |
| 205 S 54th St #117 | 0.16mi | 2/2.0 | 800 (+10%) | 8mo | $9,000 | $11 | 66 |
| 205 S 54th St #60 | 0.16mi | 2/1.0 | 784 (+8%) | 17mo | $22,500 | $29 | 65 |
| 5335 Daisy St #58 | 0.28mi | 2/1.0 | 784 (+8%) | 14mo | $57,000 | $73 | 62 |
| 5335 Daisy St #130 | 0.21mi | 3/1.0 (+1) | 672 (-8%) | 12mo | $20,000 | $30 | 62 |
| 658 S 57 Th st Space 67 | 0.33mi | 2/1.0 | 830 (+14%) | 18mo | $44,000 | $53 | 46 |
Match score weights: distance 35% · size 25% · config 20% · recency 20%. Top-matched comps best support the ARV.
Projected returns pro-forma
-3.0% appreciation · 3.38% rent growth · sell at horizon
- IRR
- —
- Equity multiple
- 9.89×
- Total profit
- $62,256
- Equity at exit
- $3,728
- IRR
- —
- Equity multiple
- 21.18×
- Total profit
- $141,276
- Equity at exit
- $2,162
Cash invested: $7,000 (down + closing). Projections, not guarantees.
Landlord ↔ Tenant lean methodology
- Overall (STATE)
- 28 Tenant-Leaning
- State Oregon
- 28 Tenant-Leaning · D+6
- County
- — inherits STATE
- City
- — inherits STATE
ZIP-level market 97478
- Rents YoY
- 3.4%
- Active inventory
- 263
- Price-to-rent
- 1.4×
Monthly cashflow live
- Estimated rent
- $1,506 medium interval (Pro) →
- Mortgage (P&I)
- −$131
- Tax from tax record
- −$17 /mo · $200/yr
- Insurance
- −$10
- HOA
- −$0
- Vacancy / Maint / Mgmt
- −$316
- Net cashflow
- $1,032
Break-even live
UW: 25.0% down · 7.5% · 30yr · 1.5% tax · 5.0% vac · 8.0% maint · 8.0% mgmt
Financing live
Cash to close
- Down payment
- $6,250
- Closing costs
- $750
- Reserves months
- —
- Total cash needed
- —
Loan-product check · same deal, 3 products live
Conventional
25% down · 7.5% · 30yr
- Down + closing
- —
- Monthly P&I
- —
- Monthly cashflow
- —
- DSCR
- —
- Eligible?
- —
Personal DTI + credit; lowest rate.
DSCR
20% down · 8.5% · 30yr
- Down + closing
- —
- Monthly P&I
- —
- Monthly cashflow
- —
- DSCR
- —
- Eligible?
- —
No personal income docs; deal must DSCR.
Hard money
10% down · 12.0% · 12mo
- Down + closing
- —
- Monthly P&I
- —
- Monthly cashflow
- —
- DSCR
- —
- Eligible?
- —
Short-term bridge; refi at stabilization.
Rent comps 1 comps
| Address | Beds | Baths | Sqft | Rent | $/sqft | DOM | Units | Dist |
|---|---|---|---|---|---|---|---|---|
| 4625 Main St Unit 8 Springfield, OR | 2.0 | 1.0 | 650 | $1,250 | $1.92 | 13d | 1 | 0.92mi |
Listing history 16 events
-
2026-06-18days on market $25,000 Active 146 DOM
-
2026-06-17days on market $25,000 Active 145 DOM
-
2026-06-16days on market $25,000 Active 144 DOM
-
2026-06-15days on market $25,000 Active 143 DOM
-
2026-06-14days on market $25,000 Active 141 DOM
-
2026-06-10days on market $25,000 Active 138 DOM
-
2026-06-09days on market $25,000 Active 137 DOM
-
2026-06-08days on market $25,000 Active 136 DOM
-
2026-06-07days on market $25,000 Active 135 DOM
-
2026-06-03days on market $25,000 Active 131 DOM
-
2026-06-02days on market $25,000 Active 130 DOM
-
2026-06-01days on market $25,000 Active 129 DOM
-
2026-05-31days on market $25,000 Active 128 DOM
-
2026-05-30days on market $25,000 Active 127 DOM
-
2026-03-13price $25,000 244-char remark
Show marketing remark (244 chars)
2 Bed, 1 Bath manufactured home in quiet 55+ park. Buyers must be approved by Park management prior to purchase. Recently floor updated in kitchen. All appliances (Including washer and dryer ) in As-Is condition, included with full-price offer.
-
2026-01-22$28,000 Active 244-char remark
Show marketing remark (244 chars)
2 Bed, 1 Bath manufactured home in quiet 55+ park. Buyers must be approved by Park management prior to purchase. Recently floor updated in kitchen. All appliances (Including washer and dryer ) in As-Is condition, included with full-price offer.
ⓘ Source: listings_history table (triggers on properties + properties_extension) + one-shot
backfill from property_details.listing_events for pre-trigger history.
Tax reassessment forecast OR · Resets to sale price
- Current annual tax
- $200 · $17/mo
- Projected year-2 tax
- $242 · $20/mo
- Expected delta
- +$43/yr (+$4/mo · 21.3%)
ⓘ Screening estimate from a state-policy table — verify with the county assessor before closing.
Climate risk First Street
- Flood 1/10 Low FEMA zone X (unshaded) · 0% chance over 30 yrs
- Wildfire 5/10 Major
- Heat 4/10 Moderate 7 d/yr ≥91°F today · 15 d/yr by 30 yrs out
- Wind 1/10 Low
- Air quality 10/10 Extreme 13 unhealthy d/yr today · 15 by 30 yrs out
Nearby sold comps map
Loading sold comps map…
Walkable amenities ~0.75 mi
Loading nearby amenities…
Taxation est. · year 1
- Rental income
- $18,075
- − Mortgage interest
- −$1,400
- − Property taxes
- −$200
- − Insurance
- −$125
- − Repairs & maintenance
- −$1,446
- − Management
- −$1,446
- − Depreciation
- −$727
- Taxable income
- $12,731
- Est. tax owed @ 24.0%
- −$3,055
- After-tax cash flow
- $9,326/yr
For passive investors: Depreciation is non-cash, so a rental often shows a tax loss while cash-flowing — sheltering income. Rental losses are passive: they offset passive income freely, and up to $25,000/yr can offset ordinary (W-2) income if you actively participate and your MAGI is under $100k (phasing out to $0 by $150k); unused losses carry forward. On sale, claimed depreciation is recaptured at up to 25%, and gains may owe capital-gains tax (a 1031 exchange can defer both). Figures are a year-1 estimate at your 24.0% rate — not tax advice; consult a CPA.
Schools (NCES district)
- District
- Springfield SD 19
- NCES district ID
- 4111670
- Math proficiency
- 19% ▼ -13.00%
- Reading proficiency
- 38% ▼ -10.00%
- Median HH income
- $42,236
- Composite
- 24.14/100
- National rank
- #7746
- State rank
- #48 of 58 in OR
Livability — Springfield
- Score
- 83/100
- State rank
- #40
- US rank
- #934
Category grades
Schools grade is shown separately in the Schools card above.
Census & demographics
- Census place
- Springfield, OR
- County
- Lane County · 310,476 people
- City population
- 76,907
- Metro
- Eugene-Springfield, OR
- Population (ZIP)
- 39,373
- Household income
- $80,086
- Rent vs Own
- Severe rent burden
- 904.0
Population outlook (Lane County) Hauer SSP2
- Today (2025)
- 391,933 people
- By 2030
- 405,860 · +3.6%
- By 2040
- 429,386 · +9.6%
- By 2050
- 452,016 · +15.3%
- By 2075
- 508,825 · +29.8%
- By 2100
- 531,208 · +35.5%
Race, ethnicity, and origin ACS 2023
- Neighborhood character
- Predominantly White (79%)
- Race & ethnicity
- White 79% Hispanic / Latino 12% Two or more races 9% Native American 1% Asian 1%
- Hispanic origin (detail)
- Mexican 9%
- Common ancestry
- Slovak 4% Lithuanian 3% Portuguese 3%
- Foreign-born
- 4% · Canada
- Languages at home
- 94% English-only · Spanish 5% Tagalog/Filipino 1%
Political lean MEDSL · Lane
- 2024 margin
- Strong D (+23.1) · D 60.0% · R 36.9% · Other 3.1%
- 2008→2024 swing
- -4.3pp toward R · 2008: 27.4pp · 2024: 23.1pp
- All cycles
- 2024: D+23.1 2020: D+24.3 2016: D+18.9 2012: D+23.4 2008: D+27.4
Not yet ingested
- Civics
- —
Market trends
- HPI YoY
- ▼ -395.83%
- Current HPI
- 302.9203
- Rent YoY
- ▲ 3.38%
- Metro
- Eugene-Springfield, OR
- State GDP YoY
- ▲ 2.05%
- F500 in state
- 2
Industry mix (Fortune 500 HQ in OR)
| Industry | F500 HQs | Revenue |
|---|---|---|
| Consumer Goods | 1 | $51B |
|
||
Price history
-10.7% since first listed2 events — show timeline
- 2026-03-13 Price Changed $25,000 RMLS
- 2026-01-22 Listed $28,000 RMLS
Property tax history
+4.9%/yrLatest (2020): $200 · +10.1% YoY. Source: county tax records.
Cash-flow waterfall
monthlySold comps — $/sqft
last 12 mo · ≤1 miLoading sold comps…