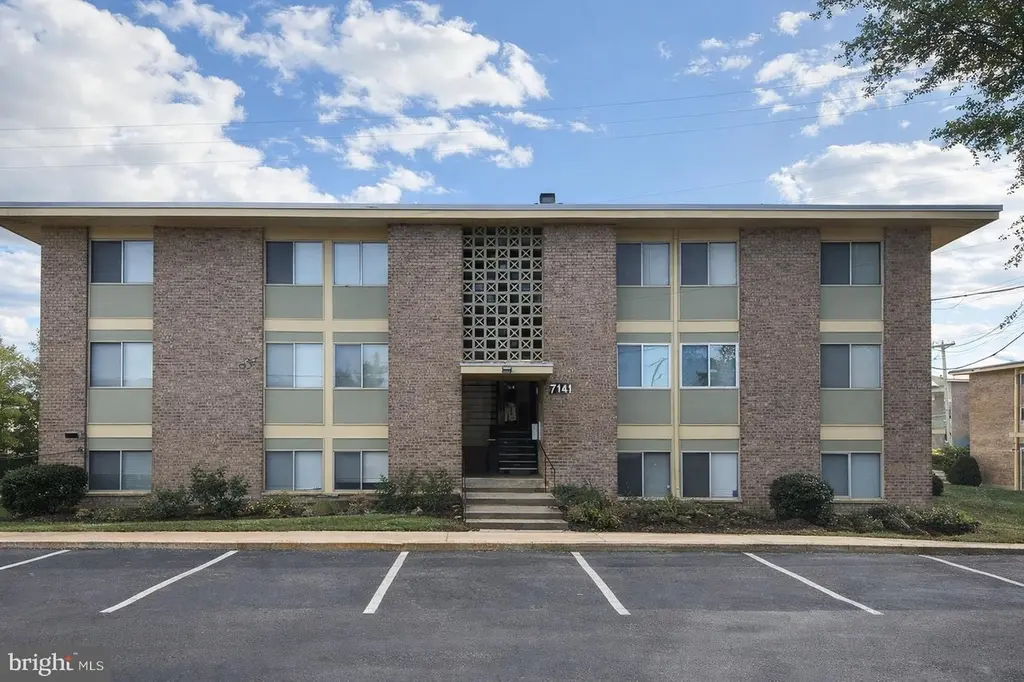
7141 Donnell Pl Unit B7 · Forestville, MD
Flood risk 1/10 · Minimal
- FEMA flood zone
- X (unshaded)
- Chance of flooding over 30 yrs
- 0.0%
- Est. flood insurance / yr
- $507 – $1,088
Fire risk 1/10 · Minimal
- Est. fire insurance / yr
- $755 – $1,403
Heat risk 8/10 · Major
- Hot days now (above 103°F)
- 7 days/yr
- Hot days in 30 yrs
- 16 days/yr
Wind risk 4/10 · Minor
- Chance of severe wind over 30 yrs
- 21.0%
Air-quality risk 3/10 · Minor
- Unhealthy air days now
- 2 days/yr
- Unhealthy air days in 30 yrs
- 3 days/yr
Risk factors via First Street. Map © Google.
Why this score? — see what drove the C- grade
The composite is a weighted blend of 9 inputs, each scored 0–100. Each bar is that input's sub-score; the figure is the points it added to the 100-point composite (weight × sub-score).
- Cash flow +18.5/30.0
- 1% rule +10.0/10.0
- ARV discount +7.5/15.0
- DSCR +5.8/10.0
- Livability +3.4/5.0
- Rent growth +3.0/5.0
- Condition / age +2.5/5.0
- Schools +1.7/10.0
- Appreciation +0.0/10.0
$90,000
🖨 Deal sheet 📄 Offer letter ✓ Due diligence
Listing remarks MLS
Income-Producing Condo – Strong Cash Flow in District Heights Tenant-occupied 1-bedroom condo currently generating $1,725/month (month-to-month lease), offering immediate income for investors. Priced at $99,000, this property provides strong rental performance and long-term hold potential. Estimated market value is approximately $125,000, with opportunity for light cosmetic improvements (paint, flooring, minor updates) to enhance overall value and tenant appeal. Investment Highlights: Current rent: $1,725/month Strong rent-to-price ratio Projected 7–8% cap rate based on typical operating expenses Potential 18–20% cash-on-cash return depending on financing structure Functional and income-producing as-is, making this ideal for buy-and-hold investors seeking stable monthly cash flow. Conveniently located near major commuter routes, shopping, and public transportation. Call us today to place your offer and add this asset to your portfolio.
Key facts
- Open living room
- Community amenities
- 2,545 sq ft lot
Tags
Neighborhood map
What this means for you Summary
Snapshot
- This is a 2-bed/1.0-bath condo listed at $90k.
Deal economics
- At list price, monthly cash flow is $86 ($1k/yr) — positive.
- The deal already cash-flows at list — no discount required.
- Meets the 1% rule at list price ($2k rent vs $90k).
- Recommended offer: $82k (9.0% below list) — sets the bar for market timing.
- Cap rate 7.4% vs local median 4.1% in Forestville — top-decile yield for the area; either an underpriced asset or a hidden risk that comps aren't pricing in. Stress-test before assuming the spread holds.
Location & tenants
- Location reads 67/100 on livability (#215 in MD) — a middle-class / working-renter tenant base. Strengths: housing A+, employment B+; Watch: health & safety C-, schools F, crime D-.
- Prince George'S County Public Schools (suburban): math 8% / reading 24% proficiency, ranked #21 of 24 in MD (top 88%) — low school quality limits family demand, transient renter base, plan for 1-2y turnover.
- Market conditions: Rents rising (+2.0%/yr); 114 active listings in the ZIP; 23 comparable units currently listed for rent nearby; rentals at typical pace (median 24d on market — plan ~3-4 weeks tenant-placement turnaround); 48% of comp listings sitting > 30 days — soft ceiling on asking rent; solid renter incomes; 1,481 units permitted in Prince George's County in 2024 (0 in 5+ unit buildings).
Forward outlook
- Local home prices are declining (-3.0%/yr); year-one equity from $622 of loan paydown is wiped out by about $3k of value loss. Plan a longer hold.
- Prince George's County population projected at +18% by 2050 — long-run rental-demand tailwind backs the buy-and-hold thesis.
Negotiation context
- It's been on market 108 days — a 9% lower offer ($82k) is reasonable based on typical stale-listing flexibility.
- 2 sale attempts since 23y ago; this cycle's ask has dropped $20k (18%) from the opening price — seller is motivated, your offer sets the floor, not the list.
Risks & watch-outs
- Watch-outs: HOA is 35% of rent.
- Climate carrying-cost: extreme-heat days projected 7→16/yr by 2055 (HVAC capex compounding) — expect insurance premiums to compound above CPI over the hold.
Questions for the listing agent
- It's been on market 108 days. Have you received any prior offers? Is the seller open to a 9% concession, seller financing, or rate buy-down credit?
- Built in 1964 — when were the roof, HVAC, electrical panel, plumbing, and water heater last replaced?
- What does the HOA fee cover, when was the last increase, and are there any pending special assessments or reserve-fund shortfalls?
- Any open or pending special assessments — roof, HVAC, plumbing, elevator, façade? What's the per-unit balance and payoff schedule, and is the seller paying it off at close or rolling it to the buyer?
- Why hasn't it sold? Are there any deal-killer items the seller is aware of (foundation, flood, title, zoning, code violations)?
- Is there a deadline driving the sale (1031 exchange, divorce, estate, relocation)? That informs how much negotiation room exists.
- Schools are F-rated, which usually means shorter tenancies and higher turnover. Who's the typical renter profile here, and what's been the actual vacancy rate?
- Crime grade is D in this area — have there been break-ins, vandalism, or insurance claims at this property in the last 3 years? What carrier currently insures it and at what premium?
- What's the average days-on-market for RENTAL listings here right now (not sales)? A rising rental-DOM trend means longer vacancies and softer asking-rent achievability than the comps imply.
- What's the recent tenant-quality profile in this submarket — average credit score on applications, eviction rate, late-payment / NSF rate, and stable-employment percentage? A property-management company in the area should have these aggregated.
- How much new apartment / multifamily construction is in the pipeline within 1–3 miles? Heavy new supply (>2% of stock underway) typically softens rents 12–24 months out; light construction supports rent growth.
Investment metrics
- 1% rule
- 1.89% ✓
- Cap rate
- 7.44%
- Cash-on-cash
- 4.11%
- DSCR
- 1.18
- GRM
- 4.4
CMA / ARV
No comps found within radius.
Projected returns pro-forma
-3.0% appreciation · 2.0% rent growth · sell at horizon
- IRR
- -11.5%
- Equity multiple
- 0.59×
- Total profit
- $-10,361
- Equity at exit
- $13,419
- IRR
- -4.6%
- Equity multiple
- 0.72×
- Total profit
- $-7,062
- Equity at exit
- $7,782
Cash invested: $25,200 (down + closing). Projections, not guarantees.
Landlord ↔ Tenant lean methodology
- Overall (STATE)
- 27 Tenant-Leaning
- State Maryland
- 27 Tenant-Leaning · D+14
- County
- — inherits STATE
- City
- — inherits STATE
ZIP-level market 20747
- Home prices YoY
- -19.0%
- Rents YoY
- 2.0%
- Active inventory
- 114
- Price-to-rent
- 4.4×
Monthly cashflow live
- Estimated rent
- $1,701 high interval (Pro) →
- Mortgage (P&I)
- −$472
- Tax from tax record
- −$148 /mo · $1,772/yr
- Insurance
- −$38
- HOA
- −$600
- Vacancy / Maint / Mgmt
- −$357
- Net cashflow
- $86
Break-even live
UW: 25.0% down · 7.5% · 30yr · 1.5% tax · 5.0% vac · 8.0% maint · 8.0% mgmt
Financing live
Cash to close
- Down payment
- $22,500
- Closing costs
- $2,700
- Reserves months
- —
- Total cash needed
- —
Loan-product check · same deal, 3 products live
Conventional
25% down · 7.5% · 30yr
- Down + closing
- —
- Monthly P&I
- —
- Monthly cashflow
- —
- DSCR
- —
- Eligible?
- —
Personal DTI + credit; lowest rate.
DSCR
20% down · 8.5% · 30yr
- Down + closing
- —
- Monthly P&I
- —
- Monthly cashflow
- —
- DSCR
- —
- Eligible?
- —
No personal income docs; deal must DSCR.
Hard money
10% down · 12.0% · 12mo
- Down + closing
- —
- Monthly P&I
- —
- Monthly cashflow
- —
- DSCR
- —
- Eligible?
- —
Short-term bridge; refi at stabilization.
Rent comps 23 comps
| Address | Beds | Baths | Sqft | Rent | $/sqft | DOM | Units | Dist |
|---|---|---|---|---|---|---|---|---|
| 7135 Donnell Pl Unit A1 District Heights, MD | 1.0 | 1.0 | 659 | $1,450 | $2.20 | 43d | 1 | 0.01mi |
| 7135 Donnell Pl Unit A1 District Heights, MD | 1.0 | 1.0 | 659 | $1,300 | $1.97 | 3d | 1 | 0.01mi |
| 7244 Donnell Pl Unit D2 District Heights, MD | 3.0 | 1.5 | 1108 | $1,900 | $1.71 | 43d | 1 | 0.02mi |
| 7248 Donnell Pl Unit B5 District Heights, MD | 2.0 | 1.0 | 886 | $1,950 | $2.20 | 24d | 1 | 0.03mi |
| 7248 Donnell Pl Unit B5 District Heights, MD | 2.0 | 1.0 | 886 | $1,950 | $2.20 | 17d | 1 | 0.03mi |
| 7157 Donnell Pl Unit A1 District Heights, MD | 1.0 | 1.0 | 700 | $1,500 | $2.14 | 43d | 1 | 0.04mi |
| 7116 Donnell Pl Unit C Forestville, MD | 2.0 | 1.0 | 886 | $1,650 | $1.86 | 43d | 1 | 0.08mi |
| 7208 Donnell Pl Unit C1 District Heights, MD | 2.0 | 1.0 | 800 | $1,649 | $2.06 | 43d | 1 | 0.10mi |
| 7206 Donnell Pl Unit D8 District Heights, MD | 2.0 | 1.0 | 884 | $1,800 | $2.04 | 43d | 1 | 0.11mi |
| 7169 Cross St Unit T1 District Heights, MD | 2.0 | 2.0 | 906 | $1,850 | $2.04 | 18d | 1 | 0.15mi |
| 3253 Walters Ln District Heights, MD | 1.0–3.0 | 1.0–1.5 | 941 | $1,705 | $1.81 | 3d | 17 | 0.59mi |
| 2908 Walters Ln Unit 1 District Heights, MD | 2.0 | 1.0 | 1100 | $1,400 | $1.27 | 24d | 1 | 0.67mi |
| 2707 Judith Ave District Heights, MD | 2.0 | 1.0 | 816 | $2,500 | $3.06 | 43d | 1 | 0.69mi |
| 6501 Hil Mar Dr District Heights, MD | 1.0–3.0 | 1.0–1.5 | 1014 | $1,712 | $1.69 | 43d | 27 | 0.70mi |
| 2610 Lakehurst Ave District Heights, MD | 3.0 | 1.0 | 1096 | $2,150 | $1.96 | 43d | 1 | 0.80mi |
| 6310 Hil Mar Dr Unit 9-11 District Heights, MD | 2.0 | 1.0 | 913 | $1,750 | $1.92 | 18d | 1 | 0.84mi |
| 6525 Kenova St District Heights, MD | 2.0 | 1.0 | 1075 | $1,500 | $1.40 | 43d | 1 | 0.84mi |
| 4400 Rena Rd Suitland, MD | 1.0–3.0 | 1.0–1.5 | 995 | $1,832 | $1.84 | 3d | 9 | 0.89mi |
| 6305 Hil-Mar Dr District Heights, MD | 2.0 | 1.0 | 921 | $1,825 | $1.98 | 43d | 1 | 0.90mi |
| 6311 Pennsylvania Ave District Heights, MD | 1.0–3.0 | 1.0 | 883 | $1,632 | $1.85 | 1d | 10 | 1.01mi |
| 3516 Community Dr District Heights, MD | 3.0 | 2.0 | 1096 | $1,500 | $1.37 | 5d | 1 | 1.05mi |
| 6024 Surrey Square Ln District Heights, MD | 1.0–3.0 | 1.0–2.0 | 1059 | $1,796 | $1.70 | 1d | 22 | 1.11mi |
| 3321 Chester Grove Rd Upper Marlboro, MD | 2.0 | 1.0 | 780 | $2,100 | $2.69 | 18d | 1 | 1.44mi |
HOA detail condo
- Monthly dues
- $600 · $7,200/yr
- Assessments
- None detected in remarks — confirm with the listing agent.
Listing history 19 events
-
2026-06-08days on market $90,000 Active 108 DOM
-
2026-06-07days on market $90,000 Active 107 DOM
-
2026-06-04days on market $90,000 Active 104 DOM
-
2026-06-03days on market $90,000 Active 103 DOM
-
2026-06-02days on market $90,000 Active 102 DOM
-
2026-06-01days on market $90,000 Active 101 DOM
-
2026-05-31days on market $90,000 Active 100 DOM
-
2026-05-04price $90,000 969-char remark
Show marketing remark (969 chars)
Income-Producing Condo – Strong Cash Flow in District Heights Tenant-occupied 1-bedroom condo currently generating $1,725/month (month-to-month lease), offering immediate income for investors. Priced at $99,000, this property provides strong rental performance and long-term hold potential. Estimated market value is approximately $125,000, with opportunity for light cosmetic improvements (paint, flooring, minor updates) to enhance overall value and tenant appeal. Investment Highlights: Current rent: $1,725/month Strong rent-to-price ratio Projected 7–8% cap rate based on typical operating expenses Potential 18–20% cash-on-cash return depending on financing structure Functional and income-producing as-is, making this ideal for buy-and-hold investors seeking stable monthly cash flow. Conveniently located near major commuter routes, shopping, and public transportation. Call us today to place your offer and add this asset to your portfolio.
-
2026-03-10price $99,000 969-char remark
Show marketing remark (969 chars)
Income-Producing Condo – Strong Cash Flow in District Heights Tenant-occupied 1-bedroom condo currently generating $1,725/month (month-to-month lease), offering immediate income for investors. Priced at $99,000, this property provides strong rental performance and long-term hold potential. Estimated market value is approximately $125,000, with opportunity for light cosmetic improvements (paint, flooring, minor updates) to enhance overall value and tenant appeal. Investment Highlights: Current rent: $1,725/month Strong rent-to-price ratio Projected 7–8% cap rate based on typical operating expenses Potential 18–20% cash-on-cash return depending on financing structure Functional and income-producing as-is, making this ideal for buy-and-hold investors seeking stable monthly cash flow. Conveniently located near major commuter routes, shopping, and public transportation. Call us today to place your offer and add this asset to your portfolio.
-
2026-02-21price $109,000 969-char remark
Show marketing remark (969 chars)
Income-Producing Condo – Strong Cash Flow in District Heights Tenant-occupied 1-bedroom condo currently generating $1,725/month (month-to-month lease), offering immediate income for investors. Priced at $99,000, this property provides strong rental performance and long-term hold potential. Estimated market value is approximately $125,000, with opportunity for light cosmetic improvements (paint, flooring, minor updates) to enhance overall value and tenant appeal. Investment Highlights: Current rent: $1,725/month Strong rent-to-price ratio Projected 7–8% cap rate based on typical operating expenses Potential 18–20% cash-on-cash return depending on financing structure Functional and income-producing as-is, making this ideal for buy-and-hold investors seeking stable monthly cash flow. Conveniently located near major commuter routes, shopping, and public transportation. Call us today to place your offer and add this asset to your portfolio.
-
2026-02-20$110,000 Active 969-char remark
Show marketing remark (969 chars)
Income-Producing Condo – Strong Cash Flow in District Heights Tenant-occupied 1-bedroom condo currently generating $1,725/month (month-to-month lease), offering immediate income for investors. Priced at $99,000, this property provides strong rental performance and long-term hold potential. Estimated market value is approximately $125,000, with opportunity for light cosmetic improvements (paint, flooring, minor updates) to enhance overall value and tenant appeal. Investment Highlights: Current rent: $1,725/month Strong rent-to-price ratio Projected 7–8% cap rate based on typical operating expenses Potential 18–20% cash-on-cash return depending on financing structure Functional and income-producing as-is, making this ideal for buy-and-hold investors seeking stable monthly cash flow. Conveniently located near major commuter routes, shopping, and public transportation. Call us today to place your offer and add this asset to your portfolio.
-
2004-02-25soldstatus $80,000
-
2004-02-25soldstatus $80,000
-
2003-09-04historical
-
2003-07-09
-
2002-10-25soldstatus $65,900
-
2001-07-03soldstatus $30,000
-
1995-04-28soldstatus $63,000
-
1989-02-03soldstatus $61,000
ⓘ Source: listings_history table (triggers on properties + properties_extension) + one-shot
backfill from property_details.listing_events for pre-trigger history.
Tax reassessment forecast MD · Partial reset (capped growth)
- Current annual tax
- $1,772 · $148/mo
- Projected year-2 tax
- $1,772 · $148/mo
- Expected delta
- $0/yr ($0/mo · 0.0%)
ⓘ Screening estimate from a state-policy table — verify with the county assessor before closing.
Climate risk First Street
- Flood 1/10 Low FEMA zone X (unshaded) · 0% chance over 30 yrs
- Wildfire 1/10 Low
- Heat 8/10 Severe 7 d/yr ≥103°F today · 16 d/yr by 30 yrs out
- Wind 4/10 Moderate 21% chance of damaging wind over 30 yrs
- Air quality 3/10 Moderate 2 unhealthy d/yr today · 3 by 30 yrs out
Nearby sold comps map
Loading sold comps map…
Walkable amenities ~0.75 mi
Loading nearby amenities…
Taxation est. · year 1
- Rental income
- $20,407
- − Mortgage interest
- −$5,041
- − Property taxes
- −$1,772
- − Insurance
- −$450
- − Repairs & maintenance
- −$1,633
- − Management
- −$1,633
- − HOA
- −$7,200
- − Depreciation
- −$2,618
- Taxable income
- $61
- Est. tax owed @ 24.0%
- −$15
- After-tax cash flow
- $1,022/yr
For passive investors: Depreciation is non-cash, so a rental often shows a tax loss while cash-flowing — sheltering income. Rental losses are passive: they offset passive income freely, and up to $25,000/yr can offset ordinary (W-2) income if you actively participate and your MAGI is under $100k (phasing out to $0 by $150k); unused losses carry forward. On sale, claimed depreciation is recaptured at up to 25%, and gains may owe capital-gains tax (a 1031 exchange can defer both). Figures are a year-1 estimate at your 24.0% rate — not tax advice; consult a CPA.
Schools (NCES district)
- District
- Prince George'S County Public Schools
- NCES district ID
- 2400510
- Math proficiency
- 8% ▼ -11.00%
- Reading proficiency
- 24% ▼ -9.00%
- Median HH income
- $73,967
- Composite
- 16.82/100
- National rank
- #9151
- State rank
- #21 of 24 in MD
Livability — Forestville
- Score
- 67/100
- State rank
- #215
- US rank
- #10596
Category grades
Schools grade is shown separately in the Schools card above.
Census & demographics
- Census place
- Forestville, MD
- County
- Prince Georges County · 919,866 people
- City population
- 37,924
- Metro
- Washington-Arlington-Alexandria, DC-VA-MD-WV
- Population (ZIP)
- 38,301
- Household income
- $76,298
- Rent vs Own
- Severe rent burden
- 2132.0
Population outlook (Prince George's County) Hauer SSP2
- Today (2025)
- 1,005,426 people
- By 2030
- 1,048,416 · +4.3%
- By 2040
- 1,123,425 · +11.7%
- By 2050
- 1,183,220 · +17.7%
- By 2075
- 1,306,202 · +29.9%
- By 2100
- 1,408,179 · +40.1%
Race, ethnicity, and origin ACS 2023
- Neighborhood character
- Predominantly Black (86%)
- Race & ethnicity
- Black 86% Hispanic / Latino 7% Two or more races 5% White 2%
- Hispanic origin (detail)
- Foreign-born
- 8% · Canada
- Languages at home
- 89% English-only · Spanish 6% French/Haitian/Cajun 1%
Political lean MEDSL · Prince George's
- 2024 margin
- Solid D (+75.2) · D 86.3% · R 11.2% · Other 2.5%
- 2008→2024 swing
- -3.3pp toward R · 2008: 78.5pp · 2024: 75.2pp
- All cycles
- 2024: D+75.2 2020: D+80.5 2016: D+81.0 2012: D+80.9 2008: D+78.5
Not yet ingested
- Civics
- —
Market trends
- HPI YoY
- ▼ -67.90%
- Current HPI
- 289.095
- Rent YoY
- ▲ 2.00%
- Metro
- Washington-Arlington-Alexandria, DC-VA-MD-WV
- State GDP YoY
- ▲ 2.97%
- F500 in state
- 12
Industry mix (Fortune 500 HQ in MD)
| Industry | F500 HQs | Revenue |
|---|---|---|
| Aerospace / Defense | 1 | $71B |
|
||
| Utilities | 1 | $25B |
|
||
| Hotels | 1 | $24B |
|
||
| Consumer Goods | 1 | $7B |
|
||
| Real Estate | 1 | $6B |
|
||
| Chemicals | 1 | $2B |
|
||
Price history
+47.5% since first listed12 events — show timeline
- 2026-05-04 Price Changed $90,000 BRIGHT MLS
- 2026-03-10 Price Changed $99,000 BRIGHT MLS
- 2026-02-21 Price Changed $109,000 BRIGHT MLS
- 2026-02-20 Listed $110,000 BRIGHT MLS
- 2004-02-25 Sold (Public Records) $80,000 Public Records
- 2004-02-25 Sold (Public Records) $80,000 Public Records
- 2003-09-04 Delisted — MRIS
- 2003-07-09 Listed — MRIS
- 2002-10-25 Sold (Public Records) $65,900 Public Records
- 2001-07-03 Sold (Public Records) $30,000 Public Records
- 1995-04-28 Sold (Public Records) $63,000 Public Records
- 1989-02-03 Sold (Public Records) $61,000 Public Records
Property tax history
+5.3%/yrLatest (2025): $1,772 · +11.6% YoY. Source: county tax records.
Cash-flow waterfall
monthlySold comps — $/sqft
last 12 mo · ≤1 miLoading sold comps…