 Triplex
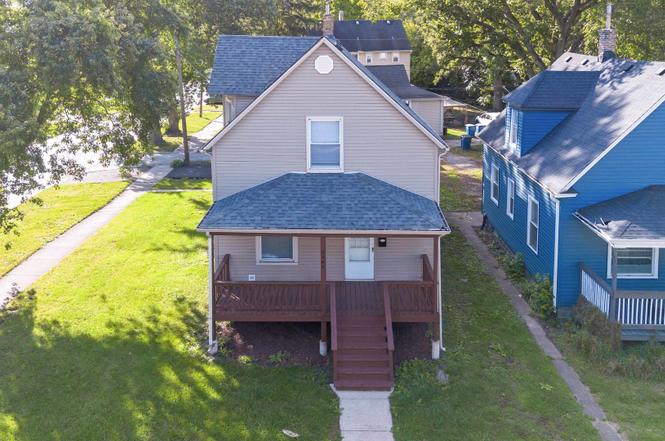
1144 Grant Ave · Chicago Heights, IL
Flood risk 6/10 · Moderate
- FEMA flood zone
- X (unshaded)
- Chance of flooding over 30 yrs
- 0.73%
- Est. flood insurance / yr
- $473 – $860
Fire risk 3/10 · Minor
- Est. fire insurance / yr
- $804 – $1,492
Heat risk 3/10 · Minor
- Hot days now (above 101°F)
- 7 days/yr
- Hot days in 30 yrs
- 16 days/yr
Wind risk 2/10 · Minimal
- Chance of severe wind over 30 yrs
- —
Air-quality risk 2/10 · Minimal
- Unhealthy air days now
- 2 days/yr
- Unhealthy air days in 30 yrs
- 2 days/yr
Risk factors via First Street. Map © Google.
Why this score? — see what drove the C+ grade
The composite is a weighted blend of 9 inputs, each scored 0–100. Each bar is that input's sub-score; the figure is the points it added to the 100-point composite (weight × sub-score).
- Cash flow +26.4/30.0
- DSCR +9.0/10.0
- 1% rule +7.8/10.0
- ARV discount +7.5/15.0
- Rent growth +4.1/5.0
- Livability +3.6/5.0
- Condition / age +2.5/5.0
- Schools +0.7/10.0
- Appreciation +0.0/10.0
$259,900
🖨 Deal sheet 📄 Offer letter ✓ Due diligence
Multi-family units
County records classify this as Multi-Family (2-4 Unit). Listing-text estimate: 3 units. confirmed
Listing remarks
THIS PROPERTY HAS A WALK OUT BASEMENT WITH POTENTIAL TO BE TURNED INTO A LEGAL 3-UNIT! Welcome to this stunning 2-unit in Chicago Heights on a corner lot! This property boasts a brand new roof, windows, facia, soffits and brand new gutters! Everything is new inside this home! Including a new HVAC system, new electrical throughout, new plumbing throughout and all new drywall throughout the interior of the property. The kitchen has new cabinets, quartz countertops, and new stainless steel applicances will be installed before closing. The first floor unit has 2 bedrooms and a full bath with water proof and scratch resistant flooring throughout. The second floor unit is where you can enjoy plu
Key facts
- New plumbing
- Brand new roof
- New electrical
Tags
Property features AI
Finance
- Other: Possession at closing or immediate
- Financial info: Special service area: No
Exterior
- Parking: Driveway with space for 4 vehicles
- Utilities: Water: Lake Michigan / Public; Sewer: Public sewer
- Home design: Two- to four-unit property (2-unit building); Two-story building; Fee simple ownership; Built over 100 years ago
- Construction: Vinyl siding; Built before 1978
- Exterior features: Lot dimensions: 105 x 91 x 49 x 46; Lot less than 0.25 acre; Rehab planned/completed in 2025
Interior
- Kitchen: Each unit includes a stove
- Bedrooms: 4 bedrooms (2 on each unit: one 2-bedroom unit on the first floor, one 2-bedroom unit on the second floor)
- Bathrooms: 2 full bathrooms (one in each unit)
- Heating & cooling: Natural gas forced-air heating
- Interior features: 10 total rooms; Unfinished full basement with walk-out access
Neighborhood map
What this means for you Summary
Snapshot
- This is a 3 × 1-bed/?-bath units multifamily listed at $260k.
Deal economics
- At list price, monthly cash flow is $681 ($8k/yr) — positive. Per door: $227/mo.
- The deal already cash-flows at list — no discount required.
- Meets the 1% rule at list price ($3k rent vs $260k).
- Cap rate 9.4% vs local median 6.4% in Chicago Heights — top-decile yield for the area; either an underpriced asset or a hidden risk that comps aren't pricing in. Stress-test before assuming the spread holds.
Location & tenants
- Location reads 71/100 on livability (#339 in IL) — a middle-class / working-renter tenant base. Strengths: commute A+, cost of living A+, housing A+; Watch: employment C-, schools F, crime F.
- Bloom Twp Hsd 206 (suburban): math 8% / reading 9% proficiency, ranked #591 of 620 in IL (top 95%) — low school quality limits family demand, transient renter base, plan for 1-2y turnover.
- Market conditions: Rents rising fast (+6.5%/yr); 222 active listings in the ZIP; 2 comparable units currently listed for rent nearby; 6,272 units permitted in Cook County in 2024 (4,658 in 5+ unit buildings).
- At $3,325/mo this rent would consume 64% of the median local household income ($62k/yr) (locally 1714% of renters already pay >50% of income on rent) — very limited rent-growth headroom before tenants either downsize or default.
Forward outlook
- Local home prices are declining (-3.0%/yr); year-one equity from $2k of loan paydown is wiped out by about $8k of value loss. Plan a longer hold.
- At projected returns (-3.0% appreciation + 6.5% rent growth), your $73k cash investment doubles in ~8 years — after that, you're playing with house money.
Negotiation context
- Only 2 days on market — expect competitive offers; lowballing is unlikely to land.
- 12 sale attempts since 10y ago; this cycle's ask is 13% above the opening price — seller raised mid-cycle; expect resistance to lowballs.
- Current owner paid $220k; 18% above their basis — modest negotiation headroom, anchor on the comps not their cost.
Risks & watch-outs
- Watch-outs: built in 1903 — expect roof / HVAC / electrical / plumbing capex.
- Climate carrying-cost: major flood risk — expect insurance premiums to compound above CPI over the hold.
Questions for the listing agent
- Can we see the unit-by-unit rent roll, current vacancy, and any below-market leases? What's the average tenancy length?
- What capital expenditures (roof, boiler, parking lot, exteriors) have been made in the last 5 years, and what's planned in the next 2?
- Built in 1903 — when were the roof, HVAC, electrical panel, plumbing, and water heater last replaced?
- Is there a deadline driving the sale (1031 exchange, divorce, estate, relocation)? That informs how much negotiation room exists.
- Schools are F-rated, which usually means shorter tenancies and higher turnover. Who's the typical renter profile here, and what's been the actual vacancy rate?
- Crime grade is F in this area — have there been break-ins, vandalism, or insurance claims at this property in the last 3 years? What carrier currently insures it and at what premium?
- What's the average days-on-market for RENTAL listings here right now (not sales)? A rising rental-DOM trend means longer vacancies and softer asking-rent achievability than the comps imply.
- What's the recent tenant-quality profile in this submarket — average credit score on applications, eviction rate, late-payment / NSF rate, and stable-employment percentage? A property-management company in the area should have these aggregated.
- How much new apartment / multifamily construction is in the pipeline within 1–3 miles? Heavy new supply (>2% of stock underway) typically softens rents 12–24 months out; light construction supports rent growth.
Investment metrics
- 1% rule
- 1.28% ✓
- Cap rate
- 9.44%
- Cash-on-cash
- 11.23%
- DSCR
- 1.50
- GRM
- 6.5
CMA / ARV
No comps found within radius.
Projected returns pro-forma
-3.0% appreciation · 6.48% rent growth · sell at horizon
- IRR
- 4.6%
- Equity multiple
- 1.18×
- Total profit
- $13,445
- Equity at exit
- $38,752
- IRR
- 17.2%
- Equity multiple
- 2.67×
- Total profit
- $121,244
- Equity at exit
- $22,471
Cash invested: $72,772 (down + closing). Projections, not guarantees.
Landlord ↔ Tenant lean methodology
- Overall (STATE)
- 43 Moderately Tenant-Leaning
- State Illinois
- 43 Moderately Tenant-Leaning · D+7
- County
- — inherits STATE
- City
- — inherits STATE
ZIP-level market 60411
- Home prices YoY
- -33.9%
- Rents YoY
- 6.5%
- Active inventory
- 222
- Price-to-rent
- 19.5×
Monthly cashflow live
- Estimated rent
- $3,325 medium interval (Pro) →
- Mortgage (P&I)
- −$1,363
- Tax from tax record
- −$475 /mo · $5,695/yr
- Insurance
- −$108
- HOA
- −$0
- Vacancy / Maint / Mgmt
- −$698
- Net cashflow
- $681
Break-even live
3-unit breakdown (identical units grouped — click to expand)
| Units | Beds | Baths | Est. rent |
|---|---|---|---|
| 3× units | 1 | — | $3,324 |
| #1 | 1 | — | $1,108 |
| #2 | 1 | — | $1,108 |
| #3 | 1 | — | $1,108 |
| Total (3 units) | $3,325 | ||
UW: 25.0% down · 7.5% · 30yr · 1.5% tax · 5.0% vac · 8.0% maint · 8.0% mgmt
Financing live
Cash to close
- Down payment
- $64,975
- Closing costs
- $7,797
- Reserves months
- —
- Total cash needed
- —
Loan-product check · same deal, 3 products live
Conventional
25% down · 7.5% · 30yr
- Down + closing
- —
- Monthly P&I
- —
- Monthly cashflow
- —
- DSCR
- —
- Eligible?
- —
Personal DTI + credit; lowest rate.
DSCR
20% down · 8.5% · 30yr
- Down + closing
- —
- Monthly P&I
- —
- Monthly cashflow
- —
- DSCR
- —
- Eligible?
- —
No personal income docs; deal must DSCR.
Hard money
10% down · 12.0% · 12mo
- Down + closing
- —
- Monthly P&I
- —
- Monthly cashflow
- —
- DSCR
- —
- Eligible?
- —
Short-term bridge; refi at stabilization.
Rent comps 2 comps
| Address | Beds | Baths | Sqft | Rent | $/sqft | DOM | Units | Dist |
|---|---|---|---|---|---|---|---|---|
| 41 W 14th Pl Unit 1 Chicago Heights, IL | 3.0 | 1.0 | 1250 | $1,750 | $1.40 | 11d | 1 | 0.44mi |
| 1665 Buena Vista Ave Unit 3 Chicago Heights, IL | 4.0 | 1.0 | 1700 | $1,800 | $1.06 | 18d | 1 | 0.82mi |
Listing history 50 events
-
2026-06-18days on market $259,900 Active 2 DOM
-
2026-06-17pricestatusdays on market $259,900 Active 1 DOM
-
2026-06-16days on market $224,900 Contingent - Continue to Show 53 DOM
-
2026-06-15days on market $224,900 Contingent - Continue to Show 52 DOM
-
2026-06-13days on market $224,900 Contingent - Continue to Show 50 DOM
-
2026-06-13days on market $224,900 Contingent - Continue to Show 49 DOM
-
2026-06-09days on market $224,900 Contingent - Continue to Show 46 DOM
-
2026-06-08days on market $224,900 Contingent - Continue to Show 45 DOM
-
2026-06-07days on market $224,900 Contingent - Continue to Show 44 DOM
-
2026-06-04days on market $224,900 Contingent - Continue to Show 41 DOM
-
2026-06-03days on market $224,900 Contingent - Continue to Show 40 DOM
-
2026-06-02days on market $224,900 Contingent - Continue to Show 39 DOM
-
2026-06-01days on market $224,900 Contingent - Continue to Show 38 DOM
-
2026-05-31days on market $224,900 Contingent - Continue to Show 37 DOM
-
2026-04-29historical Contingent - Continue to Show
-
2026-03-20historical Contingent - Continue to Show
-
2026-03-20historical
-
2026-02-16Active
-
2026-02-16historical
-
2026-02-07Active
-
2026-02-07historical
-
2026-01-28Active
-
2026-01-28historical
-
2026-01-05Active
-
2026-01-05historical
-
2025-12-08Active
-
2025-12-08historical
-
2025-10-28Active
-
2025-10-15historical Contingent - Continue to Show
-
2025-10-15historical
-
2025-10-09Active
-
2025-10-09historical
-
2025-10-07price
-
2025-10-03price
-
2025-09-26price
-
2025-09-20price
-
2025-09-10Active
-
2025-09-10historical
-
2025-09-07price
-
2025-09-02Active
-
2025-09-02historical
-
2025-08-31price
-
2025-08-21Active
-
2023-04-05soldstatus $220,000
-
2023-03-14soldstatus $229,900 Closed
-
2023-02-21historical Contingent - Continue to Show
-
2023-02-11$229,900 Active
-
2017-01-03historical
-
2016-12-28price
-
2016-12-13price
ⓘ Source: listings_history table (triggers on properties + properties_extension) + one-shot
backfill from property_details.listing_events for pre-trigger history.
Tax reassessment forecast IL · Partial reset (capped growth)
- Current annual tax
- $5,695 · $475/mo
- Projected year-2 tax
- $5,797 · $483/mo
- Expected delta
- +$102/yr (+$9/mo · 1.8%)
ⓘ Screening estimate from a state-policy table — verify with the county assessor before closing.
Climate risk First Street
- Flood 6/10 Major FEMA zone X (unshaded) · 73% chance over 30 yrs
- Wildfire 3/10 Moderate
- Heat 3/10 Moderate 7 d/yr ≥101°F today · 16 d/yr by 30 yrs out
- Wind 2/10 Low
- Air quality 2/10 Low 2 unhealthy d/yr today · 2 by 30 yrs out
Nearby sold comps map
Loading sold comps map…
Walkable amenities ~0.75 mi
Loading nearby amenities…
Taxation est. · year 1
- Rental income
- $39,900
- − Mortgage interest
- −$14,558
- − Property taxes
- −$5,695
- − Insurance
- −$1,300
- − Repairs & maintenance
- −$3,192
- − Management
- −$3,192
- − Depreciation
- −$7,561
- Taxable income
- $4,403
- Est. tax owed @ 24.0%
- −$1,057
- After-tax cash flow
- $7,115/yr
For passive investors: Depreciation is non-cash, so a rental often shows a tax loss while cash-flowing — sheltering income. Rental losses are passive: they offset passive income freely, and up to $25,000/yr can offset ordinary (W-2) income if you actively participate and your MAGI is under $100k (phasing out to $0 by $150k); unused losses carry forward. On sale, claimed depreciation is recaptured at up to 25%, and gains may owe capital-gains tax (a 1031 exchange can defer both). Figures are a year-1 estimate at your 24.0% rate — not tax advice; consult a CPA.
Schools (NCES district)
- District
- Bloom Twp Hsd 206
- NCES district ID
- 1706420
- Math proficiency
- 8% ▼ -3.00%
- Reading proficiency
- 9% ▼ -8.00%
- Median HH income
- $39,795
- Composite
- 7.4/100
- National rank
- #9952
- State rank
- #591 of 620 in IL
Livability — Chicago Heights
- Score
- 71/100
- State rank
- #339
- US rank
- #6836
Category grades
Schools grade is shown separately in the Schools card above.
Census & demographics
- Census place
- Chicago Heights, IL
- County
- Cook County · 4,486,803 people
- City population
- 52,175
- Metro
- Chicago-Naperville-Elgin, IL-IN-WI
- Population (ZIP)
- 52,175
- Household income
- $62,073
- Rent vs Own
- Severe rent burden
- 1714.0
Population outlook (Cook County) Hauer SSP2
- Today (2025)
- 5,347,519 people
- By 2030
- 5,357,703 · +0.2%
- By 2040
- 5,324,924 · -0.4%
- By 2050
- 5,230,762 · -2.2%
- By 2075
- 4,785,735 · -10.5%
- By 2100
- 4,188,836 · -21.7%
Race, ethnicity, and origin ACS 2023
- Neighborhood character
- Diverse neighborhood (Simpson 0.66)
- Race & ethnicity
- Black 49% Hispanic / Latino 26% White 19% Two or more races 11%
- Hispanic origin (detail)
- Mexican 22% Puerto Rican 2%
- Common ancestry
- Romanian 4% Portuguese 1% Lithuanian 1%
- Foreign-born
- 12% · Canada
- Languages at home
- 76% English-only · Spanish 21% Russian/Polish/Slavic 1% Other Indo-European 1%
Political lean MEDSL · Cook
- 2024 margin
- Solid D (+42.0) · D 70.4% · R 28.4% · Other 1.2%
- 2008→2024 swing
- -11.4pp toward R · 2008: 53.4pp · 2024: 42.0pp
- All cycles
- 2024: D+42.0 2020: D+50.3 2016: D+53.0 2012: D+49.4 2008: D+53.4
Not yet ingested
- Civics
- —
Market trends
- HPI YoY
- ▼ -108.75%
- Current HPI
- 212.4058
- Rent YoY
- ▲ 6.48%
- Metro
- Chicago-Naperville-Elgin, IL-IN-WI
- State GDP YoY
- ▲ 1.59%
- F500 in state
- 60
Industry mix (Fortune 500 HQ in IL)
| Industry | F500 HQs | Revenue |
|---|---|---|
| Insurance | 4 | $201B |
|
||
| Consumer Goods | 4 | $87B |
|
||
| Industrial Machinery | 3 | $64B |
|
||
| Healthcare | 2 | $55B |
|
||
| Retail / Pharmacy | 1 | $148B |
|
||
| Agriculture / Food | 1 | $86B |
|
||
Price history
-4.3% since first listed41 events — show timeline
- 2026-04-29 Contingent — MRED as Distributed by MLS Grid
- 2026-03-20 Contingent — MRED as Distributed by MLS Grid
- 2026-03-20 Listing Removed — MRED as Distributed by MLS Grid
- 2026-02-16 Listing Removed — MRED as Distributed by MLS Grid
- 2026-02-16 Listed — MRED as Distributed by MLS Grid
- 2026-02-07 Listing Removed — MRED as Distributed by MLS Grid
- 2026-02-07 Listed — MRED as Distributed by MLS Grid
- 2026-01-28 Listing Removed — MRED as Distributed by MLS Grid
- 2026-01-28 Listed — MRED as Distributed by MLS Grid
- 2026-01-05 Listing Removed — MRED as Distributed by MLS Grid
- 2026-01-05 Listed — MRED as Distributed by MLS Grid
- 2025-12-08 Listing Removed — MRED as Distributed by MLS Grid
- 2025-12-08 Listed — MRED as Distributed by MLS Grid
- 2025-10-28 Listed — MRED as Distributed by MLS Grid
- 2025-10-15 Contingent — MRED as Distributed by MLS Grid
- 2025-10-15 Listing Removed — MRED as Distributed by MLS Grid
- 2025-10-09 Listing Removed — MRED as Distributed by MLS Grid
- 2025-10-09 Listed — MRED as Distributed by MLS Grid
- 2025-10-07 Price Changed — MRED as Distributed by MLS Grid
- 2025-10-03 Price Changed — MRED as Distributed by MLS Grid
- 2025-09-26 Price Changed — MRED as Distributed by MLS Grid
- 2025-09-20 Price Changed — MRED as Distributed by MLS Grid
- 2025-09-10 Listing Removed — MRED as Distributed by MLS Grid
- 2025-09-10 Listed — MRED as Distributed by MLS Grid
- 2025-09-07 Price Changed — MRED as Distributed by MLS Grid
- 2025-09-02 Listing Removed — MRED as Distributed by MLS Grid
- 2025-09-02 Listed — MRED as Distributed by MLS Grid
- 2025-08-31 Price Changed — MRED as Distributed by MLS Grid
- 2025-08-21 Listed — MRED as Distributed by MLS Grid
- 2023-04-05 Sold (Public Records) $220,000 Public Records
- 2023-03-14 Sold (MLS) $229,900 MRED as Distributed by MLS Grid
- 2023-02-21 Contingent — MRED as Distributed by MLS Grid
- 2023-02-11 Listed $229,900 MRED as Distributed by MLS Grid
- 2017-01-03 Listing Removed — MRED as Distributed by MLS Grid
- 2016-12-28 Price Changed — MRED as Distributed by MLS Grid
- 2016-12-13 Price Changed — MRED as Distributed by MLS Grid
- 2016-11-23 Price Changed — MRED as Distributed by MLS Grid
- 2016-11-03 Price Changed — MRED as Distributed by MLS Grid
- 2016-10-12 Price Changed — MRED as Distributed by MLS Grid
- 2016-08-19 Price Changed — MRED as Distributed by MLS Grid
- 2016-07-29 Listed — MRED as Distributed by MLS Grid
Property tax history
+9.1%/yrLatest (2023): $5,695 · -13.7% YoY. Source: county tax records.
Cash-flow waterfall
monthlySold comps — $/sqft
last 12 mo · ≤1 miLoading sold comps…