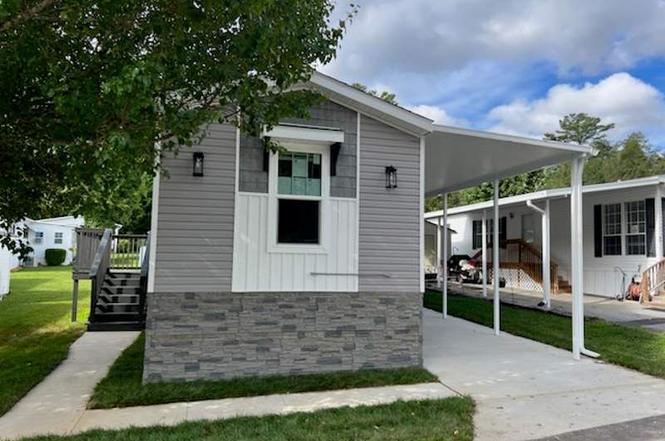
52 Blue Spruce Ln · Flat Rock, NC
Flood risk 1/10 · Minimal
- FEMA flood zone
- X (unshaded)
- Chance of flooding over 30 yrs
- 0.0%
- Est. flood insurance / yr
- $507 – $1,088
Fire risk 3/10 · Minor
- Est. fire insurance / yr
- $906 – $1,684
Heat risk 4/10 · Minor
- Hot days now (above 98°F)
- 7 days/yr
- Hot days in 30 yrs
- 17 days/yr
Wind risk 2/10 · Minimal
- Chance of severe wind over 30 yrs
- —
Air-quality risk 3/10 · Minor
- Unhealthy air days now
- 2 days/yr
- Unhealthy air days in 30 yrs
- 3 days/yr
Risk factors via First Street. Map © Google.
Why this score? — see what drove the C+ grade
The composite is a weighted blend of 9 inputs, each scored 0–100. Each bar is that input's sub-score; the figure is the points it added to the 100-point composite (weight × sub-score).
- Cash flow +26.8/30.0
- DSCR +9.2/10.0
- ARV discount +7.5/15.0
- 1% rule +7.2/10.0
- Schools +4.2/10.0
- Livability +3.2/5.0
- Rent growth +2.5/5.0
- Condition / age +2.5/5.0
- Appreciation +0.0/10.0
$109,900
🖨 Deal sheet 📄 Offer letter ✓ Due diligence
Key facts
- En-suite bathroom
- Modern fixtures
- Open-concept living
Tags
Property features AI
Finance
- Financial info: List price $109,900
Exterior
- Home design: Spec new construction (plan: 52 Blue Spruce Ln.); Single-level (entry level not specified)
- Construction: Built/updated most recently listed in 2025
Interior
- Bedrooms: 2 bedrooms
- Bathrooms: 2 full bathrooms
- Interior features: Living area approximately 832
Neighborhood map
What this means for you Summary
Snapshot
- This is a 2-bed/2.0-bath manufactured listed at $110k.
Deal economics
- At list price, monthly cash flow is $302 ($4k/yr) — positive.
- The deal already cash-flows at list — no discount required.
- Meets the 1% rule at list price ($1k rent vs $110k).
- Recommended offer: $97k (12.0% below list) — sets the bar for market timing.
- Cap rate 9.6% vs local median 1.5% in Flat Rock — top-decile yield for the area; either an underpriced asset or a hidden risk that comps aren't pricing in. Stress-test before assuming the spread holds.
Location & tenants
- Location reads 65/100 on livability (#330 in NC) — a middle-class / working-renter tenant base. Strengths: crime A+, employment A+, housing A; Watch: amenities F, commute F, cost of living F.
- Henderson County Schools (suburban): math 48% / reading 52% proficiency, ranked #64 of 178 in NC (top 36%) — acceptable for families but not a draw, mixed tenant base, ~2y average lease.
- Market conditions: 408 active listings in the ZIP; 3 comparable units currently listed for rent nearby; rentals at typical pace (median 24d on market — plan ~3-4 weeks tenant-placement turnaround); 1,534 units permitted in Henderson County in 2024 (558 in 5+ unit buildings).
Forward outlook
- Local home prices are declining (-3.0%/yr); year-one equity from $760 of loan paydown is wiped out by about $3k of value loss. Plan a longer hold.
- Henderson County population projected at +20% by 2050 — long-run rental-demand tailwind backs the buy-and-hold thesis.
- At projected returns (-3.0% appreciation + 3.0% rent growth), your $31k cash investment doubles in ~10 years — after that, you're playing with house money.
Negotiation context
- It's been on market 399 days — a 12% lower offer ($97k) is reasonable based on typical stale-listing flexibility.
Questions for the listing agent
- It's been on market 399 days. Have you received any prior offers? Is the seller open to a 12% concession, seller financing, or rate buy-down credit?
- Why hasn't it sold? Are there any deal-killer items the seller is aware of (foundation, flood, title, zoning, code violations)?
- Is there a deadline driving the sale (1031 exchange, divorce, estate, relocation)? That informs how much negotiation room exists.
- Schools are B-rated — typically a magnet for longer-tenancy family renters. What's the average tenant stay here, and is there a school-zone premium baked into asking?
- What's the average days-on-market for RENTAL listings here right now (not sales)? A rising rental-DOM trend means longer vacancies and softer asking-rent achievability than the comps imply.
- What's the recent tenant-quality profile in this submarket — average credit score on applications, eviction rate, late-payment / NSF rate, and stable-employment percentage? A property-management company in the area should have these aggregated.
- How much new for-sale + rental construction is in the pipeline within 1–3 miles? Heavy new supply typically softens prices + rents 12–24 months out; constrained supply supports both.
Investment metrics
- 1% rule
- 1.22% ✓
- Cap rate
- 9.59%
- Cash-on-cash
- 11.77%
- DSCR
- 1.52
- GRM
- 6.8
CMA / ARV
No comps found within radius.
Projected returns pro-forma
-3.0% appreciation · 3.0% rent growth · sell at horizon
- IRR
- 1.2%
- Equity multiple
- 1.05×
- Total profit
- $1,433
- Equity at exit
- $16,386
- IRR
- 10.9%
- Equity multiple
- 1.85×
- Total profit
- $26,081
- Equity at exit
- $9,502
Cash invested: $30,772 (down + closing). Projections, not guarantees.
Landlord ↔ Tenant lean methodology
- Overall (STATE)
- 85 Strongly Landlord-Friendly
- State North Carolina
- 85 Strongly Landlord-Friendly · R+3
- County
- — inherits STATE
- City
- — inherits STATE
ZIP-level market 28739
- Active inventory
- 408
- Price-to-rent
- 6.8×
Monthly cashflow live
- Estimated rent
- $1,343 medium interval (Pro) →
- Mortgage (P&I)
- −$576
- Tax est. 1.5%
- −$137 /mo · $1,648/yr
- Insurance
- −$46
- HOA
- −$0
- Vacancy / Maint / Mgmt
- −$282
- Net cashflow
- $302
Break-even live
UW: 25.0% down · 7.5% · 30yr · 1.5% tax · 5.0% vac · 8.0% maint · 8.0% mgmt
Financing live
Cash to close
- Down payment
- $27,475
- Closing costs
- $3,297
- Reserves months
- —
- Total cash needed
- —
Loan-product check · same deal, 3 products live
Conventional
25% down · 7.5% · 30yr
- Down + closing
- —
- Monthly P&I
- —
- Monthly cashflow
- —
- DSCR
- —
- Eligible?
- —
Personal DTI + credit; lowest rate.
DSCR
20% down · 8.5% · 30yr
- Down + closing
- —
- Monthly P&I
- —
- Monthly cashflow
- —
- DSCR
- —
- Eligible?
- —
No personal income docs; deal must DSCR.
Hard money
10% down · 12.0% · 12mo
- Down + closing
- —
- Monthly P&I
- —
- Monthly cashflow
- —
- DSCR
- —
- Eligible?
- —
Short-term bridge; refi at stabilization.
Rent comps 3 comps
| Address | Beds | Baths | Sqft | Rent | $/sqft | DOM | Units | Dist |
|---|---|---|---|---|---|---|---|---|
| 201 Dogwood Path Ln Hendersonville, NC | 1.0 | 1.0 | 660 | $1,200 | $1.82 | 23d | 1 | 1.07mi |
| 52 Charleston View Ct Hendersonville, NC | 2.0 | 1.0 | 887 | $1,395 | $1.57 | 23d | 1 | 1.27mi |
| 61 Charleston Ct Hendersonville, NC | 2.0 | 2.0 | 1024 | $1,455 | $1.42 | 23d | 1 | 1.33mi |
Listing history 16 events
-
2026-06-18days on market $109,900 Active 399 DOM
-
2026-06-17days on market $109,900 Active 398 DOM
-
2026-06-16days on market $109,900 Active 397 DOM
-
2026-06-15days on market $109,900 Active 396 DOM
-
2026-06-14days on market $109,900 Active 394 DOM
-
2026-06-13days on market $109,900 Active 393 DOM
-
2026-06-10days on market $109,900 Active 391 DOM
-
2026-06-09days on market $109,900 Active 390 DOM
-
2026-06-08days on market $109,900 Active 389 DOM
-
2026-06-07days on market $109,900 Active 388 DOM
-
2026-06-05days on market $109,900 Active 385 DOM
-
2026-06-03days on market $109,900 Active 384 DOM
-
2026-06-02days on market $109,900 Active 383 DOM
-
2026-06-01days on market $109,900 Active 382 DOM
-
2026-05-31days on market $109,900 Active 381 DOM
-
2026-05-30days on market $109,900 Active 380 DOM
ⓘ Source: listings_history table (triggers on properties + properties_extension) + one-shot
backfill from property_details.listing_events for pre-trigger history.
Climate risk First Street
- Flood 1/10 Low FEMA zone X (unshaded) · 0% chance over 30 yrs
- Wildfire 3/10 Moderate
- Heat 4/10 Moderate 7 d/yr ≥98°F today · 17 d/yr by 30 yrs out
- Wind 2/10 Low
- Air quality 3/10 Moderate 2 unhealthy d/yr today · 3 by 30 yrs out
Nearby sold comps map
Loading sold comps map…
Walkable amenities ~0.75 mi
Loading nearby amenities…
Taxation est. · year 1
- Rental income
- $16,121
- − Mortgage interest
- −$6,156
- − Property taxes
- −$1,648
- − Insurance
- −$550
- − Repairs & maintenance
- −$1,290
- − Management
- −$1,290
- − Depreciation
- −$3,197
- Taxable income
- $1,990
- Est. tax owed @ 24.0%
- −$478
- After-tax cash flow
- $3,144/yr
For passive investors: Depreciation is non-cash, so a rental often shows a tax loss while cash-flowing — sheltering income. Rental losses are passive: they offset passive income freely, and up to $25,000/yr can offset ordinary (W-2) income if you actively participate and your MAGI is under $100k (phasing out to $0 by $150k); unused losses carry forward. On sale, claimed depreciation is recaptured at up to 25%, and gains may owe capital-gains tax (a 1031 exchange can defer both). Figures are a year-1 estimate at your 24.0% rate — not tax advice; consult a CPA.
Schools (NCES district)
- District
- Henderson County Schools
- NCES district ID
- 3702100
- Math proficiency
- 48% ▼ -2.00%
- Reading proficiency
- 52% ▼ -2.00%
- Median HH income
- $47,101
- Composite
- 42.5/100
- National rank
- #3206
- State rank
- #64 of 178 in NC
Livability — Flat Rock
- Score
- 65/100
- State rank
- #330
- US rank
- #13447
Category grades
Schools grade is shown separately in the Schools card above.
Census & demographics
- Population (ZIP)
- 20,656
Population outlook (Henderson County) Hauer SSP2
- Today (2025)
- 124,075 people
- By 2030
- 129,690 · +4.5%
- By 2040
- 139,898 · +12.8%
- By 2050
- 148,298 · +19.5%
- By 2075
- 163,980 · +32.2%
- By 2100
- 166,962 · +34.6%
Race, ethnicity, and origin ACS 2023
- Neighborhood character
- Predominantly White (86%)
- Race & ethnicity
- White 86% Hispanic / Latino 7% Two or more races 6% Black 3% Asian 1%
- Hispanic origin (detail)
- Mexican 3% Puerto Rican 1%
- Common ancestry
- Serbian 3% Slovak 3% Lithuanian 2%
- Foreign-born
- 5% · Canada, China
- Languages at home
- 93% English-only · Spanish 5% German/W. Germanic 1% Chinese 1%
Political lean MEDSL · Henderson
- 2024 margin
- R (+14.6) · D 42.1% · R 56.7% · Other 1.1%
- 2008→2024 swing
- +6.5pp toward D · 2008: -21.0pp · 2024: -14.6pp
- All cycles
- 2024: R+14.6 2020: R+18.8 2016: R+27.9 2012: R+27.6 2008: R+21.0
Not yet ingested
- Civics
- —
Market trends
- HPI YoY
- ▼ -171.47%
- Current HPI
- 199.0914
- Rent YoY
- —
- Metro
- —
- State GDP YoY
- ▲ 3.28%
- F500 in state
- 26
Industry mix (Fortune 500 HQ in NC)
| Industry | F500 HQs | Revenue |
|---|---|---|
| Financial Services | 2 | $213B |
|
||
| Retail | 2 | $95B |
|
||
| Industrial Conglomerate | 1 | $38B |
|
||
| Metals / Steel | 1 | $35B |
|
||
| Utilities | 1 | $30B |
|
||
| Industrial Machinery | 1 | $19B |
|
||
Cash-flow waterfall
monthlySold comps — $/sqft
last 12 mo · ≤1 miLoading sold comps…