345 Drysdale Rd · Carthage, MS
Flood risk 1/10 · Minimal
- FEMA flood zone
- X (unshaded)
- Chance of flooding over 30 yrs
- 0.0%
- Est. flood insurance / yr
- $507 – $1,088
Fire risk 4/10 · Minor
- Est. fire insurance / yr
- $1,241 – $2,305
Heat risk 6/10 · Moderate
- Hot days now (above 108°F)
- 7 days/yr
- Hot days in 30 yrs
- 21 days/yr
Wind risk 6/10 · Moderate
- Chance of severe wind over 30 yrs
- 76.0%
Air-quality risk 1/10 · Minimal
- Unhealthy air days now
- 0 days/yr
- Unhealthy air days in 30 yrs
- 0 days/yr
Risk factors via First Street. Map © Google.
Why this score? — see what drove the D grade
The composite is a weighted blend of 9 inputs, each scored 0–100. Each bar is that input's sub-score; the figure is the points it added to the 100-point composite (weight × sub-score).
- Cash flow +10.4/30.0
- Appreciation +9.5/10.0
- ARV discount +7.5/15.0
- DSCR +3.0/10.0
- Livability +3.0/5.0
- Rent growth +2.5/5.0
- Condition / age +2.5/5.0
- 1% rule +1.8/10.0
- Schools +1.3/10.0
$157,000
🖨 Deal sheet 📄 Offer letter ✓ Due diligence
Listing remarks MLS
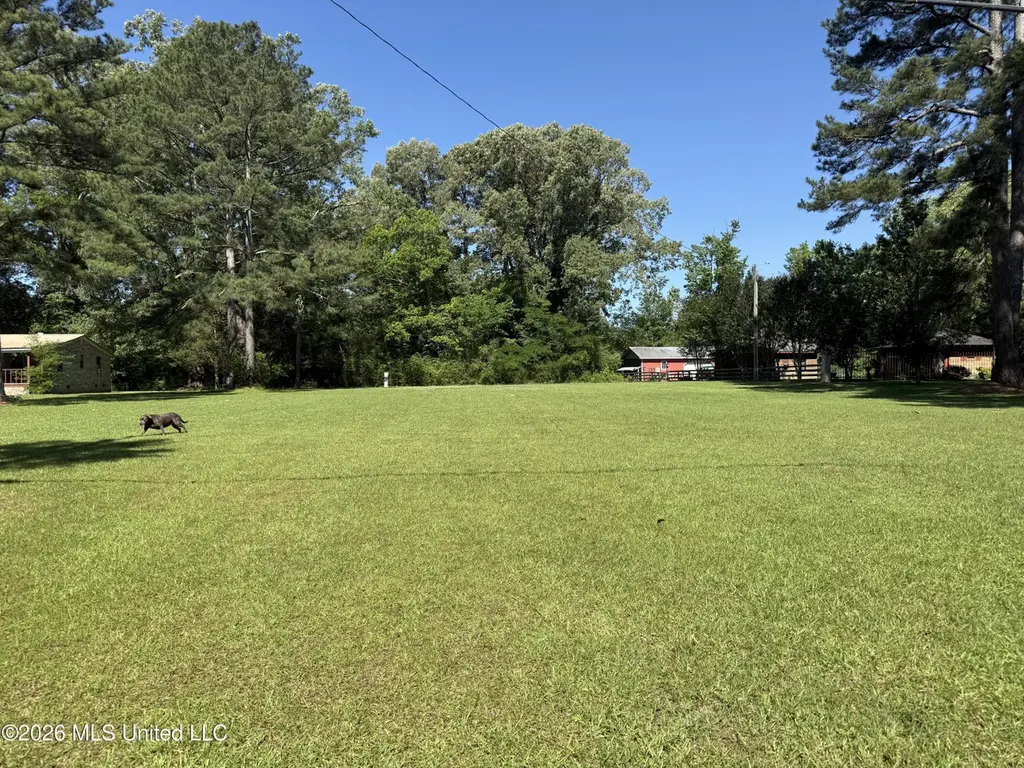
This rare 2 acre tract of land is absolutly beautiful. You would be hard pressed to find another lot this size that is this mature outside of the city limits. This lot has a wonderful foundation of St Augustine grass and is 300' deep before you get to the wooded part of the property. A wonderful place to build a shop, mobile home, or single family home. The property is in the county so there are no restrictions.
Key facts
- 1.3 acre lot
- 4 parking spots
- Built 1960
Property features AI
Exterior
- Parking: Detached carport with space for 4 vehicles; Gravel driveway/parking
- Utilities: Septic tank; Community water; Electricity connected; Propane connected; Water connected
- Home design: Single-family house; One story; Move-in ready
- Construction: Brick veneer and wood siding exterior; Metal roof; Conventional foundation; Built in (year from public records)
- Exterior features: Cleared, mostly level yard with some trees and landscaping; Front yard
Interior
- Flooring: Luxury vinyl flooring
- Bathrooms: 2 full bathrooms
- Heating & cooling: Central electric heating; Central air conditioning
- Interior features: Ceiling fans
- Laundry & utility: Dedicated laundry room
Neighborhood map
What this means for you Summary
Snapshot
- This is a 2-bed/2.0-bath single-family listed at $157k.
Deal economics
- At list price, monthly cash flow is $-83 ($-999/yr) — negative.
- To cash-flow at today's rent, offer at most $142k (9.4% below list).
- To meet the 1% rule (rent ≥ 1% of price), the offer needs to be $107k (31.7% below list).
- Recommended offer: $107k (31.7% below list) — sets the bar for 1% rule.
Location & tenants
- Location reads 59/100 on livability (#243 in MS) — a working-class tenant base; expect higher turnover. Strengths: crime A+, cost of living A+, housing A+; Watch: schools F, amenities F, commute F.
- Leake County School District (town): math 11% / reading 22% proficiency, ranked #102 of 130 in MS (top 78%) — low school quality limits family demand, transient renter base, plan for 1-2y turnover; 83% free/reduced lunch — lower-income household profile, screen leases tightly.
- Market conditions: 81 active listings in the ZIP.
Forward outlook
- In year one you build about $15k of equity ($1k loan paydown + $14k appreciation (9.0% local appreciation)).
- Leake County population projected at -26% by 2050 — secular population decline; favor cash flow + early exit over multi-decade hold.
- At projected returns (9.0% appreciation + 3.0% rent growth), your $44k cash investment doubles in ~3 years — after that, you're playing with house money.
- By year 3, paydown + projected appreciation supports a ~$38k cash-out refi (75% LTV) — recoverable capital for the next deal without selling this one.
Negotiation context
- It's been on market 21 days — a 2% lower offer ($155k) is reasonable based on typical stale-listing flexibility.
- 4 sale attempts since 18y ago with the ask held roughly flat each time — persistent listings suggest the price (not the market) is what's stuck; bring a comps-based counter.
Risks & watch-outs
- Climate carrying-cost: major wind risk, 76% chance of damaging wind over 30y; extreme-heat days projected 7→21/yr by 2055 (HVAC capex compounding) — expect insurance premiums to compound above CPI over the hold.
Questions for the listing agent
- What do current leases actually rent for vs. the listed asking? Can we see a recent rent roll and the last 12 months of T-12 income?
- Built in 1960 — when were the roof, HVAC, electrical panel, plumbing, and water heater last replaced?
- Is there a deadline driving the sale (1031 exchange, divorce, estate, relocation)? That informs how much negotiation room exists.
- Schools are F-rated, which usually means shorter tenancies and higher turnover. Who's the typical renter profile here, and what's been the actual vacancy rate?
- The area grade is low — what's the realistic commute time and amenity access for the typical tenant pool here? Any planned neighborhood developments (good or bad) we should know about?
- What's the average days-on-market for RENTAL listings here right now (not sales)? A rising rental-DOM trend means longer vacancies and softer asking-rent achievability than the comps imply.
- What's the recent tenant-quality profile in this submarket — average credit score on applications, eviction rate, late-payment / NSF rate, and stable-employment percentage? A property-management company in the area should have these aggregated.
- How much new for-sale + rental construction is in the pipeline within 1–3 miles? Heavy new supply typically softens prices + rents 12–24 months out; constrained supply supports both.
Investment metrics
- 1% rule
- 0.68% ✗
- Cap rate
- 5.66%
- Cash-on-cash
- -2.27%
- DSCR
- 0.90
- GRM
- 12.2
CMA / ARV
- ARV (on-the-fly)
- $319,440
- Comps found
- 1
Show comp detail 1 sale within ~0.75 mi
| Address | Dist | Beds/Ba | Sqft | Sold | Price | $/sf | Match |
|---|---|---|---|---|---|---|---|
| 1998 Ms-16 West | 0.54mi | 2/2.0 | 1,400 (+6%) | 11mo | $339,000 | $242 | 55 |
Match score weights: distance 35% · size 25% · config 20% · recency 20%. Top-matched comps best support the ARV.
Projected returns pro-forma
8.96% appreciation · 3.0% rent growth · sell at horizon
- IRR
- 20.4%
- Equity multiple
- 2.57×
- Total profit
- $69,054
- Equity at exit
- $129,659
- IRR
- 18.7%
- Equity multiple
- 5.67×
- Total profit
- $205,138
- Equity at exit
- $267,960
Cash invested: $43,960 (down + closing). Projections, not guarantees.
Landlord ↔ Tenant lean methodology
- Overall (STATE)
- 90 Strongly Landlord-Friendly
- State Mississippi
- 90 Strongly Landlord-Friendly · R+11
- County
- — inherits STATE
- City
- — inherits STATE
ZIP-level market 39051
- Home prices YoY
- 5.9%
- Active inventory
- 81
- Price-to-rent
- 12.2×
Monthly cashflow live
- Estimated rent
- $1,073 medium interval (Pro) →
- Mortgage (P&I)
- −$823
- Tax from tax record
- −$42 /mo · $504/yr
- Insurance
- −$65
- HOA
- −$0
- Vacancy / Maint / Mgmt
- −$225
- Net cashflow
- $-83
Break-even live
UW: 25.0% down · 7.5% · 30yr · 1.5% tax · 5.0% vac · 8.0% maint · 8.0% mgmt
Financing live
Cash to close
- Down payment
- $39,250
- Closing costs
- $4,710
- Reserves months
- —
- Total cash needed
- —
Loan-product check · same deal, 3 products live
Conventional
25% down · 7.5% · 30yr
- Down + closing
- —
- Monthly P&I
- —
- Monthly cashflow
- —
- DSCR
- —
- Eligible?
- —
Personal DTI + credit; lowest rate.
DSCR
20% down · 8.5% · 30yr
- Down + closing
- —
- Monthly P&I
- —
- Monthly cashflow
- —
- DSCR
- —
- Eligible?
- —
No personal income docs; deal must DSCR.
Hard money
10% down · 12.0% · 12mo
- Down + closing
- —
- Monthly P&I
- —
- Monthly cashflow
- —
- DSCR
- —
- Eligible?
- —
Short-term bridge; refi at stabilization.
Listing history 11 events
-
2026-06-04days on market $157,000 Active 21 DOM
-
2026-06-02days on market $157,000 Active 20 DOM
-
2026-06-01days on market $157,000 Active 19 DOM
-
2026-05-31days on market $157,000 Active 18 DOM
-
2026-05-13$20,000 Active 419-char remark
Show marketing remark (419 chars)
This rare 2 acre tract of land is absolutly beautiful. You would be hard pressed to find another lot this size that is this mature outside of the city limits. This lot has a wonderful foundation of St Augustine grass and is 300' deep before you get to the wooded part of the property. A wonderful place to build a shop, mobile home, or single family home. The property is in the county so there are no restrictions.
-
2026-05-13$157,000 Active
Show marketing remark (419 chars)
This rare 2 acre tract of land is absolutly beautiful. You would be hard pressed to find another lot this size that is this mature outside of the city limits. This lot has a wonderful foundation of St Augustine grass and is 300' deep before you get to the wooded part of the property. A wonderful place to build a shop, mobile home, or single family home. The property is in the county so there are no restrictions.
-
2021-10-02historical
-
2018-04-05$85,000
-
2009-06-22soldstatus
-
2008-12-15$98,900
-
2006-09-20soldstatus
ⓘ Source: listings_history table (triggers on properties + properties_extension) + one-shot
backfill from property_details.listing_events for pre-trigger history.
Tax reassessment forecast MS · Resets to sale price
- Current annual tax
- $504 · $42/mo
- Projected year-2 tax
- $1,240 · $103/mo
- Expected delta
- +$737/yr (+$61/mo · 146.2%)
ⓘ Screening estimate from a state-policy table — verify with the county assessor before closing.
Climate risk First Street
- Flood 1/10 Low FEMA zone X (unshaded) · 0% chance over 30 yrs
- Wildfire 4/10 Moderate
- Heat 6/10 Major 7 d/yr ≥108°F today · 21 d/yr by 30 yrs out
- Wind 6/10 Major 76% chance of damaging wind over 30 yrs
- Air quality 1/10 Low 0 unhealthy d/yr today · 0 by 30 yrs out
Nearby sold comps map
Loading sold comps map…
Walkable amenities ~0.75 mi
Loading nearby amenities…
Taxation est. · year 1
- Rental income
- $12,873
- − Mortgage interest
- −$8,794
- − Property taxes
- −$504
- − Insurance
- −$785
- − Repairs & maintenance
- −$1,030
- − Management
- −$1,030
- − Depreciation
- −$4,567
- Taxable loss
- −$3,837
- Est. tax savings @ 24.0%
- +$921
- After-tax cash flow
- $-78/yr
For passive investors: Depreciation is non-cash, so a rental often shows a tax loss while cash-flowing — sheltering income. Rental losses are passive: they offset passive income freely, and up to $25,000/yr can offset ordinary (W-2) income if you actively participate and your MAGI is under $100k (phasing out to $0 by $150k); unused losses carry forward. On sale, claimed depreciation is recaptured at up to 25%, and gains may owe capital-gains tax (a 1031 exchange can defer both). Figures are a year-1 estimate at your 24.0% rate — not tax advice; consult a CPA.
Schools (NCES district)
- District
- Leake County School District
- NCES district ID
- 2802520
- Math proficiency
- 11% ▼ -21.00%
- Reading proficiency
- 22% ▼ -9.00%
- Median HH income
- $32,894
- Composite
- 13.33/100
- National rank
- #9538
- State rank
- #102 of 130 in MS
Livability — Carthage
- Score
- 59/100
- State rank
- #243
- US rank
- #20150
Category grades
Schools grade is shown separately in the Schools card above.
Census & demographics
- Population (ZIP)
- 15,242
Population outlook (Leake County) Hauer SSP2
- Today (2025)
- 21,382 people
- By 2030
- 20,405 · -4.6%
- By 2040
- 18,208 · -14.8%
- By 2050
- 15,732 · -26.4%
- By 2075
- 9,562 · -55.3%
- By 2100
- 5,455 · -74.5%
Race, ethnicity, and origin ACS 2023
- Neighborhood character
- Diverse neighborhood (Simpson 0.62)
- Race & ethnicity
- White 47% Black 39% Hispanic / Latino 8% Native American 5% Two or more races 2%
- Hispanic origin (detail)
- Mexican 2%
- Common ancestry
- Slovak 1% Lithuanian 1% Serbian 1%
- Foreign-born
- 4% · Canada
- Languages at home
- 90% English-only · Spanish 7%
Political lean MEDSL · Leake
- 2024 margin
- Strong R (+23.4) · D 38.0% · R 61.4%
- 2008→2024 swing
- -12.7pp toward R · 2008: -10.7pp · 2024: -23.4pp
- All cycles
- 2024: R+23.4 2020: R+14.5 2016: R+14.2 2012: R+8.6 2008: R+10.7
Not yet ingested
- Civics
- —
Market trends
- HPI YoY
- ▲ 8.96%
- Current HPI
- 161.5452
- Rent YoY
- —
- Metro
- —
- State GDP YoY
- —
- F500 in state
- 0
Price history
+58.7% since first listed7 events — show timeline
- 2026-05-13 Listed $157,000 MLSU
- 2026-05-13 Listed $20,000 MLSU
- 2021-10-02 Listing Removed — MLSU
- 2018-04-05 Listed $85,000 MLSU
- 2009-06-22 Sold (MLS) — MLSU
- 2008-12-15 Listed $98,900 MLSU
- 2006-09-20 Sold (Public Records) — Public Records
Property tax history
+11.0%/yrLatest (2025): $504 · +249.8% YoY. Source: county tax records.
Cash-flow waterfall
monthlySold comps — $/sqft
last 12 mo · ≤1 miLoading sold comps…