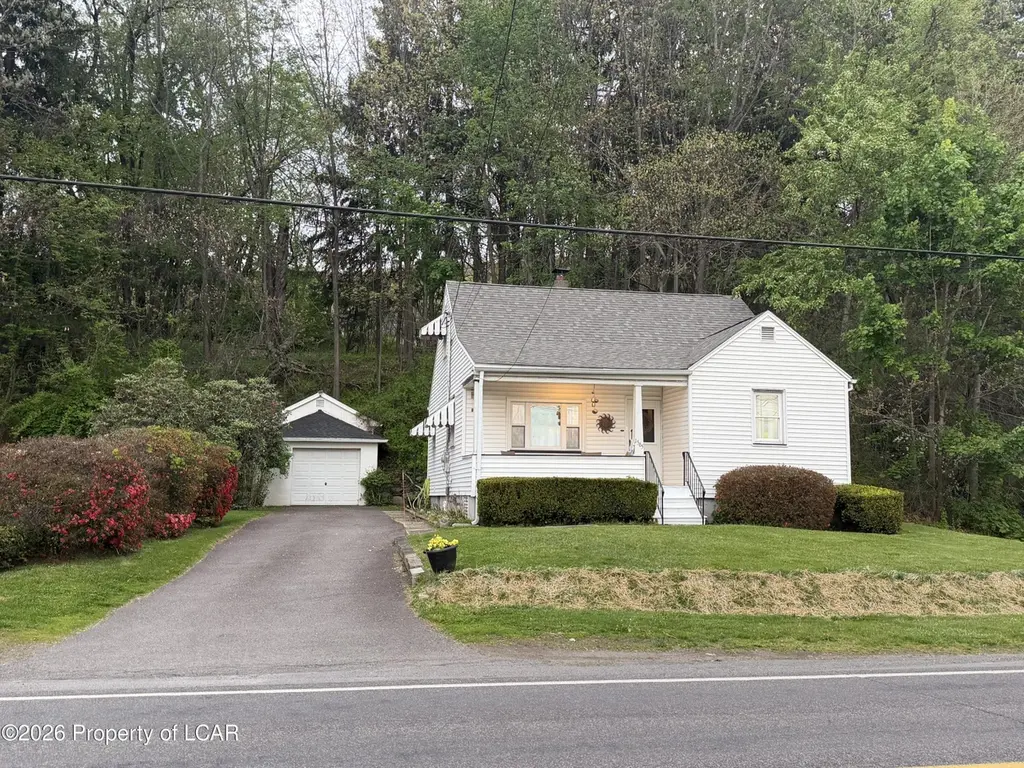
1565 Shoemaker Ave · West Wyoming, PA
Flood risk 9/10 · Severe
- FEMA flood zone
- X (unshaded)
- Chance of flooding over 30 yrs
- 0.98%
- Est. flood insurance / yr
- $507 – $1,088
Fire risk 3/10 · Minor
- Est. fire insurance / yr
- $511 – $949
Heat risk 4/10 · Minor
- Hot days now (above 97°F)
- 7 days/yr
- Hot days in 30 yrs
- 17 days/yr
Wind risk 3/10 · Minor
- Chance of severe wind over 30 yrs
- 4.0%
Air-quality risk 3/10 · Minor
- Unhealthy air days now
- 2 days/yr
- Unhealthy air days in 30 yrs
- 4 days/yr
Risk factors via First Street. Map © Google.
Why this score? — see what drove the D- grade
The composite is a weighted blend of 9 inputs, each scored 0–100. Each bar is that input's sub-score; the figure is the points it added to the 100-point composite (weight × sub-score).
- Cash flow +12.2/30.0
- ARV discount +9.1/15.0
- DSCR +3.6/10.0
- Livability +3.6/5.0
- 1% rule +3.2/10.0
- Schools +3.2/10.0
- Rent growth +2.5/5.0
- Condition / age +2.5/5.0
- Appreciation +0.0/10.0
$200,000
🖨 Deal sheet (PDF) 📄 Offer letter ✓ Due diligence
Listing remarks MLS
Look no further! 4 bedroom, large fenced in yard, garage, finished, lower level, new roof, new windows, new H2O heater in Wyoming Area School District. What more can you ask for - oh wait - privacy, hardwood floors under carpeting and fabulously maintained! This one has it all!
Key facts
- Large privacy
- Outdoor space
- Hardwood floors
Tags
Property features AI
Exterior
- Parking: Detached 1-car garage
- Utilities: Public water; Public sewer
- Home design: Single-family residence; Two-story
- Construction: Aluminum siding
- Exterior features: Fenced yard; Cleared lot
Interior
- Kitchen: Electric water heater
- Flooring: Hardwood floors
- Bathrooms: 1 full bathroom
- Heating & cooling: Oil heating; Baseboard heat
- Interior features: Eat-in kitchen; Finished basement
Neighborhood map
What this means for you Summary
Snapshot
- This is a 4-bed/1.0-bath single-family listed at $200k.
Deal economics
- At list price, monthly cash flow is $-106 ($-1k/yr) — negative.
- To cash-flow at today's rent, offer at most $181k (9.4% below list).
- To meet the 1% rule (rent ≥ 1% of price), the offer needs to be $165k (17.5% below list).
- Recommended offer: $165k (17.5% below list) — sets the bar for 1% rule.
Location & tenants
- Location reads 72/100 on livability (#608 in PA) — a middle-class / working-renter tenant base. Strengths: crime A+, cost of living A+, housing A+; Watch: amenities F, commute F.
- Wyoming Area SD (suburban): math 24% / reading 51% proficiency, ranked #381 of 539 in PA (top 71%) — families likely to look elsewhere, expect single-tenant / working-renter base with shorter leases.
- Zoned schools: Wyoming Area Primary Ctr (math 37% / reading 57%, grade D-, #737 of 1,518 statewide, top 52%, 443 students, 99% FRL); Wyoming Area Intermediate Ctr (math 17% / reading 49%, grade F, #346 of 512 statewide, top 69%, 484 students, 100% FRL); Wyoming Area Sec Ctr (math 26% / reading 48%, grade F, #289 of 437 statewide, top 67%, 953 students, 99% FRL) — zoned schools average 99% FRL vs 32% district-wide (67 pts higher); higher-poverty schools than district average — tighter screening recommended.
- Market conditions: 30 active listings in the ZIP; 349 units permitted in Luzerne County in 2024 (16 in 5+ unit buildings).
Forward outlook
- Local home prices are declining (-3.0%/yr); year-one equity from $1k of loan paydown is wiped out by about $6k of value loss. Plan a longer hold.
- Luzerne County population projected at +4% by 2050 — modest demand growth; plan on rents tracking national, not racing it.
Negotiation context
- Only 7 days on market — expect competitive offers; lowballing is unlikely to land.
- 2 sale attempts since 7y ago with the ask held roughly flat each time — persistent listings suggest the price (not the market) is what's stuck; bring a comps-based counter.
- Current owner paid $120k; list at $200k implies a 67% gain — meaningful room to come down on a strong offer.
Risks & watch-outs
- Watch-outs: flood insurance adds $66/mo; built in 1950 — expect roof / HVAC / electrical / plumbing capex.
- Climate carrying-cost: severe flood risk — expect insurance premiums to compound above CPI over the hold.
Questions for the listing agent
- What do current leases actually rent for vs. the listed asking? Can we see a recent rent roll and the last 12 months of T-12 income?
- Built in 1950 — when were the roof, HVAC, electrical panel, plumbing, and water heater last replaced?
- What's the actual annual flood-insurance premium (NFIP or private), and is the property in a SFHA with mandatory coverage?
- Is there a deadline driving the sale (1031 exchange, divorce, estate, relocation)? That informs how much negotiation room exists.
- Schools are D-rated, which usually means shorter tenancies and higher turnover. Who's the typical renter profile here, and what's been the actual vacancy rate?
- The area grade is low — what's the realistic commute time and amenity access for the typical tenant pool here? Any planned neighborhood developments (good or bad) we should know about?
- What's the average days-on-market for RENTAL listings here right now (not sales)? A rising rental-DOM trend means longer vacancies and softer asking-rent achievability than the comps imply.
- What's the recent tenant-quality profile in this submarket — average credit score on applications, eviction rate, late-payment / NSF rate, and stable-employment percentage? A property-management company in the area should have these aggregated.
- How much new for-sale + rental construction is in the pipeline within 1–3 miles? Heavy new supply typically softens prices + rents 12–24 months out; constrained supply supports both.
Investment metrics
- 1% rule
- 0.82% ✗
- Cap rate
- 6.05%
- Cash-on-cash
- -0.85%
- DSCR
- 0.96
- GRM
- 10.1
CMA / ARV
- ARV (median comp)
- $207,276
- List price
- $200,000
- Delta
- -3.51%
- Verdict
- FAIR
- Comps
- 20 within 1.0 mi
Projected returns pro-forma
-3.0% appreciation · 3.0% rent growth · sell at horizon
- IRR
- -20.0%
- Equity multiple
- 0.30×
- Total profit
- $-39,132
- Equity at exit
- $29,821
- IRR
- -13.0%
- Equity multiple
- 0.24×
- Total profit
- $-42,617
- Equity at exit
- $17,292
Cash invested: $56,000 (down + closing). Projections, not guarantees.
Landlord ↔ Tenant lean methodology
- Overall (STATE)
- 62 Landlord-Friendly
- State Pennsylvania
- 62 Landlord-Friendly · EVEN
- County
- — inherits STATE
- City
- — inherits STATE
ZIP-level market 18644
- Home prices YoY
- -31.4%
- Active inventory
- 30
- Price-to-rent
- 10.1×
Monthly cashflow live
- Estimated rent
- $1,649 medium interval (Pro) →
- Mortgage (P&I)
- −$1,049
- Tax from tax record
- −$210 /mo · $2,524/yr
- Insurance
- −$83
- Flood insurance flood zone
- −$66 /mo · $798/yr
- HOA
- −$0
- Vacancy / Maint / Mgmt
- −$346
- Net cashflow
- $-106
Break-even live
Sensitivity live
| Price | -10% $7 | -5% $-50 | +0% $-106 | +5% $-163 | +10% $-219 |
|---|---|---|---|---|---|
| Rent | -10% $-236 | -5% $-171 | +0% $-106 | +5% $-41 | +10% $24 |
| Rate | -1.0pp $-5 | -0.5pp $-55 | base $-106 | +0.5pp $-158 | +1.0pp $-211 |
UW: 25.0% down · 7.5% · 30yr · 1.5% tax · 5.0% vac · 8.0% maint · 8.0% mgmt
Financing live
Cash to close
- Down payment
- $50,000
- Closing costs
- $6,000
- Reserves months
- —
- Total cash needed
- —
Loan-product check · same deal, 3 products live
Conventional
25% down · 7.5% · 30yr
- Down + closing
- —
- Monthly P&I
- —
- Monthly cashflow
- —
- DSCR
- —
- Eligible?
- —
Personal DTI + credit; lowest rate.
DSCR
20% down · 8.5% · 30yr
- Down + closing
- —
- Monthly P&I
- —
- Monthly cashflow
- —
- DSCR
- —
- Eligible?
- —
No personal income docs; deal must DSCR.
Hard money
10% down · 12.0% · 12mo
- Down + closing
- —
- Monthly P&I
- —
- Monthly cashflow
- —
- DSCR
- —
- Eligible?
- —
Short-term bridge; refi at stabilization.
Listing history 6 events
-
2026-05-13status Pending 338-char remark
-
2026-05-06$200,000 Active 338-char remark
-
2019-12-09soldstatus $120,000
-
2019-12-05soldstatus $120,000 278-char remark
Show marketing remark (278 chars)
Look no further! 4 bedroom, large fenced in yard, garage, finished, lower level, new roof, new windows, new H2O heater in Wyoming Area School District. What more can you ask for - oh wait - privacy, hardwood floors under carpeting and fabulously maintained! This one has it all!
-
2019-09-23$139,000 278-char remark
Show marketing remark (278 chars)
Look no further! 4 bedroom, large fenced in yard, garage, finished, lower level, new roof, new windows, new H2O heater in Wyoming Area School District. What more can you ask for - oh wait - privacy, hardwood floors under carpeting and fabulously maintained! This one has it all!
-
2013-09-20soldstatus $81,500
ⓘ Source: listings_history table (triggers on properties + properties_extension) + one-shot
backfill from property_details.listing_events for pre-trigger history.
Tax reassessment forecast PA · Partial reset (capped growth)
- Current annual tax
- $2,524 · $210/mo
- Projected year-2 tax
- $2,842 · $237/mo
- Expected delta
- +$318/yr (+$27/mo · 12.6%)
ⓘ Screening estimate from a state-policy table — verify with the county assessor before closing.
Climate risk First Street
- Flood 9/10 Extreme FEMA zone X (unshaded) · 98% chance over 30 yrs
- Wildfire 3/10 Moderate
- Heat 4/10 Moderate 7 d/yr ≥97°F today · 17 d/yr by 30 yrs out
- Wind 3/10 Moderate 4% chance of damaging wind over 30 yrs
- Air quality 3/10 Moderate 2 unhealthy d/yr today · 4 by 30 yrs out
Nearby sold comps map
Loading sold comps map…
Walkable amenities ~0.75 mi
Loading nearby amenities…
Taxation est. · year 1
- Rental income
- $19,788
- − Mortgage interest
- −$11,203
- − Property taxes
- −$2,524
- − Insurance
- −$1,798
- − Repairs & maintenance
- −$1,583
- − Management
- −$1,583
- − Depreciation
- −$5,818
- Taxable loss
- −$4,721
- Est. tax savings @ 24.0%
- +$1,133
- After-tax cash flow
- $-142/yr
For passive investors: Depreciation is non-cash, so a rental often shows a tax loss while cash-flowing — sheltering income. Rental losses are passive: they offset passive income freely, and up to $25,000/yr can offset ordinary (W-2) income if you actively participate and your MAGI is under $100k (phasing out to $0 by $150k); unused losses carry forward. On sale, claimed depreciation is recaptured at up to 25%, and gains may owe capital-gains tax (a 1031 exchange can defer both). Figures are a year-1 estimate at your 24.0% rate — not tax advice; consult a CPA.
Schools (NCES district)
- District
- Wyoming Area SD
- NCES district ID
- 4226730
- Math proficiency
- 24% ▼ -23.00%
- Reading proficiency
- 51% ▼ -13.00%
- Median HH income
- $48,856
- Composite
- 32.21/100
- National rank
- #5776
- State rank
- #381 of 539 in PA
Livability — West Wyoming
- Score
- 72/100
- State rank
- #608
- US rank
- #5858
Category grades
Schools grade is shown separately in the Schools card above.
Census & demographics
- Census place
- West Wyoming, PA
- Population (ZIP)
- 7,318
Population outlook (Luzerne County) Hauer SSP2
- Today (2025)
- 319,505 people
- By 2030
- 319,943 · +0.1%
- By 2040
- 322,643 · +1.0%
- By 2050
- 330,817 · +3.5%
- By 2075
- 379,145 · +18.7%
- By 2100
- 431,908 · +35.2%
Race, ethnicity, and origin ACS 2023
- Neighborhood character
- Predominantly White (96%)
- Race & ethnicity
- White 96% Hispanic / Latino 3% Two or more races 2%
- Common ancestry
- Romanian 24% Scotch-Irish 3% Iranian 2%
Political lean MEDSL · Luzerne
- 2024 margin
- R (+19.2) · D 40.0% · R 59.2%
- 2008→2024 swing
- -27.6pp toward R · 2008: 8.4pp · 2024: -19.2pp
- All cycles
- 2024: R+19.2 2020: R+14.4 2016: R+19.6 2012: D+4.8 2008: D+8.4
Not yet ingested
- Civics
- —
Market trends
- HPI YoY
- ▼ -109.68%
- Current HPI
- 239.2864
- Rent YoY
- —
- Metro
- —
- State GDP YoY
- ▲ 1.68%
- F500 in state
- 34
Industry mix (Fortune 500 HQ in PA)
| Industry | F500 HQs | Revenue |
|---|---|---|
| Healthcare | 2 | $309B |
|
||
| Insurance | 2 | $27B |
|
||
| Telecommunications / Media | 1 | $124B |
|
||
| Industrial Distribution | 1 | $22B |
|
||
| Financial Services | 1 | $20B |
|
||
| Chemicals / Materials | 1 | $18B |
|
||
Price history
+145.4% since first listed6 events — show timeline
- 2026-05-13 Pending — LCAR
- 2026-05-06 Listed $200,000 LCAR
- 2019-12-09 Sold (Public Records) $120,000 Public Records
- 2019-12-05 Sold (MLS) $120,000 LCAR
- 2019-09-23 Listed $139,000 LCAR
- 2013-09-20 Sold (Public Records) $81,500 Public Records
Property tax history
+3.3%/yrLatest (2026): $2,524 · +2.8% YoY. Source: county tax records.
Cash-flow waterfall
monthlySold comps — $/sqft
last 12 mo · ≤1 miLoading sold comps…