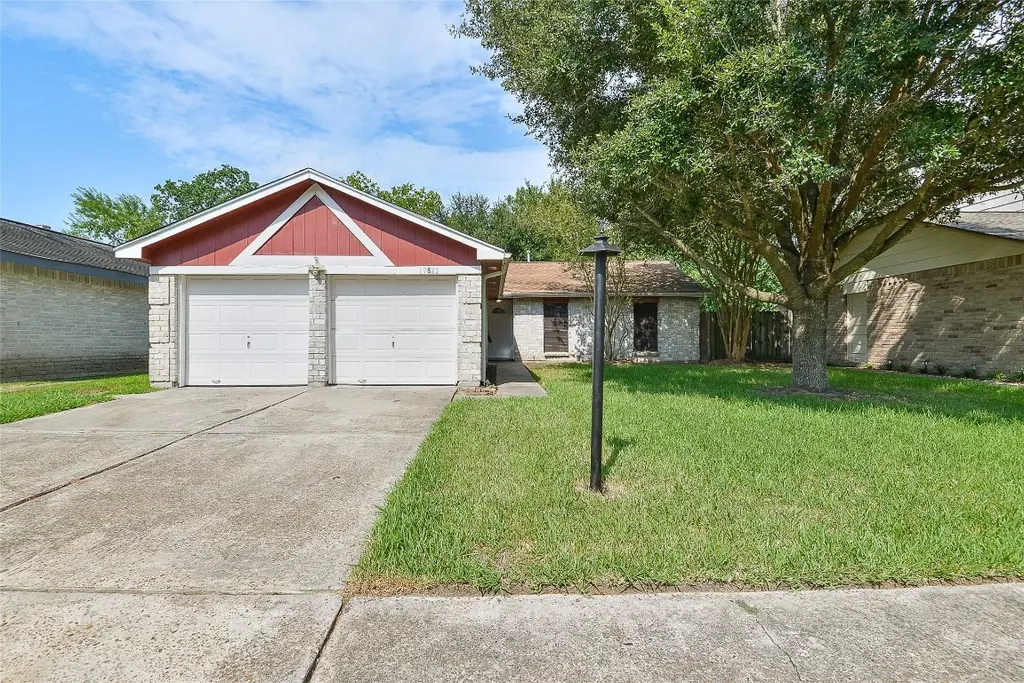
19823 Burle Oak Dr · Atascocita, TX
Flood risk 1/10 · Minimal
- FEMA flood zone
- X (unshaded)
- Chance of flooding over 30 yrs
- 0.0%
- Est. flood insurance / yr
- $507 – $1,088
Fire risk 1/10 · Minimal
- Est. fire insurance / yr
- $1,222 – $2,270
Heat risk 9/10 · Severe
- Hot days now (above 110°F)
- 7 days/yr
- Hot days in 30 yrs
- 24 days/yr
Wind risk 9/10 · Severe
- Chance of severe wind over 30 yrs
- 99.0%
Air-quality risk 3/10 · Minor
- Unhealthy air days now
- 3 days/yr
- Unhealthy air days in 30 yrs
- 3 days/yr
Risk factors via First Street. Map © Google.
Why this score? — see what drove the D- grade
The composite is a weighted blend of 9 inputs, each scored 0–100. Each bar is that input's sub-score; the figure is the points it added to the 100-point composite (weight × sub-score).
- Cash flow +11.6/30.0
- Appreciation +4.5/10.0
- ARV discount +4.1/15.0
- Schools +3.9/10.0
- 1% rule +3.7/10.0
- Livability +3.5/5.0
- DSCR +3.4/10.0
- Rent growth +2.5/5.0
- Condition / age +2.5/5.0
$219,900
🖨 Deal sheet 📄 Offer letter ✓ Due diligence
Listing remarks
AROMATICALLY FRESH AND CLEAN FOUR BEDROOM HOME IN MOVE IN CONDITION. .. .NO CARPETING, FRESH PAINT; EASY TO MAINTAIN FLOORING; BEAUTIFUL WHITE SPECKLED GRANITE. . SPLIT BEDROOM PLAN -- GRANITE IN BATHROOMS TOO. NEWER A/C AND ROOF. .. .. IN CLOSE PROXIMITY TO AIRPORT; DINING; SHOPPING; MEDICAL FACILITIES AND HIGHWAY 59 CORRIDOR AND BELTWAY 8.. . PREVIOUS OCCUPANTS LEFT A HOT TUB BUT CURRENT OWNERS DO NOT KNOW IF IT FUNCTIONS OR
Key facts
- No carpeting
- Fresh paint
- Split bedroom plan
Tags
Property features AI
Finance
- HOA & community: HOA: STERLING ASI; Annual association fee of $300; Association covers recreation facilities; Community pool
Exterior
- Parking: Attached garage; 2-car garage
- Utilities: Public water; Public sewer
- Home design: Residential property; Built in 1978; Single-story entry (first-floor living)
- Construction: Brick and wood siding exterior; Composition roof; Slab foundation
- Exterior features: Subdivision lot; Asphalt road access
Interior
- Kitchen: Electric range
- Bedrooms: Primary bedroom on the first floor (approx. 15x12); Three additional first-floor bedrooms (approx. 11x11, 11x11, 10x11) — four bedrooms possible total
- Bathrooms: Two full bathrooms
- Heating & cooling: Central heating (gas); Central electric air conditioning
- Interior features: Kitchen island; Kitchen open to family room; One fireplace
Neighborhood map
What this means for you Summary
Snapshot
- This is a 3-bed/2.0-bath single-family listed at $220k.
Deal economics
- At list price, monthly cash flow is $-67 ($-801/yr) — negative.
- To cash-flow at today's rent, offer at most $208k (5.4% below list).
- To meet the 1% rule (rent ≥ 1% of price), the offer needs to be $192k (12.6% below list).
- Recommended offer: $192k (12.6% below list) — sets the bar for 1% rule.
- Cap rate 5.9% vs local median 4.1% in Atascocita — top-decile yield for the area; either an underpriced asset or a hidden risk that comps aren't pricing in. Stress-test before assuming the spread holds.
Location & tenants
- Location reads 70/100 on livability (#346 in TX) — a middle-class / working-renter tenant base. Strengths: employment A+, cost of living A+, housing A+; Watch: amenities F, commute F, health & safety F.
- Humble ISD (urban): math 38% / reading 44% proficiency, ranked #262 of 826 in TX (top 32%) — families likely to look elsewhere, expect single-tenant / working-renter base with shorter leases.
- Zoned schools: Timberwood Middle (math 31% / reading 46%, grade F, #704 of 1,662 statewide, top 43%, 1,094 students, 54% FRL); Atascocita H S (math 41% / reading 52%, grade D-, #621 of 1,632 statewide, top 38%, 3,829 students, 42% FRL) — zoned schools average 48% FRL vs 32% district-wide (16 pts higher); higher-poverty schools than district average — tighter screening recommended.
- Market conditions: Rents flat; 669 active listings in the ZIP; 7 comparable units currently listed for rent nearby; rentals leasing fast (median 12d on market — plan ~1-2 weeks tenant-placement turnaround); high-income renter base; 29,883 units permitted in Harris County in 2024 (8,621 in 5+ unit buildings).
Forward outlook
- Local home prices are declining (-0.9%/yr); year-one equity from $2k of loan paydown is wiped out by about $2k of value loss. Plan a longer hold.
- Harris County population projected at +47% by 2050 — long-run rental-demand tailwind backs the buy-and-hold thesis.
Negotiation context
- It's been on market 53 days — a 3% lower offer ($213k) is reasonable based on typical stale-listing flexibility.
- 4 sale attempts since 17y ago with the ask held roughly flat each time — persistent listings suggest the price (not the market) is what's stuck; bring a comps-based counter.
- Current owner paid $40k; list at $220k implies a 451% gain — meaningful room to come down on a strong offer.
Risks & watch-outs
- Climate carrying-cost: severe wind risk, 99% chance of damaging wind over 30y; extreme-heat days projected 7→24/yr by 2055 (HVAC capex compounding) — expect insurance premiums to compound above CPI over the hold.
Questions for the listing agent
- What do current leases actually rent for vs. the listed asking? Can we see a recent rent roll and the last 12 months of T-12 income?
- It's been on market 53 days. Have you received any prior offers? Is the seller open to a 13% concession, seller financing, or rate buy-down credit?
- Built in 1978 — when were the roof, HVAC, electrical panel, plumbing, and water heater last replaced?
- What does the HOA fee cover, when was the last increase, and are there any pending special assessments or reserve-fund shortfalls?
- Is there a deadline driving the sale (1031 exchange, divorce, estate, relocation)? That informs how much negotiation room exists.
- The area grade is low — what's the realistic commute time and amenity access for the typical tenant pool here? Any planned neighborhood developments (good or bad) we should know about?
- What's the average days-on-market for RENTAL listings here right now (not sales)? A rising rental-DOM trend means longer vacancies and softer asking-rent achievability than the comps imply.
- What's the recent tenant-quality profile in this submarket — average credit score on applications, eviction rate, late-payment / NSF rate, and stable-employment percentage? A property-management company in the area should have these aggregated.
- How much new for-sale + rental construction is in the pipeline within 1–3 miles? Heavy new supply typically softens prices + rents 12–24 months out; constrained supply supports both.
Investment metrics
- 1% rule
- 0.87% ✗
- Cap rate
- 5.93%
- Cash-on-cash
- -1.30%
- DSCR
- 0.94
- GRM
- 9.5
CMA / ARV
- ARV (median comp)
- $204,404
- List price
- $219,900
- Delta
- 7.58%
- Verdict
- FAIR
- Comps
- 20 within 1.0 mi
Show comp detail 12 sales within ~0.75 mi
| Address | Dist | Beds/Ba | Sqft | Sold | Price | $/sf | Match |
|---|---|---|---|---|---|---|---|
| 19918 Burle Oak Dr | 0.07mi | 3/2.5 | 1,248 (+2%) | 9mo | $205,000 | $164 | 85 |
| 5414 Quail Tree Ln | 0.13mi | 3/2.0 | 1,224 (-0%) | 10mo | $192,500 | $157 | 85 |
| 19919 Burle Oak Dr | 0.06mi | 4/2.0 (+1) | 1,294 (+5%) | 3mo | $185,000 | $143 | 81 |
| 20109 Misty Pines Dr | 0.28mi | 3/2.0 | 1,267 (+3%) | 7mo | $229,000 | $181 | 76 |
| 19934 Burle Oak Dr | 0.11mi | 3/2.5 | 1,299 (+6%) | 14mo | $199,900 | $154 | 72 |
| 5442 Dove Forest Ln | 0.05mi | 3/2.0 | 1,380 (+12%) | 9mo | $200,000 | $145 | 70 |
| 5403 Fawn Trail Ln | 0.13mi | 3/2.0 | 1,347 (+10%) | 10mo | $190,000 | $141 | 69 |
| 20130 Misty Pines Dr | 0.29mi | 3/2.0 | 1,365 (+11%) | 1mo | $225,000 | $165 | 67 |
| 5435 Fawn Trail Ln | 0.06mi | 3/2.0 | 1,407 (+14%) | 14mo | $219,900 | $156 | 61 |
| 20026 Faye Oaks Dr | 0.26mi | 3/3.0 | 1,376 (+12%) | 10mo | $214,000 | $156 | 56 |
| 20034 Bambiwoods Dr | 0.34mi | 2/1.0 (-1) | 1,078 (-12%) | 13mo | $179,995 | $167 | 44 |
| 5307 Green Timbers Dr | 0.72mi | 3/2.0 | 1,348 (+10%) | 14mo | $210,999 | $157 | 39 |
Match score weights: distance 35% · size 25% · config 20% · recency 20%. Top-matched comps best support the ARV.
Projected returns pro-forma
-0.95% appreciation · 0.09% rent growth · sell at horizon
- IRR
- -9.9%
- Equity multiple
- 0.58×
- Total profit
- $-25,754
- Equity at exit
- $53,565
- IRR
- -5.8%
- Equity multiple
- 0.51×
- Total profit
- $-30,415
- Equity at exit
- $56,661
Cash invested: $61,572 (down + closing). Projections, not guarantees.
Landlord ↔ Tenant lean methodology
- Overall (STATE)
- 87 Strongly Landlord-Friendly
- State Texas
- 87 Strongly Landlord-Friendly · R+5
- County
- — inherits STATE
- City
- — inherits STATE
ZIP-level market 77346
- Home prices YoY
- -0.4%
- Rents YoY
- 0.1%
- Active inventory
- 669
- Price-to-rent
- 9.5×
Monthly cashflow live
- Estimated rent
- $1,923 high interval (Pro) →
- Mortgage (P&I)
- −$1,153
- Tax from tax record
- −$316 /mo · $3,791/yr
- Insurance
- −$92
- HOA
- −$25
- Vacancy / Maint / Mgmt
- −$404
- Net cashflow
- $-67
Break-even live
UW: 25.0% down · 7.5% · 30yr · 1.5% tax · 5.0% vac · 8.0% maint · 8.0% mgmt
Financing live
Cash to close
- Down payment
- $54,975
- Closing costs
- $6,597
- Reserves months
- —
- Total cash needed
- —
Loan-product check · same deal, 3 products live
Conventional
25% down · 7.5% · 30yr
- Down + closing
- —
- Monthly P&I
- —
- Monthly cashflow
- —
- DSCR
- —
- Eligible?
- —
Personal DTI + credit; lowest rate.
DSCR
20% down · 8.5% · 30yr
- Down + closing
- —
- Monthly P&I
- —
- Monthly cashflow
- —
- DSCR
- —
- Eligible?
- —
No personal income docs; deal must DSCR.
Hard money
10% down · 12.0% · 12mo
- Down + closing
- —
- Monthly P&I
- —
- Monthly cashflow
- —
- DSCR
- —
- Eligible?
- —
Short-term bridge; refi at stabilization.
Rent comps 7 comps
| Address | Beds | Baths | Sqft | Rent | $/sqft | DOM | Units | Dist |
|---|---|---|---|---|---|---|---|---|
| 5419 Deer Timbers Trl Humble, TX | 3.0 | 2.0 | 1313 | $1,705 | $1.30 | 22d | 1 | 0.09mi |
| 19113 Moon Trail Dr Unit ECT Humble, TX | 2.0 | 2.0 | 1054 | $1,319 | $1.25 | 11d | 1 | 0.88mi |
| 6519 Kings Glen Dr Humble, TX | 1.0–3.0 | 1.0–2.5 | 1255 | $2,813 | $2.24 | 1d | 16 | 1.02mi |
| 6227 Spruce Bough Ct Humble, TX | 3.0 | 2.0 | 1432 | $1,800 | $1.26 | 43d | 1 | 1.10mi |
| 18835 Atasca Oaks Dr Humble, TX | 3.0 | 2.0 | 1432 | $1,829 | $1.28 | 5d | 1 | 1.22mi |
| 5248 Timbers Quail Dr Atascocita, TX | 2.0 | 2.0 | 1050 | $1,225 | $1.17 | 43d | 1 | 1.29mi |
| 18551 Timber Forest Dr Humble, TX | 2.0–3.0 | 1.0–2.0 | 1080 | $1,609 | $1.49 | 1d | 7 | 1.34mi |
HOA detail
- Monthly dues
- $25 · $300/yr
Listing history 29 events
-
2026-06-18days on market $219,900 Active 53 DOM
-
2026-06-17days on market $219,900 Active 52 DOM
-
2026-06-16days on market $219,900 Active 51 DOM
-
2026-06-15days on market $219,900 Active 50 DOM
-
2026-06-13days on market $219,900 Active 48 DOM
-
2026-06-13days on market $219,900 Active 47 DOM
-
2026-06-09days on market $219,900 Active 44 DOM
-
2026-06-08days on market $219,900 Active 43 DOM
-
2026-06-07days on market $219,900 Active 42 DOM
-
2026-06-04days on market $219,900 Active 39 DOM
-
2026-06-03days on market $219,900 Active 38 DOM
-
2026-06-02days on market $219,900 Active 37 DOM
-
2026-06-01days on market $219,900 Active 36 DOM
-
2026-05-31days on market $219,900 Active 35 DOM
-
2026-04-26$219,900 Active 428-char remark
-
2026-04-02historical
-
2025-08-18$229,900 Active
-
2025-08-04historical
-
2025-07-03price $235,000
-
2025-05-15price $239,999
-
2025-03-17price $249,999
-
2025-02-21$257,000 Active
-
2013-02-14soldstatus
-
2009-08-11soldstatus
-
2009-06-15historical
-
2009-04-02$64,900
-
2009-03-16soldstatus
-
1999-06-30soldstatus
-
1996-05-01soldstatus $39,900
ⓘ Source: listings_history table (triggers on properties + properties_extension) + one-shot
backfill from property_details.listing_events for pre-trigger history.
Tax reassessment forecast TX · Resets to sale price
- Current annual tax
- $3,791 · $316/mo
- Projected year-2 tax
- $4,024 · $335/mo
- Expected delta
- +$233/yr (+$19/mo · 6.1%)
ⓘ Screening estimate from a state-policy table — verify with the county assessor before closing.
Climate risk First Street
- Flood 1/10 Low FEMA zone X (unshaded) · 0% chance over 30 yrs
- Wildfire 1/10 Low
- Heat 9/10 Extreme 7 d/yr ≥110°F today · 24 d/yr by 30 yrs out
- Wind 9/10 Extreme 99% chance of damaging wind over 30 yrs
- Air quality 3/10 Moderate 3 unhealthy d/yr today · 3 by 30 yrs out
Nearby sold comps map
Loading sold comps map…
Walkable amenities ~0.75 mi
Loading nearby amenities…
Taxation est. · year 1
- Rental income
- $23,073
- − Mortgage interest
- −$12,318
- − Property taxes
- −$3,791
- − Insurance
- −$1,100
- − Repairs & maintenance
- −$1,846
- − Management
- −$1,846
- − HOA
- −$300
- − Depreciation
- −$6,397
- Taxable loss
- −$4,524
- Est. tax savings @ 24.0%
- +$1,086
- After-tax cash flow
- $285/yr
For passive investors: Depreciation is non-cash, so a rental often shows a tax loss while cash-flowing — sheltering income. Rental losses are passive: they offset passive income freely, and up to $25,000/yr can offset ordinary (W-2) income if you actively participate and your MAGI is under $100k (phasing out to $0 by $150k); unused losses carry forward. On sale, claimed depreciation is recaptured at up to 25%, and gains may owe capital-gains tax (a 1031 exchange can defer both). Figures are a year-1 estimate at your 24.0% rate — not tax advice; consult a CPA.
Schools (NCES district)
- District
- Humble ISD
- NCES district ID
- 4823910
- Math proficiency
- 38% ▼ -11.00%
- Reading proficiency
- 44% ▼ -7.00%
- Median HH income
- $83,946
- Composite
- 38.55/100
- National rank
- #4171
- State rank
- #262 of 826 in TX
Livability — Atascocita
- Score
- 70/100
- State rank
- #346
- US rank
- #7586
Category grades
Schools grade is shown separately in the Schools card above.
Census & demographics
- Census place
- Atascocita, TX
- County
- Harris County · 4,702,590 people
- City population
- 79,538
- Metro
- Houston-The Woodlands-Sugar Land, TX
- Population (ZIP)
- 79,538
- Household income
- $122,241
- Rent vs Own
- Severe rent burden
- 1072.0
Population outlook (Harris County) Hauer SSP2
- Today (2025)
- 5,571,493 people
- By 2030
- 6,089,821 · +9.3%
- By 2040
- 7,142,806 · +28.2%
- By 2050
- 8,185,864 · +46.9%
- By 2075
- 10,574,329 · +89.8%
- By 2100
- 12,109,958 · +117.4%
Race, ethnicity, and origin ACS 2023
- Neighborhood character
- Diverse neighborhood (Simpson 0.70)
- Race & ethnicity
- White 42% Hispanic / Latino 28% Black 21% Two or more races 18% Asian 4%
- Hispanic origin (detail)
- Mexican 20% Puerto Rican 2%
- Common ancestry
- Lithuanian 4% Slovak 1% Italian 1%
- Foreign-born
- 10% · Canada, Vietnam, China
- Languages at home
- 78% English-only · Spanish 17% Other Indo-European 1% German/W. Germanic 1%
Political lean MEDSL · Harris
- 2024 margin
- Lean D (+5.5) · D 52.0% · R 46.4% · Other 1.6%
- 2008→2024 swing
- +3.9pp toward D · 2008: 1.6pp · 2024: 5.5pp
- All cycles
- 2024: D+5.5 2020: D+13.3 2016: D+12.4 2012: D+0.1 2008: D+1.6
Not yet ingested
- Civics
- —
Market trends
- HPI YoY
- ▼ -0.95%
- Current HPI
- 218.0478
- Rent YoY
- ▲ 0.09%
- Metro
- Houston-The Woodlands-Sugar Land, TX
- State GDP YoY
- ▲ 3.95%
- F500 in state
- 110
Industry mix (Fortune 500 HQ in TX)
| Industry | F500 HQs | Revenue |
|---|---|---|
| Energy | 16 | $1,198B |
|
||
| Technology | 5 | $198B |
|
||
| Engineering / Construction | 4 | $72B |
|
||
| Energy Services | 3 | $60B |
|
||
| Utilities | 3 | $41B |
|
||
| Healthcare | 2 | $330B |
|
||
Price history
+451.1% since first listed15 events — show timeline
- 2026-04-26 Listed $219,900 HARMLS
- 2026-04-02 Listing Removed — HARMLS
- 2025-08-18 Listed $229,900 HARMLS
- 2025-08-04 Listing Removed — HARMLS
- 2025-07-03 Price Changed $235,000 HARMLS
- 2025-05-15 Price Changed $239,999 HARMLS
- 2025-03-17 Price Changed $249,999 HARMLS
- 2025-02-21 Listed $257,000 HARMLS
- 2013-02-14 Sold (Public Records) — Public Records
- 2009-08-11 Sold (MLS) — HARMLS
- 2009-06-15 Listing Removed — HARMLS
- 2009-04-02 Listed $64,900 HARMLS
- 2009-03-16 Sold (Public Records) — Public Records
- 1999-06-30 Sold (Public Records) — Public Records
- 1996-05-01 Sold (Public Records) $39,900 Public Records
Property tax history
+8.8%/yrLatest (2025): $3,791 · +1.9% YoY. Source: county tax records.
Cash-flow waterfall
monthlySold comps — $/sqft
last 12 mo · ≤1 miLoading sold comps…