8336 Waterline Dr #201 · Boynton Beach, FL
Flood risk 1/10 · Minimal
- FEMA flood zone
- X (unshaded)
- Chance of flooding over 30 yrs
- 0.0%
- Est. flood insurance / yr
- $507 – $1,088
Fire risk 1/10 · Minimal
- Est. fire insurance / yr
- $947 – $1,759
Heat risk 9/10 · Severe
- Hot days now (above 106°F)
- 6 days/yr
- Hot days in 30 yrs
- 22 days/yr
Wind risk 10/10 · Severe
- Chance of severe wind over 30 yrs
- 99.0%
Air-quality risk 2/10 · Minimal
- Unhealthy air days now
- 0 days/yr
- Unhealthy air days in 30 yrs
- 2 days/yr
Risk factors via First Street. Map © Google.
Why this score? — see what drove the C- grade
The composite is a weighted blend of 9 inputs, each scored 0–100. Each bar is that input's sub-score; the figure is the points it added to the 100-point composite (weight × sub-score).
- Cash flow +15.5/30.0
- 1% rule +8.3/10.0
- ARV discount +7.5/15.0
- Appreciation +5.1/10.0
- DSCR +4.8/10.0
- Schools +4.3/10.0
- Livability +3.6/5.0
- Rent growth +2.5/5.0
- Condition / age +2.5/5.0
$255,000
🖨 Deal sheet 📄 Offer letter ✓ Due diligence
Listing remarks
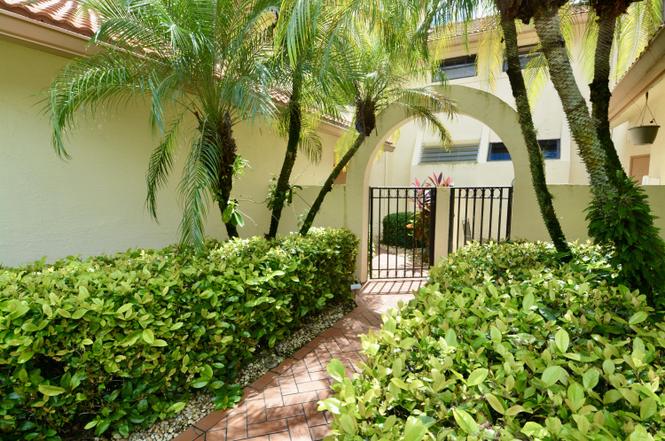
Welcome to this charming 3/2, condo home in the desirable Harbours at Aberdeen! This spacious unit offers vaulted ceilings, abundant natural light, and serene lake views from the second floor screened balcony. The kitchen opens to the dining & living areas for easy entertaining. The primary bathroom has been beautifully renovated. Enjoy a 1 car garage, full laundry, & access to Aberdeen CC. NO MANDATORY CLUB MEMBERSHIP REQUIRED! This condo currently has an Acorn Chair installed on the steps that can stay or be removed. It is also offered furnished or unfurnished. HOA fees covers cable building Ins. , exterior maintenance, roof upkeep, water, sewer & common areas, this home
Key facts
- $867 HOA
- Garage
- Community pool
Property features AI
Finance
- Other: Senior community; Pets allowed with no restrictions
- HOA & community: Monthly HOA fee; Association amenities: Clubhouse, Fitness Center, Game Room, Jogging Path, Pool, Tennis Courts, Community Room; HOA covers cable TV, insurance, grounds maintenance, sewer, water, common areas
Exterior
- Parking: Attached 1-car garage; Covered parking (1 space); Guest parking
- Utilities: Public water; Public sewer; Cable available; Water available; Sewer available
- Home design: Condominium; Multi/split levels; 2-story building; North-facing
- Construction: CBS construction
- Exterior features: Waterfront property
Interior
- Kitchen: Dishwasher; Electric range; Microwave; Refrigerator; Electric water heater
- Bedrooms: No main-level bedrooms
- Flooring: Carpet; Laminate
- Bathrooms: 2 full bathrooms
- Heating & cooling: Central heating; Central air conditioning; Ceiling fans
- Interior features: Entrance foyer; High ceilings; Split bedroom layout
Neighborhood map
What this means for you Summary
Snapshot
- This is a 3-bed/2.0-bath condo listed at $255k.
Deal economics
- At list price, monthly cash flow is $100 ($1k/yr) — positive.
- The deal already cash-flows at list — no discount required.
- Meets the 1% rule at list price ($3k rent vs $255k).
- Recommended offer: $224k (12.0% below list) — sets the bar for market timing.
- Cap rate 6.8% vs local median 4.3% in Boynton Beach — top-decile yield for the area; either an underpriced asset or a hidden risk that comps aren't pricing in. Stress-test before assuming the spread holds.
Location & tenants
- Location reads 72/100 on livability (#351 in FL) — a middle-class / working-renter tenant base. Strengths: housing A+, health & safety B+, cost of living B; Watch: amenities D+, crime D-, commute F.
- Palm Beach (suburban): math 46% / reading 53% proficiency, ranked #34 of 73 in FL (top 47%) — families likely to look elsewhere, expect single-tenant / working-renter base with shorter leases.
- Market conditions: 169 active listings in the ZIP; 32 comparable units currently listed for rent nearby; rentals at typical pace (median 19d on market — plan ~3-4 weeks tenant-placement turnaround); 3,974 units permitted in Palm Beach County in 2024 (1,012 in 5+ unit buildings).
Forward outlook
- In year one you build about $2k of equity ($2k loan paydown + $505 appreciation (0.2% local appreciation)).
- Palm Beach County population projected at +30% by 2050 — long-run rental-demand tailwind backs the buy-and-hold thesis.
- At projected returns (0.2% appreciation + 3.0% rent growth), your $71k cash investment doubles in ~10 years — after that, you're playing with house money.
Negotiation context
- It's been on market 254 days — a 12% lower offer ($224k) is reasonable based on typical stale-listing flexibility.
- Current owner paid $122k; list at $255k implies a 110% gain — meaningful room to come down on a strong offer.
Risks & watch-outs
- Watch-outs: HOA is 26% of rent.
- Climate carrying-cost: severe wind risk, 99% chance of damaging wind over 30y; extreme-heat days projected 6→22/yr by 2055 (HVAC capex compounding) — expect insurance premiums to compound above CPI over the hold.
Questions for the listing agent
- It's been on market 254 days. Have you received any prior offers? Is the seller open to a 12% concession, seller financing, or rate buy-down credit?
- What does the HOA fee cover, when was the last increase, and are there any pending special assessments or reserve-fund shortfalls?
- Any open or pending special assessments — roof, HVAC, plumbing, elevator, façade? What's the per-unit balance and payoff schedule, and is the seller paying it off at close or rolling it to the buyer?
- Why hasn't it sold? Are there any deal-killer items the seller is aware of (foundation, flood, title, zoning, code violations)?
- Is there a deadline driving the sale (1031 exchange, divorce, estate, relocation)? That informs how much negotiation room exists.
- Crime grade is D in this area — have there been break-ins, vandalism, or insurance claims at this property in the last 3 years? What carrier currently insures it and at what premium?
- What's the average days-on-market for RENTAL listings here right now (not sales)? A rising rental-DOM trend means longer vacancies and softer asking-rent achievability than the comps imply.
- What's the recent tenant-quality profile in this submarket — average credit score on applications, eviction rate, late-payment / NSF rate, and stable-employment percentage? A property-management company in the area should have these aggregated.
- How much new apartment / multifamily construction is in the pipeline within 1–3 miles? Heavy new supply (>2% of stock underway) typically softens rents 12–24 months out; light construction supports rent growth.
Investment metrics
- 1% rule
- 1.33% ✓
- Cap rate
- 6.77%
- Cash-on-cash
- 1.69%
- DSCR
- 1.08
- GRM
- 6.3
CMA / ARV
No comps found within radius.
Projected returns pro-forma
0.2% appreciation · 3.0% rent growth · sell at horizon
- IRR
- 0.5%
- Equity multiple
- 1.03×
- Total profit
- $1,876
- Equity at exit
- $76,580
- IRR
- 6.1%
- Equity multiple
- 1.68×
- Total profit
- $48,283
- Equity at exit
- $94,101
Cash invested: $71,400 (down + closing). Projections, not guarantees.
Landlord ↔ Tenant lean methodology
- Overall (STATE)
- 87 Strongly Landlord-Friendly
- State Florida
- 87 Strongly Landlord-Friendly · R+3
- County
- — inherits STATE
- City
- — inherits STATE
ZIP-level market 33472
- Home prices YoY
- 0.1%
- Active inventory
- 169
- Price-to-rent
- 6.3×
Monthly cashflow live
- Estimated rent
- $3,388 high interval (Pro) →
- Mortgage (P&I)
- −$1,337
- Tax from tax record
- −$266 /mo · $3,189/yr
- Insurance
- −$106
- HOA
- −$867
- Vacancy / Maint / Mgmt
- −$712
- Net cashflow
- $100
Break-even live
UW: 25.0% down · 7.5% · 30yr · 1.5% tax · 5.0% vac · 8.0% maint · 8.0% mgmt
Financing live
Cash to close
- Down payment
- $63,750
- Closing costs
- $7,650
- Reserves months
- —
- Total cash needed
- —
Loan-product check · same deal, 3 products live
Conventional
25% down · 7.5% · 30yr
- Down + closing
- —
- Monthly P&I
- —
- Monthly cashflow
- —
- DSCR
- —
- Eligible?
- —
Personal DTI + credit; lowest rate.
DSCR
20% down · 8.5% · 30yr
- Down + closing
- —
- Monthly P&I
- —
- Monthly cashflow
- —
- DSCR
- —
- Eligible?
- —
No personal income docs; deal must DSCR.
Hard money
10% down · 12.0% · 12mo
- Down + closing
- —
- Monthly P&I
- —
- Monthly cashflow
- —
- DSCR
- —
- Eligible?
- —
Short-term bridge; refi at stabilization.
Rent comps 32 comps
| Address | Beds | Baths | Sqft | Rent | $/sqft | DOM | Units | Dist |
|---|---|---|---|---|---|---|---|---|
| 8082 Aberdeen Dr #102 Boynton Beach, FL | 2.0 | 2.0 | 1619 | $8,500 | $5.25 | 24d | 1 | 0.33mi |
| 7888 Sonoma Springs Cir #105 Lake Worth, FL | 2.0 | 2.0 | 1105 | $2,200 | $1.99 | 24d | 1 | 0.43mi |
| 6143 Windlass Cir Boynton Beach, FL | 4.0 | 2.5 | 2245 | $4,200 | $1.87 | 18d | 1 | 0.46mi |
| 6581 Marissa Cir Lake Worth, FL | 3.0 | 2.0 | 1414 | $3,300 | $2.33 | 18d | 1 | 0.48mi |
| 7856 Sonoma Springs Cir #205 Lake Worth, FL | 2.0 | 2.0 | 1105 | $2,300 | $2.08 | 7d | 1 | 0.50mi |
| 6731 Southport Dr Boynton Beach, FL | 3.0 | 2.0 | 1727 | $3,600 | $2.08 | 24d | 1 | 0.51mi |
| 5945 Parkwalk Dr Boynton Beach, FL | 2.0 | 2.0 | 1178 | $2,500 | $2.12 | 21d | 1 | 0.53mi |
| 7840 Sonoma Springs Cir #103 Lake Worth, FL | 2.0 | 2.0 | 1105 | $2,200 | $1.99 | 24d | 1 | 0.55mi |
| 7085 Merganser Ct Lake Worth, FL | 2.0 | 2.0 | 1155 | $2,110 | $1.83 | 1d | 1 | 0.78mi |
| 8520 Tourmaline Blvd Boynton Beach, FL | 4.0 | 2.0 | 1699 | $4,000 | $2.35 | 18d | 1 | 0.80mi |
| 6365 Lansdowne Cir Boynton Beach, FL | 3.0 | 2.0 | 1769 | $3,200 | $1.81 | 2d | 1 | 0.83mi |
| 7366 Ashley Shores Cir Lake Worth, FL | 3.0 | 2.5 | 1945 | $4,200 | $2.16 | 7d | 1 | 0.93mi |
| 9121 Paragon Way Boynton Beach, FL | 4.0 | 2.0 | 2154 | $4,950 | $2.30 | 24d | 1 | 0.93mi |
| 7418 Wescott Ter Lake Worth, FL | 3.0 | 2.5 | 2170 | $3,250 | $1.50 | 7d | 1 | 0.96mi |
| 5537 Pebble Brook Ln Boynton Beach, FL | 3.0 | 2.0 | 1166 | $2,825 | $2.42 | 14d | 1 | 1.00mi |
| 6836 Long Key St Lake Worth, FL | 3.0 | 2.5 | 1637 | $2,950 | $1.80 | 17d | 1 | 1.03mi |
| 9336 Water Course Way Boynton Beach, FL | 3.0 | 2.0 | 1779 | $3,600 | $2.02 | 24d | 1 | 1.26mi |
| 9336 Water Course Way Boynton Beach, FL | 3.0 | 2.0 | 1779 | $3,600 | $2.02 | 21d | 1 | 1.26mi |
| 5072 Arbor Glen Cir Lake Worth, FL | 3.0 | 2.0 | 1232 | $3,300 | $2.68 | 14d | 1 | 1.32mi |
| 8884 Shoal Creek Ln Boynton Beach, FL | 3.0 | 2.0 | 1936 | $4,900 | $2.53 | 24d | 1 | 1.39mi |
| 8884 Shoal Creek Ln Boynton Beach, FL | 3.0 | 2.0 | 1936 | $5,000 | $2.58 | 10d | 1 | 1.39mi |
| 9215 Sun Pointe Dr Boynton Beach, FL | 4.0 | 2.0 | 2142 | $4,650 | $2.17 | 10d | 1 | 1.41mi |
| 9215 Sun Pointe Dr Boynton Beach, FL | 4.0 | 2.0 | 2142 | $4,650 | $2.17 | 24d | 1 | 1.41mi |
| 7192 Summer Tree Dr Boynton Beach, FL | 2.0 | 2.0 | 1722 | $3,000 | $1.74 | 24d | 1 | 1.42mi |
| 9629 El Clair Ranch Rd Boynton Beach, FL | 4.0 | 2.0 | 2231 | $4,800 | $2.15 | 24d | 1 | 1.43mi |
| 8657 Rosalie Ct Boynton Beach, FL | 4.0 | 2.0 | 2021 | $3,499 | $1.73 | 18d | 1 | 1.44mi |
| 6039 Sunberry Cir Boynton Beach, FL | 4.0 | 2.0 | 2149 | $3,650 | $1.70 | 5d | 1 | 1.45mi |
| 7218 Michigan Isle Rd Lake Worth, FL | 3.0 | 2.0 | 1656 | $3,500 | $2.11 | 14d | 1 | 1.48mi |
| 7218 Michigan Isle Rd Lake Worth, FL | 3.0 | 2.0 | 1656 | $3,500 | $2.11 | 13d | 1 | 1.48mi |
| 9565 El Clair Ranch Rd Boynton Beach, FL | 3.0 | 2.0 | 1867 | $3,500 | $1.87 | 7d | 1 | 1.49mi |
| 9565 El Clair Ranch Rd Boynton Beach, FL | 3.0 | 2.0 | 1867 | $3,500 | $1.87 | 20d | 1 | 1.49mi |
| 7725 Rockford Rd Boynton Beach, FL | 3.0 | 2.5 | 2249 | $10,000 | $4.45 | 2d | 1 | 1.49mi |
HOA detail condo
- Monthly dues
- $867 · $10,404/yr
- Likely covers
- watersewercableexterior maint.
- Assessments
- None detected in remarks — confirm with the listing agent.
Listing history 15 events
-
2026-06-18days on market $255,000 Active 254 DOM
-
2026-06-17days on market $255,000 Active 253 DOM
-
2026-06-16days on market $255,000 Active 252 DOM
-
2026-06-15days on market $255,000 Active 251 DOM
-
2026-06-13days on market $255,000 Active 249 DOM
-
2026-06-09days on market $255,000 Active 245 DOM
-
2026-06-07days on market $255,000 Active 243 DOM
-
2026-06-04days on market $255,000 Active 240 DOM
-
2026-06-03days on market $255,000 Active 239 DOM
-
2026-06-01days on market $255,000 Active 237 DOM
-
2026-05-31days on market $255,000 Active 236 DOM
-
2026-04-28price $255,000
-
2025-10-07$265,000 Active
-
1994-07-14soldstatus $121,500
-
1992-05-29soldstatus $120,900
ⓘ Source: listings_history table (triggers on properties + properties_extension) + one-shot
backfill from property_details.listing_events for pre-trigger history.
Tax reassessment forecast FL · Resets to sale price
- Current annual tax
- $3,189 · $266/mo
- Projected year-2 tax
- $3,189 · $266/mo
- Expected delta
- $0/yr ($0/mo · 0.0%)
ⓘ Screening estimate from a state-policy table — verify with the county assessor before closing.
Climate risk First Street
- Flood 1/10 Low FEMA zone X (unshaded) · 0% chance over 30 yrs
- Wildfire 1/10 Low
- Heat 9/10 Extreme 6 d/yr ≥106°F today · 22 d/yr by 30 yrs out
- Wind 10/10 Extreme 99% chance of damaging wind over 30 yrs
- Air quality 2/10 Low 0 unhealthy d/yr today · 2 by 30 yrs out
Nearby sold comps map
Loading sold comps map…
Walkable amenities ~0.75 mi
Loading nearby amenities…
Taxation est. · year 1
- Rental income
- $40,660
- − Mortgage interest
- −$14,284
- − Property taxes
- −$3,189
- − Insurance
- −$1,275
- − Repairs & maintenance
- −$3,253
- − Management
- −$3,253
- − HOA
- −$10,404
- − Depreciation
- −$7,418
- Taxable loss
- −$2,416
- Est. tax savings @ 24.0%
- +$580
- After-tax cash flow
- $1,786/yr
For passive investors: Depreciation is non-cash, so a rental often shows a tax loss while cash-flowing — sheltering income. Rental losses are passive: they offset passive income freely, and up to $25,000/yr can offset ordinary (W-2) income if you actively participate and your MAGI is under $100k (phasing out to $0 by $150k); unused losses carry forward. On sale, claimed depreciation is recaptured at up to 25%, and gains may owe capital-gains tax (a 1031 exchange can defer both). Figures are a year-1 estimate at your 24.0% rate — not tax advice; consult a CPA.
Schools (NCES district)
- District
- Palm Beach
- NCES district ID
- 1201500
- Math proficiency
- 46% ▼ -16.00%
- Reading proficiency
- 53% ▼ -4.00%
- Median HH income
- $53,943
- Composite
- 42.72/100
- National rank
- #3160
- State rank
- #34 of 73 in FL
Livability — Boynton Beach
- Score
- 72/100
- State rank
- #351
- US rank
- #6098
Category grades
Schools grade is shown separately in the Schools card above.
Census & demographics
- City population
- 148,060
- Population (ZIP)
- 18,689
Population outlook (Palm Beach County) Hauer SSP2
- Today (2025)
- 1,637,487 people
- By 2030
- 1,743,255 · +6.5%
- By 2040
- 1,948,712 · +19.0%
- By 2050
- 2,132,979 · +30.3%
- By 2075
- 2,530,027 · +54.5%
- By 2100
- 2,706,979 · +65.3%
Race, ethnicity, and origin ACS 2023
- Neighborhood character
- Diverse neighborhood (Simpson 0.56)
- Race & ethnicity
- White 63% Hispanic / Latino 18% Two or more races 14% Black 10% Asian 4%
- Hispanic origin (detail)
- Mexican 2% Puerto Rican 2% Cuban 7%
- Common ancestry
- Romanian 5% Scotch-Irish 4% Hispanic 3%
- Foreign-born
- 24% · Canada, China, Jamaica
- Languages at home
- 77% English-only · Spanish 11% Other Indo-European 4% French/Haitian/Cajun 3%
Political lean MEDSL · Palm Beach
- 2024 margin
- Toss-up / Even · D 50.0% · R 49.2%
- 2008→2024 swing
- -22.1pp toward R · 2008: 22.9pp · 2024: 0.8pp
- All cycles
- 2024: D+0.8 2020: D+12.8 2016: D+15.3 2012: D+17.0 2008: D+22.9
Not yet ingested
- Civics
- —
Market trends
- HPI YoY
- ▲ 0.20%
- Current HPI
- 268.1142
- Rent YoY
- —
- Metro
- —
- State GDP YoY
- ▲ 3.28%
- F500 in state
- 36
Industry mix (Fortune 500 HQ in FL)
| Industry | F500 HQs | Revenue |
|---|---|---|
| Industrial Technology | 2 | $29B |
|
||
| Insurance | 2 | $17B |
|
||
| Retail | 1 | $60B |
|
||
| Technology Distribution | 1 | $58B |
|
||
| Homebuilding | 1 | $35B |
|
||
| Technology Manufacturing | 1 | $35B |
|
||
Price history
+110.9% since first listed4 events — show timeline
- 2026-04-28 Price Changed $255,000 Beaches MLS
- 2025-10-07 Listed $265,000 Beaches MLS
- 1994-07-14 Sold (Public Records) $121,500 Public Records
- 1992-05-29 Sold (Public Records) $120,900 Public Records
Property tax history
+5.2%/yrLatest (2025): $3,189 · +135.1% YoY. Source: county tax records.
Cash-flow waterfall
monthlySold comps — $/sqft
last 12 mo · ≤1 miLoading sold comps…