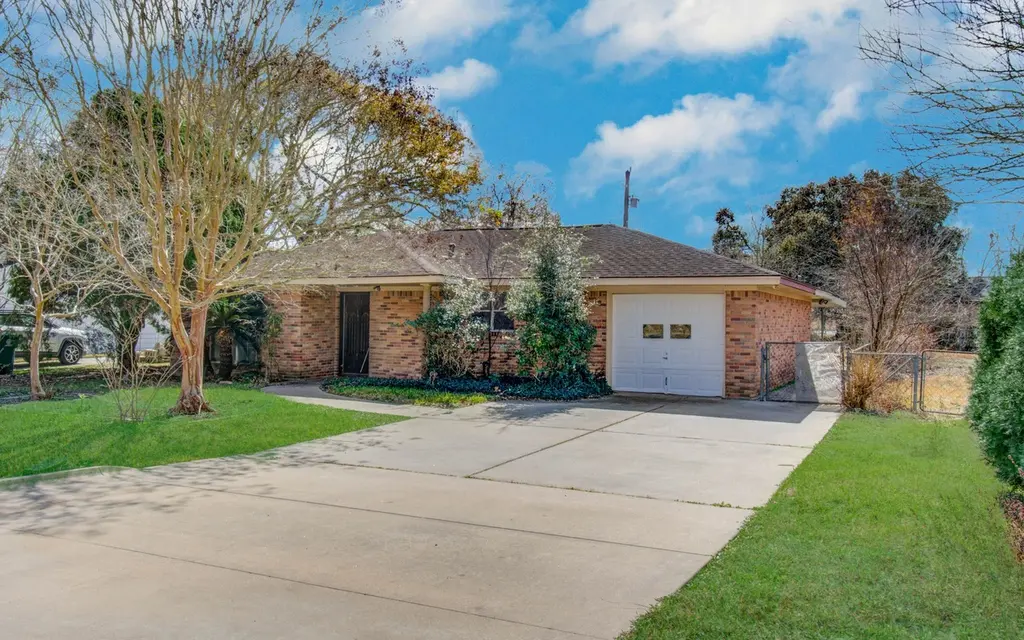
8428 Swiftwater Ln · Houston, TX
Flood risk 1/10 · Minimal
- FEMA flood zone
- X (unshaded)
- Chance of flooding over 30 yrs
- 0.0%
- Est. flood insurance / yr
- $507 – $1,088
Fire risk 1/10 · Minimal
- Est. fire insurance / yr
- $1,222 – $2,270
Heat risk 9/10 · Severe
- Hot days now (above 109°F)
- 7 days/yr
- Hot days in 30 yrs
- 25 days/yr
Wind risk 9/10 · Severe
- Chance of severe wind over 30 yrs
- 99.0%
Air-quality risk 2/10 · Minimal
- Unhealthy air days now
- 1 days/yr
- Unhealthy air days in 30 yrs
- 2 days/yr
Risk factors via First Street. Map © Google.
Why this score? — see what drove the C- grade
The composite is a weighted blend of 9 inputs, each scored 0–100. Each bar is that input's sub-score; the figure is the points it added to the 100-point composite (weight × sub-score).
- Cash flow +16.7/30.0
- ARV discount +15.0/15.0
- 1% rule +5.7/10.0
- DSCR +5.2/10.0
- Livability +3.7/5.0
- Rent growth +3.0/5.0
- Schools +2.7/10.0
- Condition / age +2.5/5.0
- Appreciation +0.0/10.0
$185,000
🖨 Deal sheet 📄 Offer letter ✓ Due diligence
Listing remarks MLS
This spacious 3-bedroom, 2-bathroom home spans an impressive 1,526 square feet of living space and is set on a generous 9,801 square foot lot. The open-concept living and dining areas provide a seamless flow for everyday living and entertaining. The kitchen is a chef’s dream, featuring granite countertops, warm wood cabinetry, double ovens, a gas cooktop, and a pantry, offering excellent functionality and ample storage. Nestled on an oversized 9,801 square foot lot, the expansive backyard and covered patio create the perfect setting for relaxation, gatherings, or future enhancements. Conveniently located near shopping, dining, and key amenities, the home is easily accessible via Beltway 8, I-45, and Hwy 288. This true blank canvas is ready for personalization or investment strategy. Offered as-is, it’s not located in a flood zone.
Key facts
- Gas cooktop
- Covered patio
- Double ovens
Tags
Neighborhood map
What this means for you Summary
Snapshot
- This is a 3-bed/2.0-bath single-family listed at $185k.
Deal economics
- At list price, monthly cash flow is $114 ($1k/yr) — positive.
- The deal already cash-flows at list — no discount required.
- Meets the 1% rule at list price ($2k rent vs $185k).
- Recommended offer: $179k (3.0% below list) — sets the bar for market timing.
- Cap rate 7.0% vs local median 3.2% in Houston — top-decile yield for the area; either an underpriced asset or a hidden risk that comps aren't pricing in. Stress-test before assuming the spread holds.
Location & tenants
- Location reads 74/100 on livability (#184 in TX, #4,771 nationally) — a middle-class / working-renter tenant base. Strengths: amenities A+, cost of living A+, housing A+; Watch: schools D, crime F.
- Houston ISD (urban): math 27% / reading 35% proficiency, ranked #593 of 826 in TX (top 72%) — families likely to look elsewhere, expect single-tenant / working-renter base with shorter leases; 71% free/reduced lunch — lower-income household profile, screen leases tightly.
- Market conditions: Rents rising (+2.2%/yr); 146 active listings in the ZIP; 10 comparable units currently listed for rent nearby; rentals lingering (median 44d on market — plan ~5-8 weeks vacancy on turnover, expect pricing pressure); 50% of comp listings sitting > 30 days — soft ceiling on asking rent; 29,883 units permitted in Harris County in 2024 (8,621 in 5+ unit buildings).
- This rent runs 34% of the median local income ($69k/yr) — at the standard rent-burdened threshold; future hikes will face affordability resistance.
Forward outlook
- Local home prices are declining (-3.0%/yr); year-one equity from $1k of loan paydown is wiped out by about $6k of value loss. Plan a longer hold.
- Harris County population projected at +47% by 2050 — long-run rental-demand tailwind backs the buy-and-hold thesis.
Negotiation context
- It's been on market 43 days — a 3% lower offer ($179k) is reasonable based on typical stale-listing flexibility.
- 5 sale attempts; this cycle's ask has dropped $14k (7%) from the opening price — seller is motivated, your offer sets the floor, not the list.
Risks & watch-outs
- Watch-outs: property tax is 2.6% of price.
- Climate carrying-cost: severe wind risk, 99% chance of damaging wind over 30y; extreme-heat days projected 7→25/yr by 2055 (HVAC capex compounding) — expect insurance premiums to compound above CPI over the hold.
Questions for the listing agent
- It's been on market 43 days. Have you received any prior offers? Is the seller open to a 3% concession, seller financing, or rate buy-down credit?
- Built in 1978 — when were the roof, HVAC, electrical panel, plumbing, and water heater last replaced?
- Property tax is high relative to price — has the assessment been appealed recently, and will the sale trigger a re-assessment?
- Is there a deadline driving the sale (1031 exchange, divorce, estate, relocation)? That informs how much negotiation room exists.
- Schools are D-rated, which usually means shorter tenancies and higher turnover. Who's the typical renter profile here, and what's been the actual vacancy rate?
- Crime grade is F in this area — have there been break-ins, vandalism, or insurance claims at this property in the last 3 years? What carrier currently insures it and at what premium?
- What's the average days-on-market for RENTAL listings here right now (not sales)? A rising rental-DOM trend means longer vacancies and softer asking-rent achievability than the comps imply.
- What's the recent tenant-quality profile in this submarket — average credit score on applications, eviction rate, late-payment / NSF rate, and stable-employment percentage? A property-management company in the area should have these aggregated.
- How much new for-sale + rental construction is in the pipeline within 1–3 miles? Heavy new supply typically softens prices + rents 12–24 months out; constrained supply supports both.
Investment metrics
- 1% rule
- 1.07% ✓
- Cap rate
- 7.03%
- Cash-on-cash
- 2.64%
- DSCR
- 1.12
- GRM
- 7.8
CMA / ARV
- ARV (median comp)
- $289,184
- List price
- $185,000
- Delta
- -36.03%
- Verdict
- UNDERPRICED
- Comps
- 20 within 1.0 mi
Show comp detail 12 sales within ~0.75 mi
| Address | Dist | Beds/Ba | Sqft | Sold | Price | $/sf | Match |
|---|---|---|---|---|---|---|---|
| 8428 Swiftwater Ln | 0.00mi | 3/2.0 | 1,526 (0%) | 1mo | $185,000 | $121 | 100 |
| 8614 Viera Ln | 0.32mi | 3/2.0 | 1,492 (-2%) | 6mo | $299,900 | $201 | 76 |
| 8416 Peekskill Ln | 0.22mi | 3/2.0 | 1,534 (+0%) | 15mo | $260,000 | $169 | 76 |
| 8207 Holiday Ln | 0.40mi | 3/2.0 | 1,516 (-1%) | 12mo | $250,000 | $165 | 70 |
| 10219 Carmencita Way | 0.33mi | 3/2.0 | 1,617 (+6%) | 8mo | $314,900 | $195 | 68 |
| 8207 Lanham Ln | 0.45mi | 4/2.0 (+1) | 1,569 (+3%) | 9mo | $270,000 | $172 | 62 |
| 8304 Holiday Ln | 0.24mi | 3/2.0 | 1,730 (+13%) | 10mo | $312,900 | $181 | 58 |
| 8318 Winthrop St | 0.59mi | 3/2.0 | 1,634 (+7%) | 7mo | $269,000 | $165 | 55 |
| 9927 Radio Rd | 0.75mi | 3/2.0 | 1,546 (+1%) | 15mo | $370,000 | $239 | 50 |
| 10414 Collin Park | 0.66mi | 3/2.0 | 1,619 (+6%) | 11mo | $260,000 | $161 | 50 |
| 8713 Wayfarer Ln | 0.39mi | 3/1.5 | 1,703 (+12%) | 14mo | $825,000 | $484 | 49 |
| 8314 Tavenor Ln | 0.72mi | 3/2.0 | 1,300 (-15%) | 12mo | $259,900 | $200 | 32 |
Match score weights: distance 35% · size 25% · config 20% · recency 20%. Top-matched comps best support the ARV.
Projected returns pro-forma
-3.0% appreciation · 2.17% rent growth · sell at horizon
- IRR
- -13.1%
- Equity multiple
- 0.53×
- Total profit
- $-24,236
- Equity at exit
- $27,584
- IRR
- -5.5%
- Equity multiple
- 0.66×
- Total profit
- $-17,836
- Equity at exit
- $15,995
Cash invested: $51,800 (down + closing). Projections, not guarantees.
Landlord ↔ Tenant lean methodology
- Overall (STATE)
- 87 Strongly Landlord-Friendly
- State Texas
- 87 Strongly Landlord-Friendly · R+5
- County
- — inherits STATE
- City
- — inherits STATE
ZIP-level market 77075
- Home prices YoY
- -25.3%
- Rents YoY
- 2.2%
- Active inventory
- 146
- Price-to-rent
- 7.8×
Monthly cashflow live
- Estimated rent
- $1,975 high interval (Pro) →
- Mortgage (P&I)
- −$970
- Tax from tax record
- −$400 /mo · $4,794/yr
- Insurance
- −$77
- HOA
- −$0
- Vacancy / Maint / Mgmt
- −$415
- Net cashflow
- $114
Break-even live
UW: 25.0% down · 7.5% · 30yr · 1.5% tax · 5.0% vac · 8.0% maint · 8.0% mgmt
Financing live
Cash to close
- Down payment
- $46,250
- Closing costs
- $5,550
- Reserves months
- —
- Total cash needed
- —
Loan-product check · same deal, 3 products live
Conventional
25% down · 7.5% · 30yr
- Down + closing
- —
- Monthly P&I
- —
- Monthly cashflow
- —
- DSCR
- —
- Eligible?
- —
Personal DTI + credit; lowest rate.
DSCR
20% down · 8.5% · 30yr
- Down + closing
- —
- Monthly P&I
- —
- Monthly cashflow
- —
- DSCR
- —
- Eligible?
- —
No personal income docs; deal must DSCR.
Hard money
10% down · 12.0% · 12mo
- Down + closing
- —
- Monthly P&I
- —
- Monthly cashflow
- —
- DSCR
- —
- Eligible?
- —
Short-term bridge; refi at stabilization.
Rent comps 10 comps
| Address | Beds | Baths | Sqft | Rent | $/sqft | DOM | Units | Dist |
|---|---|---|---|---|---|---|---|---|
| 8012 Folkstone Ln Houston, TX | 3.0 | 2.0 | 1589 | $1,900 | $1.20 | 43d | 1 | 0.61mi |
| 8238 Fuqua Gardens Dr Houston, TX | 3.0 | 2.5 | 1787 | $1,995 | $1.12 | 5d | 1 | 0.70mi |
| 8020 Botany Ln Unit 1546255P Houston, TX | 3.0 | 2.0 | 1388 | $3,226 | $2.32 | 16d | 1 | 0.92mi |
| 8911 Durham Manor Ln Houston, TX | 3.0 | 3.0 | 1848 | $2,201 | $1.19 | 5d | 1 | 0.96mi |
| 7821 Fuqua St Houston, TX | 3.0 | 2.0 | 1408 | $1,700 | $1.21 | 43d | 1 | 0.97mi |
| 10946 Gulf Valley St Houston, TX | 4.0 | 2.0 | 2179 | $1,847 | $0.85 | 24d | 1 | 1.03mi |
| 9737 Fabiola Dr Houston, TX | 3.0 | 3.0 | 2203 | $2,200 | $1.00 | 43d | 1 | 1.18mi |
| 10350 Stover St Houston, TX | 3.0 | 2.0 | 1386 | $1,625 | $1.17 | 43d | 1 | 1.39mi |
| 9462 Fuqua St Houston, TX | 3.0 | 2.0 | 1409 | $1,750 | $1.24 | 43d | 1 | 1.41mi |
| 9943 Pearland Pkwy Houston, TX | 2.0 | 2.0 | 1079 | $1,839 | $1.70 | 24d | 1 | 1.45mi |
Listing history 16 events
-
2026-05-13price $185,000 857-char remark
Show marketing remark (857 chars)
This spacious 3-bedroom, 2-bathroom home spans an impressive 1,526 square feet of living space and is set on a generous 9,801 square foot lot. The open-concept living and dining areas provide a seamless flow for everyday living and entertaining. The kitchen is a chef’s dream, featuring granite countertops, warm wood cabinetry, double ovens, a gas cooktop, and a pantry, offering excellent functionality and ample storage. Nestled on an oversized 9,801 square foot lot, the expansive backyard and covered patio create the perfect setting for relaxation, gatherings, or future enhancements. Conveniently located near shopping, dining, and key amenities, the home is easily accessible via Beltway 8, I-45, and Hwy 288. This true blank canvas is ready for personalization or investment strategy. Offered as-is, it’s not located in a flood zone.
-
2026-04-08$199,000 Active 857-char remark
Show marketing remark (857 chars)
This spacious 3-bedroom, 2-bathroom home spans an impressive 1,526 square feet of living space and is set on a generous 9,801 square foot lot. The open-concept living and dining areas provide a seamless flow for everyday living and entertaining. The kitchen is a chef’s dream, featuring granite countertops, warm wood cabinetry, double ovens, a gas cooktop, and a pantry, offering excellent functionality and ample storage. Nestled on an oversized 9,801 square foot lot, the expansive backyard and covered patio create the perfect setting for relaxation, gatherings, or future enhancements. Conveniently located near shopping, dining, and key amenities, the home is easily accessible via Beltway 8, I-45, and Hwy 288. This true blank canvas is ready for personalization or investment strategy. Offered as-is, it’s not located in a flood zone.
-
2026-03-30historical
-
2026-03-02status Active
-
2026-02-26status Pending
-
2026-02-17$199,000 Active
-
2026-02-04historical
-
2025-12-28price $200,000
-
2025-12-09$215,500 Active
-
2025-12-08historical
-
2025-11-11price $215,500
-
2025-09-10$219,500 Active
-
2023-08-01soldstatus
-
2023-08-01soldstatus
-
2022-04-12soldstatus
-
1988-01-02soldstatus
ⓘ Source: listings_history table (triggers on properties + properties_extension) + one-shot
backfill from property_details.listing_events for pre-trigger history.
Tax reassessment forecast TX · Resets to sale price
- Current annual tax
- $4,794 · $400/mo
- Projected year-2 tax
- $4,794 · $400/mo
- Expected delta
- $0/yr ($0/mo · 0.0%)
ⓘ Screening estimate from a state-policy table — verify with the county assessor before closing.
Climate risk First Street
- Flood 1/10 Low FEMA zone X (unshaded) · 0% chance over 30 yrs
- Wildfire 1/10 Low
- Heat 9/10 Extreme 7 d/yr ≥109°F today · 25 d/yr by 30 yrs out
- Wind 9/10 Extreme 99% chance of damaging wind over 30 yrs
- Air quality 2/10 Low 1 unhealthy d/yr today · 2 by 30 yrs out
Nearby sold comps map
Loading sold comps map…
Walkable amenities ~0.75 mi
Loading nearby amenities…
Taxation est. · year 1
- Rental income
- $23,704
- − Mortgage interest
- −$10,363
- − Property taxes
- −$4,794
- − Insurance
- −$925
- − Repairs & maintenance
- −$1,896
- − Management
- −$1,896
- − Depreciation
- −$5,382
- Taxable loss
- −$1,553
- Est. tax savings @ 24.0%
- +$373
- After-tax cash flow
- $1,738/yr
For passive investors: Depreciation is non-cash, so a rental often shows a tax loss while cash-flowing — sheltering income. Rental losses are passive: they offset passive income freely, and up to $25,000/yr can offset ordinary (W-2) income if you actively participate and your MAGI is under $100k (phasing out to $0 by $150k); unused losses carry forward. On sale, claimed depreciation is recaptured at up to 25%, and gains may owe capital-gains tax (a 1031 exchange can defer both). Figures are a year-1 estimate at your 24.0% rate — not tax advice; consult a CPA.
Schools (NCES district)
- District
- Houston ISD
- NCES district ID
- 4823640
- Math proficiency
- 27% ▼ -18.00%
- Reading proficiency
- 35% ▼ -6.00%
- Median HH income
- $46,054
- Composite
- 26.63/100
- National rank
- #7173
- State rank
- #593 of 826 in TX
Livability — Houston
- Score
- 74/100
- State rank
- #184
- US rank
- #4771
Category grades
Schools grade is shown separately in the Schools card above.
Census & demographics
- Census place
- Houston, TX
- County
- Harris County · 4,702,590 people
- City population
- 3,226,434
- Metro
- Houston-The Woodlands-Sugar Land, TX
- Population (ZIP)
- 40,626
- Household income
- $69,191
- Rent vs Own
- Severe rent burden
- 1573.0
Population outlook (Harris County) Hauer SSP2
- Today (2025)
- 5,571,493 people
- By 2030
- 6,089,821 · +9.3%
- By 2040
- 7,142,806 · +28.2%
- By 2050
- 8,185,864 · +46.9%
- By 2075
- 10,574,329 · +89.8%
- By 2100
- 12,109,958 · +117.4%
Race, ethnicity, and origin ACS 2023
- Neighborhood character
- Predominantly Hispanic (71%)
- Race & ethnicity
- Hispanic / Latino 71% Two or more races 34% Black 14% White 7% Asian 6% Native American 1%
- Hispanic origin (detail)
- Mexican 53%
- Common ancestry
- Lithuanian 1%
- Foreign-born
- 30% · Canada, Vietnam, Jamaica
- Languages at home
- 34% English-only · Spanish 60% Vietnamese 6%
Political lean MEDSL · Harris
- 2024 margin
- Lean D (+5.5) · D 52.0% · R 46.4% · Other 1.6%
- 2008→2024 swing
- +3.9pp toward D · 2008: 1.6pp · 2024: 5.5pp
- All cycles
- 2024: D+5.5 2020: D+13.3 2016: D+12.4 2012: D+0.1 2008: D+1.6
Not yet ingested
- Civics
- —
Market trends
- HPI YoY
- ▼ -88.33%
- Current HPI
- 260.3733
- Rent YoY
- ▲ 2.17%
- Metro
- Houston-The Woodlands-Sugar Land, TX
- State GDP YoY
- ▲ 3.95%
- F500 in state
- 110
Industry mix (Fortune 500 HQ in TX)
| Industry | F500 HQs | Revenue |
|---|---|---|
| Energy | 16 | $1,198B |
|
||
| Technology | 5 | $198B |
|
||
| Engineering / Construction | 4 | $72B |
|
||
| Energy Services | 3 | $60B |
|
||
| Utilities | 3 | $41B |
|
||
| Healthcare | 2 | $330B |
|
||
Price history
-15.7% since first listed16 events — show timeline
- 2026-05-13 Price Changed $185,000 HARMLS
- 2026-04-08 Listed $199,000 HARMLS
- 2026-03-30 Listing Removed — HARMLS
- 2026-03-02 Relisted — HARMLS
- 2026-02-26 Pending — HARMLS
- 2026-02-17 Listed $199,000 HARMLS
- 2026-02-04 Listing Removed — HARMLS
- 2025-12-28 Price Changed $200,000 HARMLS
- 2025-12-09 Listed $215,500 HARMLS
- 2025-12-08 Listing Removed — HARMLS
- 2025-11-11 Price Changed $215,500 HARMLS
- 2025-09-10 Listed $219,500 HARMLS
- 2023-08-01 Sold (Public Records) — Public Records
- 2023-08-01 Sold (Public Records) — Public Records
- 2022-04-12 Sold (Public Records) — Public Records
- 1988-01-02 Sold (Public Records) — Public Records
Property tax history
+5.3%/yrLatest (2025): $4,794 · +1.6% YoY. Source: county tax records.
Cash-flow waterfall
monthlySold comps — $/sqft
last 12 mo · ≤1 miLoading sold comps…