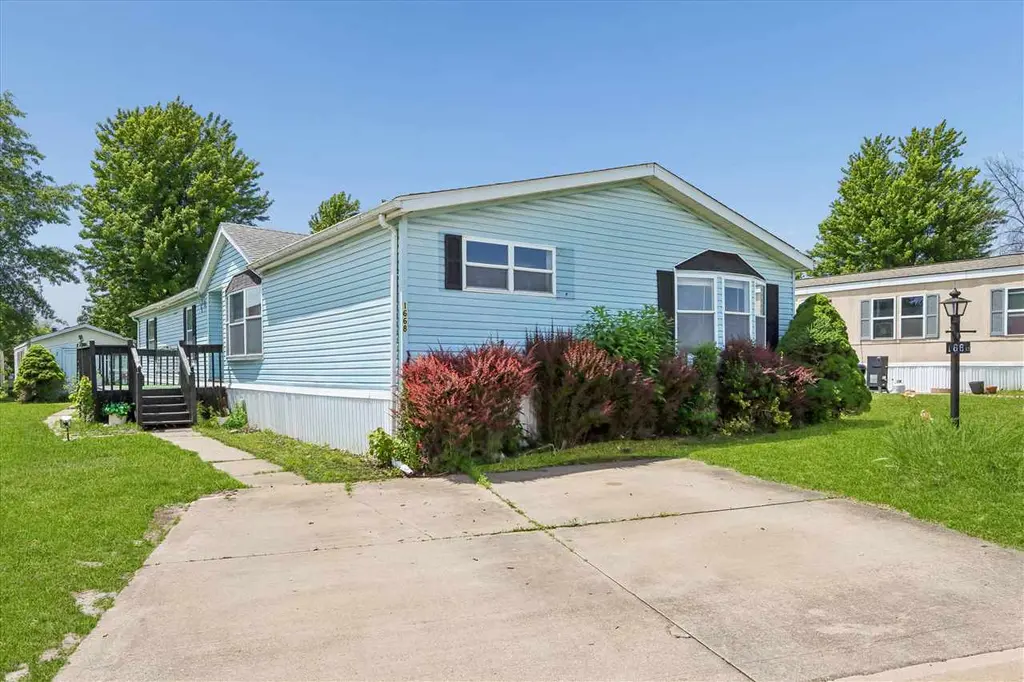
1668 Apache Dr · Marion, IA
Flood risk 1/10 · Minimal
- FEMA flood zone
- X (unshaded)
- Chance of flooding over 30 yrs
- 0.0%
- Est. flood insurance / yr
- $473 – $860
Fire risk 1/10 · Minimal
- Est. fire insurance / yr
- $902 – $1,676
Heat risk 3/10 · Minor
- Hot days now (above 103°F)
- 7 days/yr
- Hot days in 30 yrs
- 15 days/yr
Wind risk 2/10 · Minimal
- Chance of severe wind over 30 yrs
- —
Air-quality risk 2/10 · Minimal
- Unhealthy air days now
- 1 days/yr
- Unhealthy air days in 30 yrs
- 2 days/yr
Risk factors via First Street. Map © Google.
Why this score? — see what drove the B- grade
The composite is a weighted blend of 9 inputs, each scored 0–100. Each bar is that input's sub-score; the figure is the points it added to the 100-point composite (weight × sub-score).
- Cash flow +30.0/30.0
- 1% rule +10.0/10.0
- DSCR +10.0/10.0
- Schools +6.6/10.0
- Rent growth +4.6/5.0
- Livability +4.2/5.0
- Condition / age +2.8/5.0
- ARV discount +1.1/15.0
- Appreciation +0.0/10.0
$50,000
🖨 Deal sheet 📄 Offer letter ✓ Due diligence
Listing remarks
Don't miss an opportunity to have a 3 bedroom 2 bath home at Squaw Creek Village. The large primary features a full bathroom and full closet. The living room offers a fireplace. Next to the living room is the dining room, kitchen, and family room. This amazing kitchen comes with all appliances and also a pantry. With the large deck there is plenty of space for entertaining. This home comes with a shed. This home won't last long. Schedule a showing today. This home is sold As Is, where is. Home is on leased land with monthly lot rent. Park approval required for potential buyers.
Key facts
- Pantry
- Large deck
- Full bathroom
Tags
Property features AI
Finance
- Other: Property listed as a manufactured/mobile home
- HOA & community: Annual association fee; Community sidewalks and street lights; Subdivision: Squaw Creek Village
Exterior
- Parking: Off-street parking for 2 vehicles
- Utilities: Public water; Public sewer
- Home design: Manufactured house; Single-story; Residential property
- Construction: Vinyl and wood siding; Built by Lakepointe
- Exterior features: Deck; Shed(s); Level lot
Interior
- Kitchen: Dishwasher; Refrigerator
- Bedrooms: Master downstairs
- Flooring: Carpet
- Bathrooms: 2 full bathrooms
- Heating & cooling: Central air conditioning; Forced air heating; Fireplace in living room (1 total)
- Interior features: Kitchen island; High ceilings; Breakfast bar; Pantry; Master bedroom on main level; Other interior features
- Laundry & utility: Washer; Dryer; Main-level laundry room
Neighborhood map
What this means for you Summary
Snapshot
- This is a 3-bed/2.0-bath manufactured listed at $50k. Condition is rated average.
Deal economics
- At list price, monthly cash flow is $982 ($12k/yr) — positive.
- The deal already cash-flows at list — no discount required.
- Meets the 1% rule at list price ($2k rent vs $50k).
- Cap rate 29.9% vs local median 2.7% in Marion — top-decile yield for the area; either an underpriced asset or a hidden risk that comps aren't pricing in. Stress-test before assuming the spread holds.
Location & tenants
- Location reads 84/100 on livability (#19 in IA, #633 nationally) — a professional / high-income tenant draw. Strengths: schools A+, crime A+, cost of living A+; Watch: amenities D-, commute F.
- Linn-Mar Community School District (suburban): math 75% / reading 76% proficiency, ranked #44 of 289 in IA (top 15%) — strong family-tenant draw, lease renewals of 3-5y typical; only 16% free/reduced lunch — higher-income household profile.
- Market conditions: Rents rising fast (+8.4%/yr); 455 active listings in the ZIP; 1 comparable units currently listed for rent nearby; solid renter incomes; 1,023 units permitted in Linn County in 2024 (456 in 5+ unit buildings).
Forward outlook
- Local home prices are declining (-3.0%/yr); year-one equity from $346 of loan paydown is wiped out by about $2k of value loss. Plan a longer hold.
- Linn County population projected at +16% by 2050 — long-run rental-demand tailwind backs the buy-and-hold thesis.
- At projected returns (-3.0% appreciation + 8.0% rent growth), your $14k cash investment doubles in ~2 years — after that, you're playing with house money.
Negotiation context
- Only 7 days on market — expect competitive offers; lowballing is unlikely to land.
Questions for the listing agent
- Is there a deadline driving the sale (1031 exchange, divorce, estate, relocation)? That informs how much negotiation room exists.
- Schools are A-rated — typically a magnet for longer-tenancy family renters. What's the average tenant stay here, and is there a school-zone premium baked into asking?
- What's the average days-on-market for RENTAL listings here right now (not sales)? A rising rental-DOM trend means longer vacancies and softer asking-rent achievability than the comps imply.
- What's the recent tenant-quality profile in this submarket — average credit score on applications, eviction rate, late-payment / NSF rate, and stable-employment percentage? A property-management company in the area should have these aggregated.
- How much new for-sale + rental construction is in the pipeline within 1–3 miles? Heavy new supply typically softens prices + rents 12–24 months out; constrained supply supports both.
Investment metrics
- 1% rule
- 3.36% ✓
- Cap rate
- 29.86%
- Cash-on-cash
- 84.17%
- DSCR
- 4.75
- GRM
- 2.5
CMA / ARV
- ARV (on-the-fly)
- $43,792
- Comps found
- 1
Show comp detail 1 sale within ~0.75 mi
| Address | Dist | Beds/Ba | Sqft | Sold | Price | $/sf | Match |
|---|---|---|---|---|---|---|---|
| 6210 Christine Dr | 0.19mi | 3/2.0 | 1,848 (-3%) | 23mo | $43,000 | $23 | 67 |
Match score weights: distance 35% · size 25% · config 20% · recency 20%. Top-matched comps best support the ARV.
Projected returns pro-forma
-3.0% appreciation · 8.0% rent growth · sell at horizon
- IRR
- 90.2%
- Equity multiple
- 5.52×
- Total profit
- $63,346
- Equity at exit
- $7,455
- IRR
- 94.2%
- Equity multiple
- 13.59×
- Total profit
- $176,215
- Equity at exit
- $4,323
Cash invested: $14,000 (down + closing). Projections, not guarantees.
Landlord ↔ Tenant lean methodology
- Overall (STATE)
- 83 Strongly Landlord-Friendly
- State Iowa
- 83 Strongly Landlord-Friendly · R+6
- County
- — inherits STATE
- City
- — inherits STATE
ZIP-level market 52302
- Rents YoY
- 8.4%
- Active inventory
- 455
- Price-to-rent
- 2.5×
Monthly cashflow live
- Estimated rent
- $1,680 medium interval (Pro) →
- Mortgage (P&I)
- −$262
- Tax est. 1.5%
- −$62 /mo · $750/yr
- Insurance
- −$21
- HOA
- −$0
- Vacancy / Maint / Mgmt
- −$353
- Net cashflow
- $982
Break-even live
UW: 25.0% down · 7.5% · 30yr · 1.5% tax · 5.0% vac · 8.0% maint · 8.0% mgmt
Financing live
Cash to close
- Down payment
- $12,500
- Closing costs
- $1,500
- Reserves months
- —
- Total cash needed
- —
Loan-product check · same deal, 3 products live
Conventional
25% down · 7.5% · 30yr
- Down + closing
- —
- Monthly P&I
- —
- Monthly cashflow
- —
- DSCR
- —
- Eligible?
- —
Personal DTI + credit; lowest rate.
DSCR
20% down · 8.5% · 30yr
- Down + closing
- —
- Monthly P&I
- —
- Monthly cashflow
- —
- DSCR
- —
- Eligible?
- —
No personal income docs; deal must DSCR.
Hard money
10% down · 12.0% · 12mo
- Down + closing
- —
- Monthly P&I
- —
- Monthly cashflow
- —
- DSCR
- —
- Eligible?
- —
Short-term bridge; refi at stabilization.
Rent comps 1 comps
| Address | Beds | Baths | Sqft | Rent | $/sqft | DOM | Units | Dist |
|---|---|---|---|---|---|---|---|---|
| 1975 49th St Marion, IA | 3.0 | 2.0 | 1449 | $2,175 | $1.50 | 13d | 1 | 0.52mi |
Listing history 6 events
-
2026-06-03statusdays on market $50,000 Pending 7 DOM
-
2026-06-02days on market $50,000 Active 6 DOM
-
2026-06-01days on market $50,000 Active 5 DOM
-
2026-05-31days on market $50,000 Active 4 DOM
-
2026-05-30days on market $50,000 Active 3 DOM
-
2026-05-27$50,000 Active
ⓘ Source: listings_history table (triggers on properties + properties_extension) + one-shot
backfill from property_details.listing_events for pre-trigger history.
Climate risk First Street
- Flood 1/10 Low FEMA zone X (unshaded) · 0% chance over 30 yrs
- Wildfire 1/10 Low
- Heat 3/10 Moderate 7 d/yr ≥103°F today · 15 d/yr by 30 yrs out
- Wind 2/10 Low
- Air quality 2/10 Low 1 unhealthy d/yr today · 2 by 30 yrs out
Nearby sold comps map
Loading sold comps map…
Walkable amenities ~0.75 mi
Loading nearby amenities…
Taxation est. · year 1
- Rental income
- $20,165
- − Mortgage interest
- −$2,801
- − Property taxes
- −$750
- − Insurance
- −$250
- − Repairs & maintenance
- −$1,613
- − Management
- −$1,613
- − Depreciation
- −$1,455
- Taxable income
- $11,683
- Est. tax owed @ 24.0%
- −$2,804
- After-tax cash flow
- $8,980/yr
For passive investors: Depreciation is non-cash, so a rental often shows a tax loss while cash-flowing — sheltering income. Rental losses are passive: they offset passive income freely, and up to $25,000/yr can offset ordinary (W-2) income if you actively participate and your MAGI is under $100k (phasing out to $0 by $150k); unused losses carry forward. On sale, claimed depreciation is recaptured at up to 25%, and gains may owe capital-gains tax (a 1031 exchange can defer both). Figures are a year-1 estimate at your 24.0% rate — not tax advice; consult a CPA.
Condition & rehab AI · 12 photos
This 3-bedroom, 2-bath home at Squaw Creek Village is in average condition with cosmetic updates needed. Fresh paint, new carpeting, and modernizing the kitchen would significantly boost its value.
Repairs flagged
- Moderate kitchen cabinets — dated and worn
- Moderate bathroom fixtures — dated and worn
- Minor exterior siding — light discoloration
Value-add opportunities
- Resale paint interior walls — fresh paint enhances curb appeal
- Resale replace carpeting — new carpeting improves comfort and appearance
- Both update kitchen cabinets and fixtures — modernizing kitchen boosts both resale and rental value
- Both landscaping — improved landscaping enhances curb appeal and rental value
Renovation cost estimate screening
| Repair item | Severity | Est. cost |
|---|---|---|
| kitchen cabinets · dated and worn | Moderate | $3,000–15,000 |
| bathroom fixtures · dated and worn | Moderate | $3,000–15,000 |
| exterior siding · light discoloration | Minor | $500–3,000 |
| Total estimated repair cost · 3 items | $6,500–33,000 |
Value-add ROI direction
- Resale paint interior walls — fresh paint enhances curb appeal ↑
- Resale replace carpeting — new carpeting improves comfort and appearance ↑
- Both update kitchen cabinets and fixtures — modernizing kitchen boosts both resale and rental value ↑
- Both landscaping — improved landscaping enhances curb appeal and rental value ↑
ⓘ Cost ranges are severity-bucket heuristics (US national rule-of-thumb). Get contractor quotes + a written scope before underwriting a rehab budget.
Schools (NCES district)
- District
- Linn-Mar Community School District
- NCES district ID
- 1917220
- Math proficiency
- 75% ▼ -7.00%
- Reading proficiency
- 76% ▼ -5.00%
- Median HH income
- $72,473
- Composite
- 66.08/100
- National rank
- #440
- State rank
- #44 of 289 in IA
Livability — Marion
- Score
- 84/100
- State rank
- #19
- US rank
- #633
Category grades
Schools grade is shown separately in the Schools card above.
Census & demographics
- Census place
- Marion, IA
- County
- Linn County · 179,860 people
- City population
- 42,706
- Metro
- Cedar Rapids, IA
- Population (ZIP)
- 42,706
- Household income
- $87,983
- Rent vs Own
- Severe rent burden
- 940.0
Population outlook (Linn County) Hauer SSP2
- Today (2025)
- 239,589 people
- By 2030
- 248,587 · +3.8%
- By 2040
- 264,817 · +10.5%
- By 2050
- 278,685 · +16.3%
- By 2075
- 311,754 · +30.1%
- By 2100
- 336,773 · +40.6%
Race, ethnicity, and origin ACS 2023
- Neighborhood character
- Predominantly White (89%)
- Race & ethnicity
- White 89% Two or more races 4% Hispanic / Latino 3% Black 3% Asian 2%
- Common ancestry
- Portuguese 6% Iranian 3% Slovak 2%
- Foreign-born
- 3% · Canada
- Languages at home
- 96% English-only · Spanish 1% Other Indo-European 1%
Political lean MEDSL · Linn
- 2024 margin
- Lean D (+9.9) · D 54.2% · R 44.3% · Other 1.4%
- 2008→2024 swing
- -11.6pp toward R · 2008: 21.5pp · 2024: 9.9pp
- All cycles
- 2024: D+9.9 2020: D+13.7 2016: D+9.0 2012: D+17.6 2008: D+21.5
Not yet ingested
- Civics
- —
Market trends
- HPI YoY
- ▼ -144.98%
- Current HPI
- 199.2949
- Rent YoY
- ▲ 8.37%
- Metro
- Cedar Rapids, IA
- State GDP YoY
- ▲ 2.48%
- F500 in state
- 4
Industry mix (Fortune 500 HQ in IA)
| Industry | F500 HQs | Revenue |
|---|---|---|
| Financial Services | 1 | $16B |
|
||
| Retail / Convenience | 1 | $15B |
|
||
Price history
1 event — show timeline
- 2026-05-27 Listed $50,000 ICAARMLS
Cash-flow waterfall
monthlySold comps — $/sqft
last 12 mo · ≤1 miLoading sold comps…