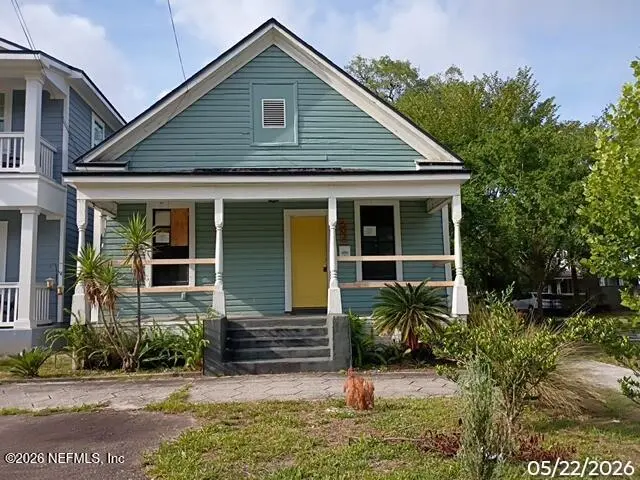
502 E 5th St · Jacksonville, FL
Flood risk 6/10 · Moderate
- FEMA flood zone
- X (unshaded)
- Chance of flooding over 30 yrs
- 0.72%
- Est. flood insurance / yr
- $507 – $1,088
Fire risk 1/10 · Minimal
- Est. fire insurance / yr
- $947 – $1,759
Heat risk 9/10 · Severe
- Hot days now (above 107°F)
- 7 days/yr
- Hot days in 30 yrs
- 19 days/yr
Wind risk 9/10 · Severe
- Chance of severe wind over 30 yrs
- 99.0%
Air-quality risk 4/10 · Minor
- Unhealthy air days now
- 6 days/yr
- Unhealthy air days in 30 yrs
- 6 days/yr
Risk factors via First Street. Map © Google.
Why this score? — see what drove the C+ grade
The composite is a weighted blend of 9 inputs, each scored 0–100. Each bar is that input's sub-score; the figure is the points it added to the 100-point composite (weight × sub-score).
- Cash flow +21.5/30.0
- ARV discount +13.2/15.0
- 1% rule +7.0/10.0
- DSCR +6.9/10.0
- Livability +4.2/5.0
- Schools +3.9/10.0
- Rent growth +2.7/5.0
- Condition / age +2.5/5.0
- Appreciation +0.0/10.0
$105,000
🖨 Deal sheet 📄 Offer letter ✓ Due diligence
Listing remarks MLS
Charming and renovated bungalow in the urban core features two nice size bedrooms, a 2 year old roof, fresh paint inside and out and beautiful wood floors. The home sits on a corner lot with a lovely, fenced backyard perfect for entertaining. Come be a part of the vibrant Historic Springfield neighborhood.
Key facts
- Vinyl flooring
- Centrally located
- Updated kitchen
Tags
Property features AI
Finance
- HOA & community: Not a senior community
Exterior
- Parking: Other parking
- Utilities: Electricity available
- Home design: Single family residence; One level
- Exterior features: No private pool; Lot is approximately 0.07 acres
Interior
- Kitchen: Electric oven; Refrigerator
- Bedrooms: 2 bedrooms
- Bathrooms: 1 full bathroom
- Interior features: Central air conditioning; Electric heating
Neighborhood map
What this means for you Summary
Snapshot
- This is a 2-bed/1.0-bath single-family listed at $105k.
Deal economics
- At list price, monthly cash flow is $158 ($2k/yr) — positive.
- The deal already cash-flows at list — no discount required.
- Meets the 1% rule at list price ($1k rent vs $105k).
- Cap rate 8.1% vs local median 4.0% in Jacksonville — top-decile yield for the area; either an underpriced asset or a hidden risk that comps aren't pricing in. Stress-test before assuming the spread holds.
Location & tenants
- Location reads 83/100 on livability (#50 in FL, #911 nationally) — a professional / high-income tenant draw. Strengths: amenities A+, commute A+, housing A+.
- Duval (urban): math 46% / reading 45% proficiency, ranked #48 of 73 in FL (top 66%) — families likely to look elsewhere, expect single-tenant / working-renter base with shorter leases.
- Market conditions: Rents flat; 194 active listings in the ZIP; 40 comparable units currently listed for rent nearby; rentals at typical pace (median 24d on market — plan ~3-4 weeks tenant-placement turnaround); lower-income renter base — watch delinquency; 6,503 units permitted in Duval County in 2024 (1,131 in 5+ unit buildings).
- This rent runs 38% of the median local income ($39k/yr) — at the standard rent-burdened threshold; future hikes will face affordability resistance.
Forward outlook
- Local home prices are declining (-3.0%/yr); year-one equity from $726 of loan paydown is wiped out by about $3k of value loss. Plan a longer hold.
- Duval County population projected at +19% by 2050 — long-run rental-demand tailwind backs the buy-and-hold thesis.
Negotiation context
- Only 9 days on market — expect competitive offers; lowballing is unlikely to land.
- 6 sale attempts since 16y ago with the ask held roughly flat each time — persistent listings suggest the price (not the market) is what's stuck; bring a comps-based counter.
Risks & watch-outs
- Watch-outs: property tax is 2.7% of price; built in 1908 — expect roof / HVAC / electrical / plumbing capex.
- Climate carrying-cost: major flood risk; severe wind risk, 99% chance of damaging wind over 30y; extreme-heat days projected 7→19/yr by 2055 (HVAC capex compounding) — expect insurance premiums to compound above CPI over the hold.
Questions for the listing agent
- Built in 1908 — when were the roof, HVAC, electrical panel, plumbing, and water heater last replaced?
- Property tax is high relative to price — has the assessment been appealed recently, and will the sale trigger a re-assessment?
- Is there a deadline driving the sale (1031 exchange, divorce, estate, relocation)? That informs how much negotiation room exists.
- Schools are B-rated — typically a magnet for longer-tenancy family renters. What's the average tenant stay here, and is there a school-zone premium baked into asking?
- What's the average days-on-market for RENTAL listings here right now (not sales)? A rising rental-DOM trend means longer vacancies and softer asking-rent achievability than the comps imply.
- What's the recent tenant-quality profile in this submarket — average credit score on applications, eviction rate, late-payment / NSF rate, and stable-employment percentage? A property-management company in the area should have these aggregated.
- How much new for-sale + rental construction is in the pipeline within 1–3 miles? Heavy new supply typically softens prices + rents 12–24 months out; constrained supply supports both.
Investment metrics
- 1% rule
- 1.20% ✓
- Cap rate
- 8.10%
- Cash-on-cash
- 6.47%
- DSCR
- 1.29
- GRM
- 7.0
CMA / ARV
- ARV (on-the-fly)
- $120,250
- Comps found
- 12
Show comp detail 12 sales within ~0.75 mi
| Address | Dist | Beds/Ba | Sqft | Sold | Price | $/sf | Match |
|---|---|---|---|---|---|---|---|
| 1528 Van Buren St | 0.33mi | 2/1.0 | 1,008 (+9%) | 3mo | $73,000 | $72 | 67 |
| 1311 Franklin St | 0.47mi | 2/1.0 | 921 (-0%) | 20mo | $120,000 | $130 | 61 |
| 526 Pippin St | 0.63mi | 3/1.0 (+1) | 950 (+3%) | 1mo | $156,900 | $165 | 60 |
| 1046 Dyal St | 0.60mi | 2/2.0 | 980 (+6%) | 10mo | $163,569 | $167 | 50 |
| 817 Van Buren St | 0.73mi | 2/1.0 | 950 (+3%) | 15mo | $49,500 | $52 | 49 |
| 1157 E 3rd St | 0.44mi | 3/1.0 (+1) | 789 (-15%) | 3mo | $74,000 | $94 | 47 |
| 1138 Bridier St | 0.55mi | 2/1.0 | 1,010 (+9%) | 19mo | $50,000 | $50 | 43 |
| 1136 Bridier St | 0.55mi | 2/1.0 | 840 (-9%) | 19mo | $50,000 | $60 | 43 |
| 1108 Odessa St | 0.68mi | 2/1.0 | 800 (-14%) | 5mo | $147,017 | $184 | 42 |
| 1851 Florida Ave | 0.45mi | 3/1.0 (+1) | 1,056 (+14%) | 12mo | $108,500 | $103 | 41 |
| 2031 Evergreen Ave | 0.57mi | 2/1.0 | 792 (-14%) | 13mo | $115,000 | $145 | 39 |
| 1049 E Union St | 0.73mi | 2/2.0 | 810 (-12%) | 13mo | $154,000 | $190 | 30 |
Match score weights: distance 35% · size 25% · config 20% · recency 20%. Top-matched comps best support the ARV.
Projected returns pro-forma
-3.0% appreciation · 0.94% rent growth · sell at horizon
- IRR
- -8.9%
- Equity multiple
- 0.68×
- Total profit
- $-9,393
- Equity at exit
- $15,656
- IRR
- -2.8%
- Equity multiple
- 0.83×
- Total profit
- $-4,890
- Equity at exit
- $9,078
Cash invested: $29,400 (down + closing). Projections, not guarantees.
Landlord ↔ Tenant lean methodology
- Overall (STATE)
- 87 Strongly Landlord-Friendly
- State Florida
- 87 Strongly Landlord-Friendly · R+3
- County
- — inherits STATE
- City
- — inherits STATE
ZIP-level market 32206
- Home prices YoY
- -23.7%
- Rents YoY
- 0.9%
- Active inventory
- 194
- Price-to-rent
- 7.0×
Monthly cashflow live
- Estimated rent
- $1,257 high interval (Pro) →
- Mortgage (P&I)
- −$551
- Tax from tax record
- −$240 /mo · $2,883/yr
- Insurance
- −$44
- HOA
- −$0
- Vacancy / Maint / Mgmt
- −$264
- Net cashflow
- $158
Break-even live
UW: 25.0% down · 7.5% · 30yr · 1.5% tax · 5.0% vac · 8.0% maint · 8.0% mgmt
Financing live
Cash to close
- Down payment
- $26,250
- Closing costs
- $3,150
- Reserves months
- —
- Total cash needed
- —
Loan-product check · same deal, 3 products live
Conventional
25% down · 7.5% · 30yr
- Down + closing
- —
- Monthly P&I
- —
- Monthly cashflow
- —
- DSCR
- —
- Eligible?
- —
Personal DTI + credit; lowest rate.
DSCR
20% down · 8.5% · 30yr
- Down + closing
- —
- Monthly P&I
- —
- Monthly cashflow
- —
- DSCR
- —
- Eligible?
- —
No personal income docs; deal must DSCR.
Hard money
10% down · 12.0% · 12mo
- Down + closing
- —
- Monthly P&I
- —
- Monthly cashflow
- —
- DSCR
- —
- Eligible?
- —
Short-term bridge; refi at stabilization.
Rent comps 40 comps
| Address | Beds | Baths | Sqft | Rent | $/sqft | DOM | Units | Dist |
|---|---|---|---|---|---|---|---|---|
| 443 E 3rd St Jacksonville, FL | 2.0 | 2.0 | 1008 | $1,750 | $1.74 | 16d | 1 | 0.16mi |
| 1353 Palmetto St Jacksonville, FL | 3.0 | 2.0 | 1000 | $1,330 | $1.33 | 24d | 1 | 0.17mi |
| 317 E 6th St Jacksonville, FL | 1.0 | 1.0 | 900 | $1,425 | $1.58 | 24d | 1 | 0.18mi |
| 1529 Spearing St Jacksonville, FL | 3.0 | 2.0 | 1077 | $1,425 | $1.32 | 4d | 1 | 0.21mi |
| 1226 Clark St Jacksonville, FL | 2.0 | 1.0 | 966 | $1,175 | $1.22 | 24d | 1 | 0.23mi |
| 1736 Ionia St Jacksonville, FL | 2.0 | 1.0 | 1036 | $1,650 | $1.59 | 17d | 1 | 0.25mi |
| 720 E 3rd St Jacksonville, FL | 3.0 | 1.0 | 1076 | $1,075 | $1.00 | 24d | 1 | 0.28mi |
| 140 E 5th St Jacksonville, FL | 1.0 | 1.0 | 600 | $900 | $1.50 | 24d | 1 | 0.29mi |
| 1362 Florida Ave Jacksonville, FL | 3.0 | 2.0 | 1000 | $1,268 | $1.27 | 3d | 1 | 0.29mi |
| 1364 Harrison St Jacksonville, FL | 2.0 | 1.0 | 725 | $900 | $1.24 | 24d | 2 | 0.40mi |
| 1128 Van Buren St Unit 1 Jacksonville, FL | 2.0 | 1.0 | 744 | $1,000 | $1.34 | 24d | 1 | 0.43mi |
| 111 E 1st St #16 Jacksonville, FL | 2.0 | 1.5 | 972 | $1,250 | $1.29 | 24d | 1 | 0.44mi |
| 1055 E 1st St Unit 101 Jacksonville, FL | 1.0 | 1.0 | 800 | $800 | $1.00 | 4d | 1 | 0.44mi |
| 35 E 2nd St Jacksonville, FL | 1.0 | 1.0 | 650 | $1,175 | $1.81 | 11d | 1 | 0.45mi |
| 1851 Florida Ave Jacksonville, FL | 1.0 | 1.0 | 1000 | $650 | $0.65 | 4d | 1 | 0.46mi |
| 11 E 7th St Unit 1 Jacksonville, FL | 2.0 | 1.0 | 900 | $1,150 | $1.28 | 24d | 1 | 0.47mi |
| 960 Palmetto St Jacksonville, FL | 2.0 | 2.5 | 998 | $1,188 | $1.19 | 4d | 1 | 0.51mi |
| 1361 Bridier St Apt 2 Jacksonville, FL | 2.0 | 1.0 | 700 | $935 | $1.34 | 12d | 1 | 0.55mi |
| 1148 N Main St Jacksonville, FL | 2.0 | 1.0–2.0 | 931 | $2,195 | $2.36 | 2d | 23 | 0.57mi |
| 1934 Hubbard St Jacksonville, FL | 1.0 | 1.0 | 600 | $990 | $1.65 | 24d | 1 | 0.58mi |
| 1109 Phelps St Jacksonville, FL | 3.0 | 1.0 | 1120 | $850 | $0.76 | 8d | 1 | 0.58mi |
| 1131 Phelps St Jacksonville, FL | 3.0 | 1.0 | 1120 | $895 | $0.80 | 24d | 1 | 0.60mi |
| 850 Spearing St Jacksonville, FL | 2.0 | 1.0 | 792 | $950 | $1.20 | 2d | 1 | 0.61mi |
| 115 W 2nd St Unit 2 Jacksonville, FL | 1.0 | 1.5 | 1100 | $2,000 | $1.82 | 24d | 1 | 0.62mi |
| 743 Pippin St Unit 743 Jacksonville, FL | 2.0 | 1.0 | 630 | $750 | $1.19 | 24d | 1 | 0.65mi |
| 835 E Union St Jacksonville, FL | 3.0 | 1.0 | 854 | $950 | $1.11 | 8d | 1 | 0.67mi |
| 1049 Pippin St Unit B Jacksonville, FL | 2.0 | 1.0 | 800 | $1,200 | $1.50 | 8d | 1 | 0.70mi |
| 700 E Union St Jacksonville, FL | 1.0–3.0 | 1.0–2.0 | 1070 | $2,325 | $2.17 | 4d | 63 | 0.73mi |
| 2025 N Laura St Jacksonville, FL | 2.0 | 1.0 | 1000 | $1,195 | $1.20 | 4d | 1 | 0.74mi |
| 2063 N Laura St Jacksonville, FL | 2.0 | 1.0 | 900 | $1,250 | $1.39 | 24d | 1 | 0.78mi |
| 1504 Perry St Jacksonville, FL | 1.0 | 1.0 | 600 | $1,025 | $1.71 | 12d | 1 | 0.83mi |
| 1504 Perry St Jacksonville, FL | 2.0 | 1.0 | 800 | $1,275 | $1.59 | 15d | 1 | 0.83mi |
| 1504 Perry St Unit 207 Jacksonville, FL | 1.0 | 1.0 | 600 | $1,025 | $1.71 | 15d | 1 | 0.83mi |
| 229 W 10th St Jacksonville, FL | 1.0 | 1.0 | 900 | $1,150 | $1.28 | 24d | 1 | 0.84mi |
| 231 W 10th St Unit 229 Jacksonville, FL | 1.0 | 1.0 | 900 | $1,150 | $1.28 | 24d | 1 | 0.84mi |
| 2514 Walnut St Unit 2520 Jacksonville, FL | 2.0 | 1.0 | 1119 | $1,100 | $0.98 | 24d | 1 | 0.85mi |
| 1627 E 9th St Unit 1629 Jacksonville, FL | 2.0 | 1.0 | 656 | $1,050 | $1.60 | 24d | 1 | 0.90mi |
| 112 E 17th St Unit 1 Jacksonville, FL | 1.0 | 1.0 | 700 | $800 | $1.14 | 24d | 1 | 0.94mi |
| 1976 Lambert St Jacksonville, FL | 3.0 | 1.0 | 1012 | $1,115 | $1.10 | 24d | 1 | 0.94mi |
| 203 E 17th St #1 Jacksonville, FL | 1.0 | 1.0 | 943 | $847 | $0.90 | 24d | 1 | 0.95mi |
Listing history 8 events
-
2026-06-13statusdays on market $105,000 Pending 9 DOM
-
2026-06-10days on market $105,000 Active 7 DOM
-
2026-06-08days on market $105,000 Active 6 DOM
-
2026-06-07days on market $105,000 Active 5 DOM
-
2026-06-05days on market $105,000 Active 2 DOM
-
2026-06-03remarks 537-char remark
-
2026-06-02remarks 476-char remark
-
2026-06-02$105,000 Active 1 DOM
ⓘ Source: listings_history table (triggers on properties + properties_extension) + one-shot
backfill from property_details.listing_events for pre-trigger history.
Tax reassessment forecast FL · Resets to sale price
- Current annual tax
- $2,883 · $240/mo
- Projected year-2 tax
- $2,883 · $240/mo
- Expected delta
- $0/yr ($0/mo · 0.0%)
ⓘ Screening estimate from a state-policy table — verify with the county assessor before closing.
Climate risk First Street
- Flood 6/10 Major FEMA zone X (unshaded) · 72% chance over 30 yrs
- Wildfire 1/10 Low
- Heat 9/10 Extreme 7 d/yr ≥107°F today · 19 d/yr by 30 yrs out
- Wind 9/10 Extreme 99% chance of damaging wind over 30 yrs
- Air quality 4/10 Moderate 6 unhealthy d/yr today · 6 by 30 yrs out
Nearby sold comps map
Loading sold comps map…
Walkable amenities ~0.75 mi
Loading nearby amenities…
Taxation est. · year 1
- Rental income
- $15,084
- − Mortgage interest
- −$5,882
- − Property taxes
- −$2,883
- − Insurance
- −$525
- − Repairs & maintenance
- −$1,207
- − Management
- −$1,207
- − Depreciation
- −$3,055
- Taxable income
- $327
- Est. tax owed @ 24.0%
- −$78
- After-tax cash flow
- $1,823/yr
For passive investors: Depreciation is non-cash, so a rental often shows a tax loss while cash-flowing — sheltering income. Rental losses are passive: they offset passive income freely, and up to $25,000/yr can offset ordinary (W-2) income if you actively participate and your MAGI is under $100k (phasing out to $0 by $150k); unused losses carry forward. On sale, claimed depreciation is recaptured at up to 25%, and gains may owe capital-gains tax (a 1031 exchange can defer both). Figures are a year-1 estimate at your 24.0% rate — not tax advice; consult a CPA.
Schools (NCES district)
- District
- Duval
- NCES district ID
- 1200480
- Math proficiency
- 46% ▼ -11.00%
- Reading proficiency
- 45% ▼ -4.00%
- Median HH income
- $48,987
- Composite
- 38.97/100
- National rank
- #4076
- State rank
- #48 of 73 in FL
Livability — Jacksonville
- Score
- 83/100
- State rank
- #50
- US rank
- #911
Category grades
Schools grade is shown separately in the Schools card above.
Census & demographics
- Census place
- Jacksonville, FL
- County
- Duval County · 1,015,274 people
- City population
- 979,034
- Metro
- Jacksonville, FL
- Population (ZIP)
- 17,105
- Household income
- $39,242
- Rent vs Own
- Severe rent burden
- 1057.0
Population outlook (Duval County) Hauer SSP2
- Today (2025)
- 1,013,010 people
- By 2030
- 1,059,228 · +4.6%
- By 2040
- 1,141,439 · +12.7%
- By 2050
- 1,205,258 · +19.0%
- By 2075
- 1,324,282 · +30.7%
- By 2100
- 1,319,620 · +30.3%
Race, ethnicity, and origin ACS 2023
- Neighborhood character
- Predominantly Black (65%)
- Race & ethnicity
- Black 65% White 22% Two or more races 8% Hispanic / Latino 6%
- Hispanic origin (detail)
- Mexican 1% Puerto Rican 2%
- Common ancestry
- Italian 2% Romanian 1% Slovak 1%
- Foreign-born
- 5% · Canada
- Languages at home
- 93% English-only · Spanish 3% Arabic 1% German/W. Germanic 1%
Political lean MEDSL · Duval
- 2024 margin
- Toss-up / Even · D 48.7% · R 50.1% · Other 1.2%
- 2008→2024 swing
- +0.4pp no change · 2008: -1.9pp · 2024: -1.5pp
- All cycles
- 2024: R+1.5 2020: D+3.8 2016: R+1.5 2012: R+3.6 2008: R+1.9
Not yet ingested
- Civics
- —
Market trends
- HPI YoY
- ▼ -64.55%
- Current HPI
- 208.1852
- Rent YoY
- ▲ 0.94%
- Metro
- Jacksonville, FL
- State GDP YoY
- ▲ 3.28%
- F500 in state
- 36
Industry mix (Fortune 500 HQ in FL)
| Industry | F500 HQs | Revenue |
|---|---|---|
| Industrial Technology | 2 | $29B |
|
||
| Insurance | 2 | $17B |
|
||
| Retail | 1 | $60B |
|
||
| Technology Distribution | 1 | $58B |
|
||
| Homebuilding | 1 | $35B |
|
||
| Technology Manufacturing | 1 | $35B |
|
||
Price history
+238.7% since first listed21 events — show timeline
- 2026-06-02 Listed $105,000 realMLS
- 2021-09-30 Sold (Public Records) $200,000 Public Records
- 2021-09-22 Sold (MLS) $200,000 realMLS
- 2021-08-20 Pending — realMLS
- 2021-07-17 Contingent — realMLS
- 2021-07-04 Price Changed $215,000 realMLS
- 2021-06-18 Listed $225,000 realMLS
- 2015-09-23 Sold (Public Records) $33,000 Public Records
- 2015-09-23 Sold (MLS) $30,000 realMLS
- 2015-07-21 Pending — realMLS
- 2015-06-10 Relisted — realMLS
- 2015-06-01 Pending — realMLS
- 2015-05-05 Listed $50,000 realMLS
- 2011-04-21 Sold (Public Records) $23,500 Public Records
- 2011-04-21 Listing Removed — realMLS
- 2011-04-20 Sold (MLS) $23,500 realMLS
- 2010-09-04 Listed $40,000 realMLS
- 2010-09-03 Listing Removed — realMLS
- 2010-09-02 Listed $50,000 realMLS
- 2005-04-11 Sold (Public Records) $50,000 Public Records
- 1998-02-25 Sold (Public Records) $31,000 Public Records
Property tax history
+28.6%/yrLatest (2025): $2,883 · +9.2% YoY. Source: county tax records.
Cash-flow waterfall
monthlySold comps — $/sqft
last 12 mo · ≤1 miLoading sold comps…