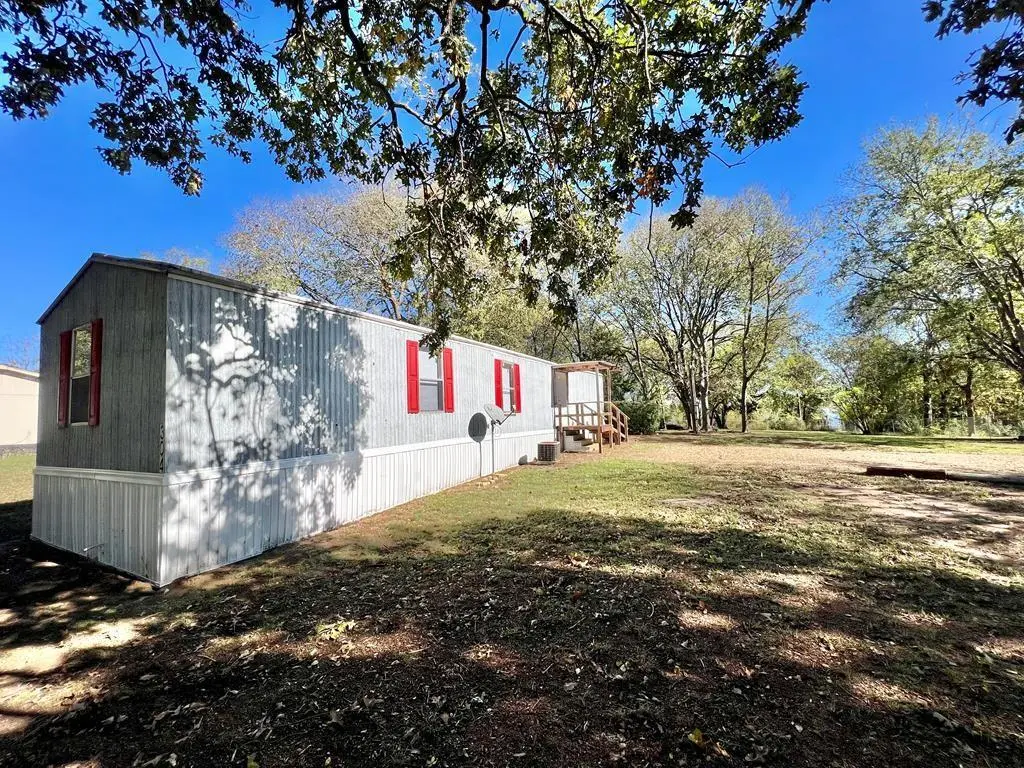
304 Wildwind St · Gun Barrel City, TX
Flood risk No data
- FEMA flood zone
- —
- Chance of flooding over 30 yrs
- —
- Est. flood insurance / yr
- —
Fire risk No data
- Est. fire insurance / yr
- —
Heat risk No data
- Hot days now (above threshold)
- —
- Hot days in 30 yrs
- —
Wind risk No data
- Chance of severe wind over 30 yrs
- —
Air-quality risk No data
- Unhealthy air days now
- —
- Unhealthy air days in 30 yrs
- —
Risk factors via First Street. Map © Google.
Why this score? — see what drove the C+ grade
The composite is a weighted blend of 9 inputs, each scored 0–100. Each bar is that input's sub-score; the figure is the points it added to the 100-point composite (weight × sub-score).
- Cash flow +27.8/30.0
- DSCR +9.8/10.0
- ARV discount +8.1/15.0
- 1% rule +6.9/10.0
- Schools +3.8/10.0
- Livability +3.4/5.0
- Condition / age +2.5/5.0
- Rent growth +1.1/5.0
- Appreciation +0.0/10.0
$119,900
🖨 Deal sheet 📄 Offer letter ✓ Due diligence
Listing remarks
Charming and affordable home located in the heart of Gun Barrel City! Situated on nearly half an acre, this 3 bedroom, 1 bathroom property offers over 700 square feet of comfortable living space with a spacious yard perfect for outdoor enjoyment, entertaining, or relaxing evenings at home. The neighborhood features a variety of amenities including a community pool, park, basketball court, dog park, picnic area, fishing dock, and boat ramp, providing endless opportunities for recreation and leisure. Conveniently located near Cedar Creek Lake, shopping, dining, and local attractions, this property is ideal for first-time homebuyers, weekend getaways, or investment opportunities. Don’t m
Key facts
- Spacious yard
- Dog park
- Fishing dock
Tags
Property features AI
Finance
- Financial info: Treat as clear loan type; No second mortgage; Financing options include Cash, Conventional, FHA, VA, Special Funding, and other
- HOA & community: Mandatory association; Annual association fee of $200; Managed by Tamarack Property Owners Association
Exterior
- Parking: Additional parking available; Other parking features
- Utilities: City water; City sewer; Located in a municipal utility district
- Home design: Residential mobile home; Attached property; One level; Accessible entrance
- Construction: Built in 2005; Metal roof; Other foundation details
- Exterior features: Cleared lot; Landscaped; Other lot features; Waterfront on Cedar Creek
Interior
- Kitchen: Other appliances
- Bedrooms: Primary bedroom on level 1 (approx. 14 x 18)
- Flooring: Vinyl flooring
- Bathrooms: 1 full bathroom
- Interior features: Open floorplan; Other interior features; One living area; One dining area; 2 total rooms
- Laundry & utility: No specific laundry/utility details provided
Neighborhood map
What this means for you Summary
Snapshot
- This is a 3-bed/1.0-bath manufactured listed at $120k.
Deal economics
- At list price, monthly cash flow is $366 ($4k/yr) — positive.
- The deal already cash-flows at list — no discount required.
- Meets the 1% rule at list price ($1k rent vs $120k).
- Recommended offer: $116k (3.0% below list) — sets the bar for market timing.
- Cap rate 10.0% vs local median 3.3% in Gun Barrel City — top-decile yield for the area; either an underpriced asset or a hidden risk that comps aren't pricing in. Stress-test before assuming the spread holds.
Location & tenants
- Location reads 67/100 on livability (#519 in TX) — a middle-class / working-renter tenant base. Strengths: cost of living A+, housing A+, health & safety B+; Watch: employment D+, amenities F, commute F.
- Mabank ISD (town): math 47% / reading 44% proficiency, ranked #273 of 826 in TX (top 33%) — families likely to look elsewhere, expect single-tenant / working-renter base with shorter leases.
- Market conditions: Rents falling (-5.8%/yr); 694 active listings in the ZIP; 2 comparable units currently listed for rent nearby; 263 units permitted in Henderson County in 2024 (0 in 5+ unit buildings).
Forward outlook
- Local home prices are declining (-3.0%/yr); year-one equity from $829 of loan paydown is wiped out by about $4k of value loss. Plan a longer hold.
Negotiation context
- It's been on market 35 days — a 3% lower offer ($116k) is reasonable based on typical stale-listing flexibility.
- 9 sale attempts since 2y ago with the ask held roughly flat each time — persistent listings suggest the price (not the market) is what's stuck; bring a comps-based counter.
Questions for the listing agent
- It's been on market 35 days. Have you received any prior offers? Is the seller open to a 3% concession, seller financing, or rate buy-down credit?
- What does the HOA fee cover, when was the last increase, and are there any pending special assessments or reserve-fund shortfalls?
- Is there a deadline driving the sale (1031 exchange, divorce, estate, relocation)? That informs how much negotiation room exists.
- What's the average days-on-market for RENTAL listings here right now (not sales)? A rising rental-DOM trend means longer vacancies and softer asking-rent achievability than the comps imply.
- What's the recent tenant-quality profile in this submarket — average credit score on applications, eviction rate, late-payment / NSF rate, and stable-employment percentage? A property-management company in the area should have these aggregated.
- How much new for-sale + rental construction is in the pipeline within 1–3 miles? Heavy new supply typically softens prices + rents 12–24 months out; constrained supply supports both.
Investment metrics
- 1% rule
- 1.19% ✓
- Cap rate
- 9.96%
- Cash-on-cash
- 13.10%
- DSCR
- 1.58
- GRM
- 7.0
CMA / ARV
- ARV (median comp)
- $121,523
- List price
- $119,900
- Delta
- -1.34%
- Verdict
- FAIR
- Comps
- 3 within 1.0 mi
Show comp detail 1 sale within ~0.75 mi
| Address | Dist | Beds/Ba | Sqft | Sold | Price | $/sf | Match |
|---|---|---|---|---|---|---|---|
| 318 Spring Valley St | 0.27mi | 2/2.0 (-1) | 840 (+7%) | 23mo | $139,996 | $167 | 47 |
Match score weights: distance 35% · size 25% · config 20% · recency 20%. Top-matched comps best support the ARV.
Projected returns pro-forma
-3.0% appreciation · 0.0% rent growth · sell at horizon
- IRR
- -0.2%
- Equity multiple
- 0.99×
- Total profit
- $-296
- Equity at exit
- $17,877
- IRR
- 6.2%
- Equity multiple
- 1.40×
- Total profit
- $13,538
- Equity at exit
- $10,367
Cash invested: $33,572 (down + closing). Projections, not guarantees.
Landlord ↔ Tenant lean methodology
- Overall (STATE)
- 87 Strongly Landlord-Friendly
- State Texas
- 87 Strongly Landlord-Friendly · R+5
- County
- — inherits STATE
- City
- — inherits STATE
ZIP-level market 75156
- Rents YoY
- -5.8%
- Active inventory
- 694
- Price-to-rent
- 7.0×
Monthly cashflow live
- Estimated rent
- $1,428 medium interval (Pro) →
- Mortgage (P&I)
- −$629
- Tax from tax record
- −$66 /mo · $796/yr
- Insurance
- −$50
- HOA
- −$17
- Vacancy / Maint / Mgmt
- −$300
- Net cashflow
- $366
Break-even live
UW: 25.0% down · 7.5% · 30yr · 1.5% tax · 5.0% vac · 8.0% maint · 8.0% mgmt
Financing live
Cash to close
- Down payment
- $29,975
- Closing costs
- $3,597
- Reserves months
- —
- Total cash needed
- —
Loan-product check · same deal, 3 products live
Conventional
25% down · 7.5% · 30yr
- Down + closing
- —
- Monthly P&I
- —
- Monthly cashflow
- —
- DSCR
- —
- Eligible?
- —
Personal DTI + credit; lowest rate.
DSCR
20% down · 8.5% · 30yr
- Down + closing
- —
- Monthly P&I
- —
- Monthly cashflow
- —
- DSCR
- —
- Eligible?
- —
No personal income docs; deal must DSCR.
Hard money
10% down · 12.0% · 12mo
- Down + closing
- —
- Monthly P&I
- —
- Monthly cashflow
- —
- DSCR
- —
- Eligible?
- —
Short-term bridge; refi at stabilization.
Rent comps 2 comps
| Address | Beds | Baths | Sqft | Rent | $/sqft | DOM | Units | Dist |
|---|---|---|---|---|---|---|---|---|
| 204 Paschall Blvd Unit C4 Mabank, TX | 2.0 | 2.0 | 995 | $980 | $0.98 | 44d | 1 | 1.17mi |
| 204 Paschall Blvd Apt D2 Mabank, TX | 2.0 | 2.0 | 995 | $949 | $0.95 | 44d | 1 | 1.17mi |
HOA detail
- Monthly dues
- $17 · $204/yr
- Likely covers
- pool
Listing history 36 events
-
2026-06-19days on market $119,900 Active 35 DOM
-
2026-06-18days on market $119,900 Active 34 DOM
-
2026-06-17days on market $119,900 Active 33 DOM
-
2026-06-16days on market $119,900 Active 32 DOM
-
2026-06-15days on market $119,900 Active 31 DOM
-
2026-06-14days on market $119,900 Active 29 DOM
-
2026-06-12days on market $119,900 Active 28 DOM
-
2026-06-09days on market $119,900 Active 25 DOM
-
2026-06-08days on market $119,900 Active 24 DOM
-
2026-06-07days on market $119,900 Active 23 DOM
-
2026-06-05days on market $119,900 Active 20 DOM
-
2026-06-03days on market $119,900 Active 19 DOM
-
2026-06-02days on market $119,900 Active 18 DOM
-
2026-06-01days on market $119,900 Active 17 DOM
-
2026-05-31days on market $119,900 Active 16 DOM
-
2026-05-30days on market $119,900 Active 15 DOM
-
2026-05-15$119,900 Active 857-char remark
-
2026-05-01historical $1,200
-
2026-04-30historical
-
2026-02-03$1,200
-
2026-01-12$119,900 Active
-
2025-12-07status Active
-
2025-10-30historical
-
2025-08-20status Active
-
2025-07-22price $119,900
-
2025-07-22price $119,900
-
2025-05-30$129,999 Active
-
2025-05-27price $129,999
-
2025-05-20status Active
-
2025-03-06price $139,999
-
2025-02-25status Active
-
2024-11-22$149,999 Active
-
2012-12-03soldstatus
-
2012-11-05soldstatus
-
2012-07-23soldstatus
-
1992-02-11soldstatus
ⓘ Source: listings_history table (triggers on properties + properties_extension) + one-shot
backfill from property_details.listing_events for pre-trigger history.
Tax reassessment forecast TX · Resets to sale price
- Current annual tax
- $796 · $66/mo
- Projected year-2 tax
- $2,194 · $183/mo
- Expected delta
- +$1,399/yr (+$117/mo · 175.8%)
ⓘ Screening estimate from a state-policy table — verify with the county assessor before closing.
Nearby sold comps map
Loading sold comps map…
Walkable amenities ~0.75 mi
Loading nearby amenities…
Taxation est. · year 1
- Rental income
- $17,141
- − Mortgage interest
- −$6,716
- − Property taxes
- −$796
- − Insurance
- −$600
- − Repairs & maintenance
- −$1,371
- − Management
- −$1,371
- − HOA
- −$204
- − Depreciation
- −$3,488
- Taxable income
- $2,595
- Est. tax owed @ 24.0%
- −$623
- After-tax cash flow
- $3,774/yr
For passive investors: Depreciation is non-cash, so a rental often shows a tax loss while cash-flowing — sheltering income. Rental losses are passive: they offset passive income freely, and up to $25,000/yr can offset ordinary (W-2) income if you actively participate and your MAGI is under $100k (phasing out to $0 by $150k); unused losses carry forward. On sale, claimed depreciation is recaptured at up to 25%, and gains may owe capital-gains tax (a 1031 exchange can defer both). Figures are a year-1 estimate at your 24.0% rate — not tax advice; consult a CPA.
Schools (NCES district)
- District
- Mabank ISD
- NCES district ID
- 4828680
- Math proficiency
- 47% ▼ -19.00%
- Reading proficiency
- 44% ▼ -11.00%
- Median HH income
- $40,321
- Composite
- 38.15/100
- National rank
- #4267
- State rank
- #273 of 826 in TX
Livability — Gun Barrel City
- Score
- 67/100
- State rank
- #519
- US rank
- #10212
Category grades
Schools grade is shown separately in the Schools card above.
Census & demographics
- Census place
- Gun Barrel City, TX
- County
- Henderson County · 34,977 people
- Metro
- Athens, TX
- Population (ZIP)
- 16,333
- Household income
- $60,867
- Rent vs Own
- Severe rent burden
- 400.0
Population outlook (Henderson County) Hauer SSP2
- Today (2025)
- 80,471 people
- By 2030
- 80,608 · +0.2%
- By 2040
- 80,087 · -0.5%
- By 2050
- 78,208 · -2.8%
- By 2075
- 72,423 · -10.0%
- By 2100
- 61,012 · -24.2%
Race, ethnicity, and origin ACS 2023
- Neighborhood character
- Predominantly White (85%)
- Race & ethnicity
- White 85% Hispanic / Latino 7% Two or more races 7% Black 1%
- Hispanic origin (detail)
- Mexican 5%
- Common ancestry
- Slovak 3% Serbian 2% European 2%
- Foreign-born
- 4% · Canada, Jamaica
- Languages at home
- 94% English-only · Spanish 4% Other Indo-European 1%
Political lean MEDSL · Henderson
- 2024 margin
- Solid R (+63.5) · D 18.0% · R 81.4%
- 2008→2024 swing
- -18.8pp toward R · 2008: -44.6pp · 2024: -63.5pp
- All cycles
- 2024: R+63.5 2020: R+60.2 2016: R+60.0 2012: R+54.8 2008: R+44.6
Not yet ingested
- Civics
- —
Market trends
- HPI YoY
- ▼ -216.77%
- Current HPI
- 199.8108
- Rent YoY
- ▼ -5.76%
- Metro
- Athens, TX
- State GDP YoY
- ▲ 3.95%
- F500 in state
- 110
Industry mix (Fortune 500 HQ in TX)
| Industry | F500 HQs | Revenue |
|---|---|---|
| Energy | 16 | $1,198B |
|
||
| Technology | 5 | $198B |
|
||
| Engineering / Construction | 4 | $72B |
|
||
| Energy Services | 3 | $60B |
|
||
| Utilities | 3 | $41B |
|
||
| Healthcare | 2 | $330B |
|
||
Price history
-20.1% since first listed20 events — show timeline
- 2026-05-15 Listed $119,900 NTREIS
- 2026-05-01 Rental Removed $1,200 NTREIS
- 2026-04-30 Listing Removed — NTREIS
- 2026-02-03 Listed for Rent $1,200 NTREIS
- 2026-01-12 Listed $119,900 NTREIS
- 2025-12-07 Relisted — HCBOR
- 2025-10-30 Listing Removed — NTREIS
- 2025-08-20 Relisted — HCBOR
- 2025-07-22 Price Changed $119,900 NTREIS
- 2025-07-22 Price Changed $119,900 HCBOR
- 2025-05-30 Listed $129,999 NTREIS
- 2025-05-27 Price Changed $129,999 HCBOR
- 2025-05-20 Relisted — HCBOR
- 2025-03-06 Price Changed $139,999 HCBOR
- 2025-02-25 Relisted — HCBOR
- 2024-11-22 Listed $149,999 HCBOR
- 2012-12-03 Sold (Public Records) — Public Records
- 2012-11-05 Sold (Public Records) — Public Records
- 2012-07-23 Sold (Public Records) — Public Records
- 1992-02-11 Sold (Public Records) — Public Records
Property tax history
+11.1%/yrLatest (2025): $796 · -0.3% YoY. Source: county tax records.
Cash-flow waterfall
monthlySold comps — $/sqft
last 12 mo · ≤1 miLoading sold comps…