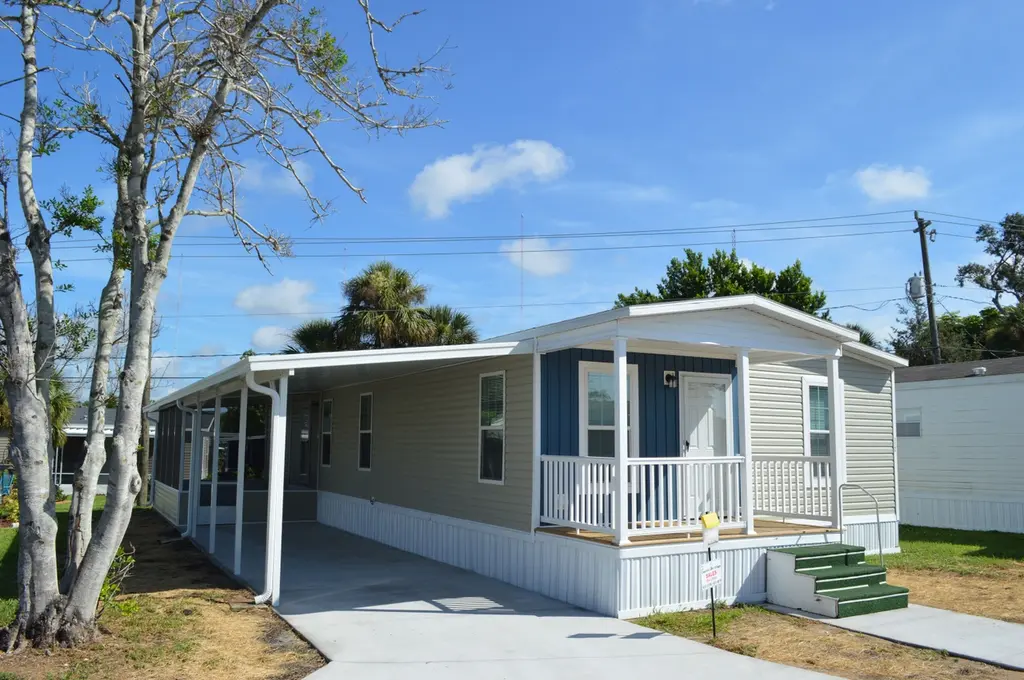
112 Sunnybrook Cir N · Ormond Beach, FL
Flood risk No data
- FEMA flood zone
- —
- Chance of flooding over 30 yrs
- —
- Est. flood insurance / yr
- —
Fire risk No data
- Est. fire insurance / yr
- —
Heat risk No data
- Hot days now (above threshold)
- —
- Hot days in 30 yrs
- —
Wind risk No data
- Chance of severe wind over 30 yrs
- —
Air-quality risk No data
- Unhealthy air days now
- —
- Unhealthy air days in 30 yrs
- —
Risk factors via First Street. Map © Google.
Why this score? — see what drove the C- grade
The composite is a weighted blend of 9 inputs, each scored 0–100. Each bar is that input's sub-score; the figure is the points it added to the 100-point composite (weight × sub-score).
- Cash flow +16.8/30.0
- 1% rule +10.0/10.0
- ARV discount +7.5/15.0
- DSCR +5.2/10.0
- Livability +4.2/5.0
- Condition / age +4.0/5.0
- Schools +3.9/10.0
- Rent growth +2.9/5.0
- Appreciation +0.0/10.0
$127,900
🖨 Deal sheet 📄 Offer letter ✓ Due diligence
Listing remarks MLS
New Arrival! Construction has just completed on this Cute 3 Bed 2 Bath Floor Plan with added-on front porch. This home has so many added features at a great price point. An absolute must-see!
Key facts
- 2 parking spots
- Built 2025
- Listed 402 days
Neighborhood map
What this means for you Summary
Snapshot
- This is a 3-bed/2.0-bath single-family listed at $128k. Condition is rated good.
Deal economics
- At list price, monthly cash flow is $81 ($971/yr) — positive.
- The deal already cash-flows at list — no discount required.
- Meets the 1% rule at list price ($2k rent vs $128k).
- Recommended offer: $113k (12.0% below list) — sets the bar for market timing.
- Cap rate 7.1% vs local median 3.9% in Ormond Beach — top-decile yield for the area; either an underpriced asset or a hidden risk that comps aren't pricing in. Stress-test before assuming the spread holds.
Location & tenants
- Location reads 83/100 on livability (#55 in FL, #965 nationally) — a professional / high-income tenant draw. Strengths: amenities A+, housing A+, health & safety A+; Watch: commute F.
- Volusia (suburban): math 44% / reading 49% proficiency, ranked #47 of 73 in FL (top 64%) — families likely to look elsewhere, expect single-tenant / working-renter base with shorter leases.
- Market conditions: Rents rising (+1.6%/yr); 985 active listings in the ZIP; 10 comparable units currently listed for rent nearby; rentals at typical pace (median 24d on market — plan ~3-4 weeks tenant-placement turnaround); 3,402 units permitted in Volusia County in 2024 (681 in 5+ unit buildings).
- This rent runs 33% of the median local income ($71k/yr) — at the standard rent-burdened threshold; future hikes will face affordability resistance.
Forward outlook
- Local home prices are declining (-3.0%/yr); year-one equity from $884 of loan paydown is wiped out by about $4k of value loss. Plan a longer hold.
- Volusia County population projected at +19% by 2050 — long-run rental-demand tailwind backs the buy-and-hold thesis.
Negotiation context
- It's been on market 402 days — a 12% lower offer ($113k) is reasonable based on typical stale-listing flexibility.
Risks & watch-outs
- Watch-outs: HOA is 29% of rent.
Questions for the listing agent
- It's been on market 402 days. Have you received any prior offers? Is the seller open to a 12% concession, seller financing, or rate buy-down credit?
- What does the HOA fee cover, when was the last increase, and are there any pending special assessments or reserve-fund shortfalls?
- Why hasn't it sold? Are there any deal-killer items the seller is aware of (foundation, flood, title, zoning, code violations)?
- Is there a deadline driving the sale (1031 exchange, divorce, estate, relocation)? That informs how much negotiation room exists.
- Schools are B-rated — typically a magnet for longer-tenancy family renters. What's the average tenant stay here, and is there a school-zone premium baked into asking?
- What's the average days-on-market for RENTAL listings here right now (not sales)? A rising rental-DOM trend means longer vacancies and softer asking-rent achievability than the comps imply.
- What's the recent tenant-quality profile in this submarket — average credit score on applications, eviction rate, late-payment / NSF rate, and stable-employment percentage? A property-management company in the area should have these aggregated.
- How much new for-sale + rental construction is in the pipeline within 1–3 miles? Heavy new supply typically softens prices + rents 12–24 months out; constrained supply supports both.
Investment metrics
- 1% rule
- 1.51% ✓
- Cap rate
- 7.05%
- Cash-on-cash
- 2.71%
- DSCR
- 1.12
- GRM
- 5.5
CMA / ARV
No comps found within radius.
Projected returns pro-forma
-3.0% appreciation · 1.64% rent growth · sell at horizon
- IRR
- -14.1%
- Equity multiple
- 0.50×
- Total profit
- $-17,807
- Equity at exit
- $19,070
- IRR
- -8.7%
- Equity multiple
- 0.50×
- Total profit
- $-17,761
- Equity at exit
- $11,058
Cash invested: $35,812 (down + closing). Projections, not guarantees.
Landlord ↔ Tenant lean methodology
- Overall (STATE)
- 87 Strongly Landlord-Friendly
- State Florida
- 87 Strongly Landlord-Friendly · R+3
- County
- — inherits STATE
- City
- — inherits STATE
ZIP-level market 32174
- Rents YoY
- 1.6%
- Active inventory
- 985
- Price-to-rent
- 5.5×
Monthly cashflow live
- Estimated rent
- $1,930 high interval (Pro) →
- Mortgage (P&I)
- −$671
- Tax est. 1.5%
- −$160 /mo · $1,918/yr
- Insurance
- −$53
- HOA
- −$560
- Vacancy / Maint / Mgmt
- −$405
- Net cashflow
- $81
Break-even live
UW: 25.0% down · 7.5% · 30yr · 1.5% tax · 5.0% vac · 8.0% maint · 8.0% mgmt
Financing live
Cash to close
- Down payment
- $31,975
- Closing costs
- $3,837
- Reserves months
- —
- Total cash needed
- —
Loan-product check · same deal, 3 products live
Conventional
25% down · 7.5% · 30yr
- Down + closing
- —
- Monthly P&I
- —
- Monthly cashflow
- —
- DSCR
- —
- Eligible?
- —
Personal DTI + credit; lowest rate.
DSCR
20% down · 8.5% · 30yr
- Down + closing
- —
- Monthly P&I
- —
- Monthly cashflow
- —
- DSCR
- —
- Eligible?
- —
No personal income docs; deal must DSCR.
Hard money
10% down · 12.0% · 12mo
- Down + closing
- —
- Monthly P&I
- —
- Monthly cashflow
- —
- DSCR
- —
- Eligible?
- —
Short-term bridge; refi at stabilization.
Rent comps 10 comps
| Address | Beds | Baths | Sqft | Rent | $/sqft | DOM | Units | Dist |
|---|---|---|---|---|---|---|---|---|
| 35 Magnolia Ave Unit 35 Ormond Beach, FL | 2.0 | 2.0 | 1300 | $1,800 | $1.38 | 23d | 1 | 0.73mi |
| 1088 W Granada Blvd Ormond Beach, FL | 1.0–2.0 | 1.0–2.0 | 950 | $1,570 | $1.65 | 11d | 8 | 0.85mi |
| 1767 Valencia Ave Ormond Beach, FL | 4.0 | 2.0 | 1216 | $2,100 | $1.73 | 23d | 1 | 1.14mi |
| 450 Tomoka Ave Unit 215 Ormond Beach, FL | 2.0 | 1.5 | 1150 | $1,750 | $1.52 | 14d | 1 | 1.17mi |
| 500 Shadow Lakes Blvd Ormond Beach, FL | 1.0–2.0 | 1.0–2.0 | 856 | $1,645 | $1.92 | 11d | 15 | 1.20mi |
| 410 Sauls St Ormond Beach, FL | 3.0 | 1.0 | 990 | $1,500 | $1.52 | 23d | 1 | 1.23mi |
| 1420 Alabama Ave Daytona Beach, FL | 4.0 | 2.0 | 1367 | $1,824 | $1.33 | 19d | 1 | 1.31mi |
| 402 Fleming Ave Ormond Beach, FL | 3.0 | 2.0 | 1495 | $2,560 | $1.71 | 21d | 1 | 1.35mi |
| 1707 Evergreen St Ormond Beach, FL | 2.0 | 1.0 | 868 | $1,750 | $2.02 | 23d | 1 | 1.36mi |
| 1435 Atlanta Dr Daytona Beach, FL | 3.0 | 1.0 | 1200 | $1,800 | $1.50 | 23d | 1 | 1.42mi |
HOA detail
- Monthly dues
- $560 · $6,720/yr
Listing history 16 events
-
2026-06-18days on market $127,900 Active 402 DOM
-
2026-06-17days on market $127,900 Active 401 DOM
-
2026-06-16days on market $127,900 Active 400 DOM
-
2026-06-15days on market $127,900 Active 399 DOM
-
2026-06-14days on market $127,900 Active 397 DOM
-
2026-06-10days on market $127,900 Active 394 DOM
-
2026-06-09days on market $127,900 Active 393 DOM
-
2026-06-08days on market $127,900 Active 392 DOM
-
2026-06-07days on market $127,900 Active 391 DOM
-
2026-06-05days on market $127,900 Active 388 DOM
-
2026-06-03days on market $127,900 Active 387 DOM
-
2026-06-03days on market $127,900 Active 386 DOM
-
2026-06-01days on market $127,900 Active 385 DOM
-
2026-05-31days on market $127,900 Active 384 DOM
-
2026-05-31days on market $127,900 Active 383 DOM
-
2025-05-12$127,900 Active 191-char remark
Show marketing remark (191 chars)
New Arrival! Construction has just completed on this Cute 3 Bed 2 Bath Floor Plan with added-on front porch. This home has so many added features at a great price point. An absolute must-see!
ⓘ Source: listings_history table (triggers on properties + properties_extension) + one-shot
backfill from property_details.listing_events for pre-trigger history.
Nearby sold comps map
Loading sold comps map…
Walkable amenities ~0.75 mi
Loading nearby amenities…
Taxation est. · year 1
- Rental income
- $23,161
- − Mortgage interest
- −$7,164
- − Property taxes
- −$1,918
- − Insurance
- −$640
- − Repairs & maintenance
- −$1,853
- − Management
- −$1,853
- − HOA
- −$6,720
- − Depreciation
- −$3,721
- Taxable loss
- −$708
- Est. tax savings @ 24.0%
- +$170
- After-tax cash flow
- $1,140/yr
For passive investors: Depreciation is non-cash, so a rental often shows a tax loss while cash-flowing — sheltering income. Rental losses are passive: they offset passive income freely, and up to $25,000/yr can offset ordinary (W-2) income if you actively participate and your MAGI is under $100k (phasing out to $0 by $150k); unused losses carry forward. On sale, claimed depreciation is recaptured at up to 25%, and gains may owe capital-gains tax (a 1031 exchange can defer both). Figures are a year-1 estimate at your 24.0% rate — not tax advice; consult a CPA.
Condition & rehab AI · 12 photos
This single-family home is in excellent condition with recent cosmetic updates, making it move-in ready and ideal for both resale and rental markets.
Value-add opportunities
- Both Painting exterior and interior — Enhances curb appeal and interior aesthetics
- Both Landscaping and curb appeal improvements — Enhances curb appeal and property value
- Both Add smart home features — Improves convenience and marketability
Renovation cost estimate screening
Value-add ROI direction
- Both Painting exterior and interior — Enhances curb appeal and interior aesthetics ↑
- Both Landscaping and curb appeal improvements — Enhances curb appeal and property value ↑
- Both Add smart home features — Improves convenience and marketability ↑
ⓘ Cost ranges are severity-bucket heuristics (US national rule-of-thumb). Get contractor quotes + a written scope before underwriting a rehab budget.
Schools (NCES district)
- District
- Volusia
- NCES district ID
- 1201920
- Math proficiency
- 44% ▼ -9.00%
- Reading proficiency
- 49% ▼ -3.00%
- Median HH income
- $42,946
- Composite
- 39.2/100
- National rank
- #4019
- State rank
- #47 of 73 in FL
Livability — Ormond Beach
- Score
- 83/100
- State rank
- #55
- US rank
- #965
Category grades
Schools grade is shown separately in the Schools card above.
Census & demographics
- Census place
- Ormond Beach, FL
- County
- Volusia County · 556,871 people
- City population
- 69,624
- Metro
- Deltona-Daytona Beach-Ormond Beach, FL
- Population (ZIP)
- 54,783
- Household income
- $71,011
- Rent vs Own
- Severe rent burden
- 1158.0
Population outlook (Volusia County) Hauer SSP2
- Today (2025)
- 572,749 people
- By 2030
- 598,695 · +4.5%
- By 2040
- 644,880 · +12.6%
- By 2050
- 681,451 · +19.0%
- By 2075
- 759,957 · +32.7%
- By 2100
- 778,902 · +36.0%
Race, ethnicity, and origin ACS 2023
- Neighborhood character
- Predominantly White (82%)
- Race & ethnicity
- White 82% Black 6% Hispanic / Latino 5% Two or more races 5% Asian 3%
- Hispanic origin (detail)
- Puerto Rican 2%
- Common ancestry
- Romanian 4% Lithuanian 3% Slovak 3%
- Foreign-born
- 7% · Canada, China
- Languages at home
- 91% English-only · Spanish 3% Other Indo-European 1% German/W. Germanic 1%
Political lean MEDSL · Volusia
- 2024 margin
- Strong R (+21.8) · D 38.7% · R 60.5%
- 2008→2024 swing
- -27.4pp toward R · 2008: 5.7pp · 2024: -21.8pp
- All cycles
- 2024: R+21.8 2020: R+14.1 2016: R+13.1 2012: R+1.2 2008: D+5.7
Not yet ingested
- Civics
- —
Market trends
- HPI YoY
- ▼ -327.97%
- Current HPI
- 271.92
- Rent YoY
- ▲ 1.64%
- Metro
- Deltona-Daytona Beach-Ormond Beach, FL
- State GDP YoY
- ▲ 3.28%
- F500 in state
- 36
Industry mix (Fortune 500 HQ in FL)
| Industry | F500 HQs | Revenue |
|---|---|---|
| Industrial Technology | 2 | $29B |
|
||
| Insurance | 2 | $17B |
|
||
| Retail | 1 | $60B |
|
||
| Technology Distribution | 1 | $58B |
|
||
| Homebuilding | 1 | $35B |
|
||
| Technology Manufacturing | 1 | $35B |
|
||
Price history
1 event — show timeline
- 2025-05-12 Listed $127,900 Zillow
Cash-flow waterfall
monthlySold comps — $/sqft
last 12 mo · ≤1 miLoading sold comps…