912 Lake Destiny Rd Unit F · Altamonte Springs, FL
Flood risk 1/10 · Minimal
- FEMA flood zone
- X (unshaded)
- Chance of flooding over 30 yrs
- 0.0%
- Est. flood insurance / yr
- $507 – $1,088
Fire risk 1/10 · Minimal
- Est. fire insurance / yr
- $947 – $1,759
Heat risk 8/10 · Major
- Hot days now (above 107°F)
- 7 days/yr
- Hot days in 30 yrs
- 21 days/yr
Wind risk 9/10 · Severe
- Chance of severe wind over 30 yrs
- 99.0%
Air-quality risk 2/10 · Minimal
- Unhealthy air days now
- 0 days/yr
- Unhealthy air days in 30 yrs
- 1 days/yr
Risk factors via First Street. Map © Google.
Why this score? — see what drove the C- grade
The composite is a weighted blend of 9 inputs, each scored 0–100. Each bar is that input's sub-score; the figure is the points it added to the 100-point composite (weight × sub-score).
- Cash flow +16.7/30.0
- ARV discount +7.5/15.0
- 1% rule +6.6/10.0
- DSCR +5.2/10.0
- Schools +5.1/10.0
- Livability +4.1/5.0
- Condition / age +2.5/5.0
- Rent growth +2.3/5.0
- Appreciation +0.0/10.0
$150,000
🖨 Deal sheet 📄 Offer letter ✓ Due diligence
Listing remarks
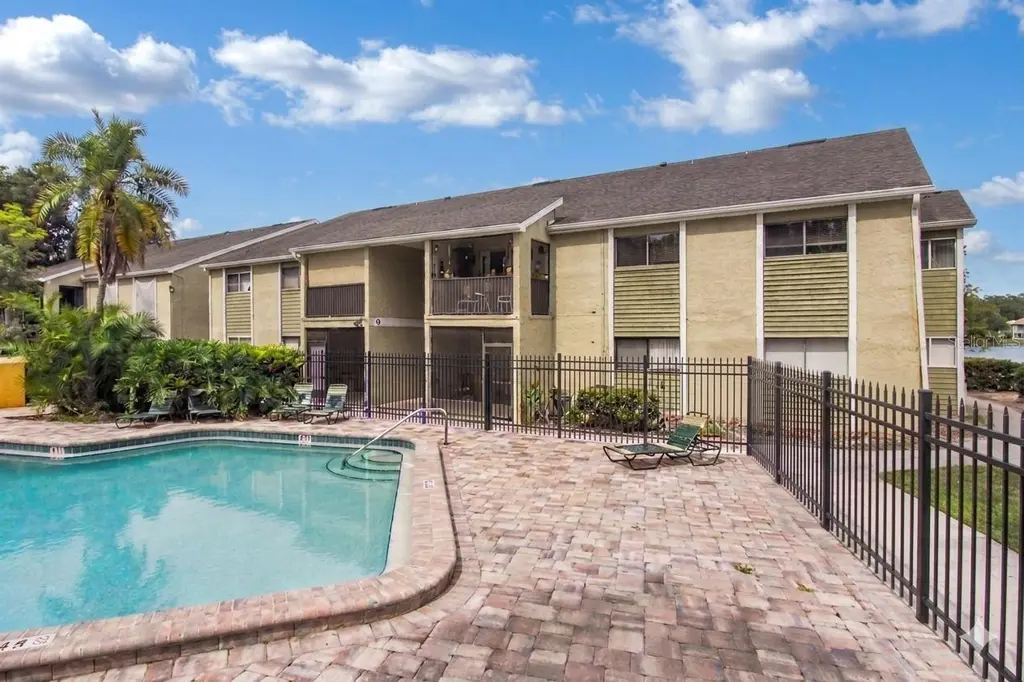
Under contract-accepting backup offers. SELLING FOR WAY UNDER APPRAISAL VALUE! Waterview living in a spacious 3-bedroom, 2-bath condo located in the prestigious Lake Destiny Condominiums full of nature. This spacious unit features serene lake views, a screened-in patio, private in-unit laundry, and an unbeatable location just minutes from I-4, Downtown Orlando, shopping, and dining. Major updates include a newer A/C (2024), newer roof, and newer gutters for added peace of mind. Residents enjoy access to incredible amenities including a beautiful clubhouse, lake access with boat ramp, picnic area, fitness center, multiple pools, and tennis courts. Rare opportunity to own a Waterview property
Key facts
- Waterview living
- Serene lake views
- Newer a/c
Tags
Property features AI
Finance
- Other: Homesteaded; Zoned MOR-1
- Financial info: Total monthly fees $392 (total annual $4,704); Lease restrictions apply
- HOA & community: HOA: Douglas E. Homes; Monthly HOA dues of $392; HOA includes pool, insurance, structure and grounds maintenance, and recreational facilities; Association approval required; Community amenities: fitness center, pool, tennis court(s); Pets allowed (max 40 lbs)
Exterior
- Parking: Assigned parking
- Utilities: Public water; Public sewer; Cable available
- Home design: Residential condominium; One story; Faces south; Second-floor unit
- Construction: Block and stucco construction; Shingle roof; Slab foundation; Built as part of building F
- Exterior features: Balcony; Sidewalk; Sliding doors; Tennis court(s); Lake view
Interior
- Kitchen: Other appliances
- Bedrooms: 3 bedrooms
- Flooring: Laminate; Tile
- Bathrooms: 2 full bathrooms
- Heating & cooling: Central heating; Central air
- Interior features: Ceiling fans
- Laundry & utility: Laundry inside
Neighborhood map
What this means for you Summary
Snapshot
- This is a 3-bed/2.0-bath condo listed at $150k.
Deal economics
- At list price, monthly cash flow is $95 ($1k/yr) — positive.
- The deal already cash-flows at list — no discount required.
- Meets the 1% rule at list price ($2k rent vs $150k).
- Recommended offer: $148k (1.5% below list) — sets the bar for market timing.
- Cap rate 7.0% vs local median 3.4% in Altamonte Springs — top-decile yield for the area; either an underpriced asset or a hidden risk that comps aren't pricing in. Stress-test before assuming the spread holds.
Location & tenants
- Location reads 82/100 on livability (#62 in FL, #1,095 nationally) — a professional / high-income tenant draw. Strengths: commute A+, cost of living A+, housing A+; Watch: employment C-, crime D+, amenities D-.
- Seminole (suburban): math 57% / reading 61% proficiency, ranked #13 of 73 in FL (top 18%) — acceptable for families but not a draw, mixed tenant base, ~2y average lease.
- Market conditions: Rents soft (-0.8%/yr); 257 active listings in the ZIP; 40 comparable units currently listed for rent nearby; rentals leasing fast (median 11d on market — plan ~1-2 weeks tenant-placement turnaround); 1,979 units permitted in Seminole County in 2024 (1,191 in 5+ unit buildings).
Forward outlook
- Local home prices are declining (-3.0%/yr); year-one equity from $1k of loan paydown is wiped out by about $4k of value loss. Plan a longer hold.
- Seminole County population projected at +24% by 2050 — long-run rental-demand tailwind backs the buy-and-hold thesis.
Negotiation context
- It's been on market 21 days — a 2% lower offer ($148k) is reasonable based on typical stale-listing flexibility.
- 8 sale attempts since 11y ago with the ask held roughly flat each time — persistent listings suggest the price (not the market) is what's stuck; bring a comps-based counter.
- Current owner paid $38k; list at $150k implies a 295% gain — meaningful room to come down on a strong offer.
Risks & watch-outs
- Watch-outs: HOA is 22% of rent.
- Climate carrying-cost: severe wind risk, 99% chance of damaging wind over 30y; extreme-heat days projected 7→21/yr by 2055 (HVAC capex compounding) — expect insurance premiums to compound above CPI over the hold.
Questions for the listing agent
- Built in 1973 — when were the roof, HVAC, electrical panel, plumbing, and water heater last replaced?
- What does the HOA fee cover, when was the last increase, and are there any pending special assessments or reserve-fund shortfalls?
- Any open or pending special assessments — roof, HVAC, plumbing, elevator, façade? What's the per-unit balance and payoff schedule, and is the seller paying it off at close or rolling it to the buyer?
- Is there a deadline driving the sale (1031 exchange, divorce, estate, relocation)? That informs how much negotiation room exists.
- Crime grade is D in this area — have there been break-ins, vandalism, or insurance claims at this property in the last 3 years? What carrier currently insures it and at what premium?
- What's the average days-on-market for RENTAL listings here right now (not sales)? A rising rental-DOM trend means longer vacancies and softer asking-rent achievability than the comps imply.
- What's the recent tenant-quality profile in this submarket — average credit score on applications, eviction rate, late-payment / NSF rate, and stable-employment percentage? A property-management company in the area should have these aggregated.
- How much new apartment / multifamily construction is in the pipeline within 1–3 miles? Heavy new supply (>2% of stock underway) typically softens rents 12–24 months out; light construction supports rent growth.
Investment metrics
- 1% rule
- 1.16% ✓
- Cap rate
- 7.05%
- Cash-on-cash
- 2.70%
- DSCR
- 1.12
- GRM
- 7.2
CMA / ARV
No comps found within radius.
Projected returns pro-forma
-3.0% appreciation · 0.0% rent growth · sell at horizon
- IRR
- -16.1%
- Equity multiple
- 0.45×
- Total profit
- $-23,215
- Equity at exit
- $22,365
- IRR
- -16.0%
- Equity multiple
- 0.25×
- Total profit
- $-31,483
- Equity at exit
- $12,969
Cash invested: $42,000 (down + closing). Projections, not guarantees.
Landlord ↔ Tenant lean methodology
- Overall (STATE)
- 87 Strongly Landlord-Friendly
- State Florida
- 87 Strongly Landlord-Friendly · R+3
- County
- — inherits STATE
- City
- — inherits STATE
ZIP-level market 32714
- Rents YoY
- -0.8%
- Active inventory
- 257
- Price-to-rent
- 7.2×
Monthly cashflow live
- Estimated rent
- $1,743 high interval (Pro) →
- Mortgage (P&I)
- −$787
- Tax from tax record
- −$42 /mo · $499/yr
- Insurance
- −$62
- HOA
- −$392
- Vacancy / Maint / Mgmt
- −$366
- Net cashflow
- $95
Break-even live
UW: 25.0% down · 7.5% · 30yr · 1.5% tax · 5.0% vac · 8.0% maint · 8.0% mgmt
Financing live
Cash to close
- Down payment
- $37,500
- Closing costs
- $4,500
- Reserves months
- —
- Total cash needed
- —
Loan-product check · same deal, 3 products live
Conventional
25% down · 7.5% · 30yr
- Down + closing
- —
- Monthly P&I
- —
- Monthly cashflow
- —
- DSCR
- —
- Eligible?
- —
Personal DTI + credit; lowest rate.
DSCR
20% down · 8.5% · 30yr
- Down + closing
- —
- Monthly P&I
- —
- Monthly cashflow
- —
- DSCR
- —
- Eligible?
- —
No personal income docs; deal must DSCR.
Hard money
10% down · 12.0% · 12mo
- Down + closing
- —
- Monthly P&I
- —
- Monthly cashflow
- —
- DSCR
- —
- Eligible?
- —
Short-term bridge; refi at stabilization.
Rent comps 40 comps
| Address | Beds | Baths | Sqft | Rent | $/sqft | DOM | Units | Dist |
|---|---|---|---|---|---|---|---|---|
| 914 Lake Destiny Rd Unit F Altamonte Springs, FL | 3.0 | 2.0 | 1112 | $1,650 | $1.48 | 23d | 1 | 0.02mi |
| 908 Lake Destiny Rd Unit Main Altamonte Springs, FL | 3.0 | 2.0 | 1112 | $1,950 | $1.75 | 23d | 1 | 0.04mi |
| 924 Lake Destiny Rd Unit A Altamonte Springs, FL | 2.0 | 1.0 | 826 | $1,300 | $1.57 | 23d | 1 | 0.07mi |
| 922 Lake Destiny Rd Unit C Altamonte Springs, FL | 2.0 | 2.0 | 897 | $1,325 | $1.48 | 12d | 1 | 0.07mi |
| 922 Lake Destiny Rd Altamonte Springs, FL | 2.0 | 2.0 | 897 | $1,350 | $1.51 | 23d | 1 | 0.07mi |
| 902 Lake Destiny Rd Unit C Altamonte Springs, FL | 2.0 | 2.0 | 897 | $1,550 | $1.73 | 10d | 1 | 0.08mi |
| 940 Lake Destiny Rd Unit H Altamonte Springs, FL | 2.0 | 1.0 | 826 | $1,400 | $1.69 | 23d | 1 | 0.12mi |
| 895 Wymore Rd Altamonte Springs, FL | 1.0–4.0 | 1.0–2.5 | 1304 | $1,518 | $1.16 | 1d | 21 | 0.13mi |
| 1000 Winderley Pl #128 Maitland, FL | 2.0 | 2.0 | 1275 | $2,400 | $1.88 | 4d | 1 | 0.34mi |
| 693 Wymore Rd Altamonte Springs, FL | 1.0–2.0 | 1.0–2.0 | 860 | $1,679 | $1.95 | 3d | 15 | 0.52mi |
| 219 Debora Ct Altamonte Springs, FL | 3.0 | 2.5 | 1407 | $1,800 | $1.28 | 10d | 1 | 0.56mi |
| 631 Northlake Blvd Unit 631 Altamonte Springs, FL | 2.0 | 2.0 | 1177 | $1,760 | $1.50 | 21d | 1 | 0.57mi |
| 725 Northlake Blvd #67 Altamonte Springs, FL | 3.0 | 2.0 | 1200 | $2,095 | $1.75 | 4d | 1 | 0.58mi |
| 725 Northlake Blvd Altamonte Springs, FL | 3.0 | 2.0 | 1200 | $2,048 | $1.71 | 23d | 2 | 0.61mi |
| 605 Northlake Blvd #31 Altamonte Springs, FL | 3.0 | 2.0 | 1200 | $1,500 | $1.25 | 23d | 1 | 0.65mi |
| 230 Country Walk Pl Altamonte Springs, FL | 1.0–3.0 | 1.0–2.5 | 1068 | $2,368 | $2.22 | 1d | 52 | 0.73mi |
| 555 Northlake Blvd Altamonte Springs, FL | 3.0 | 2.0 | 1230 | $1,930 | $1.57 | 21d | 1 | 0.76mi |
| 351 Northlake Blvd Altamonte Springs, FL | 1.0–2.0 | 1.0–2.0 | 837 | $1,933 | $2.31 | 1d | 26 | 0.87mi |
| 115 Orienta Dr Altamonte Springs, FL | 3.0 | 2.0 | 1080 | $1,900 | $1.76 | 23d | 1 | 0.89mi |
| 355 Wymore Rd #202 Altamonte Springs, FL | 2.0 | 1.0 | 828 | $1,380 | $1.67 | 16d | 1 | 0.89mi |
| 304 Wymore Rd Altamonte Springs, FL | 2.0 | 1.0 | 858 | $1,428 | $1.66 | 14d | 1 | 0.99mi |
| 360 Wymore Rd Altamonte Springs, FL | 1.0–3.0 | 1.0–2.0 | 1108 | $1,695 | $1.53 | 1d | 6 | 0.99mi |
| 302 Wymore Rd Altamonte Springs, FL | 3.0 | 2.0 | 1150 | $1,610 | $1.40 | 21d | 1 | 1.00mi |
| 285 Wymore Rd Unit 285-202 Altamonte Springs, FL | 2.0 | 1.0 | 828 | $1,375 | $1.66 | 23d | 1 | 1.01mi |
| 294 Wymore Rd Altamonte Springs, FL | 3.0 | 2.0 | 1150 | $1,595 | $1.39 | 21d | 1 | 1.03mi |
| 9000 Summit Centre Way Orlando, FL | 1.0–3.0 | 1.0–2.0 | 1116 | $2,375 | $2.13 | 2d | 15 | 1.04mi |
| 264 Springs Colony Cir Altamonte Springs, FL | 1.0–3.0 | 1.0–2.0 | 1000 | $1,994 | $1.99 | 2d | 9 | 1.06mi |
| 8636 Villa Pt Orlando, FL | 1.0–3.0 | 1.0–2.0 | 1156 | $2,225 | $1.92 | 1d | 38 | 1.08mi |
| 1939 Grand Isle Cir Orlando, FL | 1.0–4.0 | 1.0–2.0 | 1157 | $1,980 | $1.71 | 2d | 36 | 1.09mi |
| 912 Innovation Way Altamonte Springs, FL | 1.0–3.0 | 1.0–2.0 | 1055 | $2,654 | $2.52 | 2d | 28 | 1.13mi |
| 895 Broadstone Way Altamonte Springs, FL | 3.0 | 1.0–2.0 | 1025 | $2,771 | $2.70 | 1d | 33 | 1.15mi |
| 601 Trelago Way Maitland, FL | 3.0 | 1.0–2.0 | 1058 | $3,250 | $3.07 | 1d | 16 | 1.16mi |
| 9301 Summit Centre Way Orlando, FL | 3.0 | 1.0–2.0 | 1012 | $2,945 | $2.91 | 4d | 1 | 1.27mi |
| 305 Lakepointe Dr #104 Altamonte Springs, FL | 2.0 | 2.0 | 924 | $1,749 | $1.89 | 4d | 1 | 1.28mi |
| 542 Orange Dr #26 Altamonte Springs, FL | 3.0 | 2.0 | 1252 | $1,799 | $1.44 | 3d | 1 | 1.29mi |
| 1798 Shadow View Cir Maitland, FL | 2.0 | 2.0 | 1280 | $1,750 | $1.37 | 23d | 1 | 1.29mi |
| 2603 Maitland Crossing Way Orlando, FL | 2.0 | 2.0 | 1064 | $1,550 | $1.46 | 7d | 1 | 1.30mi |
| 1150 Lake Shadow Cir Maitland, FL | 2.0 | 2.0 | 1111 | $1,638 | $1.47 | 4d | 1 | 1.31mi |
| 1150 Lake Shadow Cir Maitland, FL | 2.0 | 2.0 | 1079 | $1,638 | $1.52 | 1d | 2 | 1.31mi |
| 2549 Maitland Crossing Way #11207 Orlando, FL | 4.0 | 2.0 | 1313 | $1,950 | $1.49 | 23d | 1 | 1.32mi |
HOA detail condo
- Monthly dues
- $392 · $4,704/yr
- Likely covers
- waterpoolgym
- Assessments
- None detected in remarks — confirm with the listing agent.
Listing history 37 events
-
2026-06-09status $150,000 Pending 21 DOM
-
2026-06-08days on market $150,000 Active 21 DOM
-
2026-06-07days on market $150,000 Active 20 DOM
-
2026-06-04days on market $150,000 Active 17 DOM
-
2026-06-03days on market $150,000 Active 16 DOM
-
2026-06-02days on market $150,000 Active 15 DOM
-
2026-06-01days on market $150,000 Active 14 DOM
-
2026-05-31days on market $150,000 Active 13 DOM
-
2026-05-18$150,000 Active
-
2026-01-07historical
-
2025-11-01price $172,000
-
2025-11-01price $173,000
-
2025-08-25status Active
-
2025-08-20historical
-
2025-07-28price $177,000
-
2025-06-26price $180,000
-
2025-05-20$185,000 Active
-
2024-11-13price $185,000
-
2024-10-19price $190,000
-
2024-10-09price $192,000
-
2024-09-13$195,000 Active
-
2024-06-05status Pending
-
2024-06-03historical
-
2024-04-18status Active
-
2024-04-17status Pending
-
2024-04-14price $182,000
-
2024-04-03price $185,000
-
2024-03-26status Active
-
2024-03-23status Pending
-
2024-03-13price $187,000
-
2024-03-06$195,000 Active
-
2015-06-02historical
-
2015-06-01soldstatus $38,000 Sold
-
2015-04-23status Pending
-
2015-04-12$39,900 Active
-
2005-01-03soldstatus $90,000
-
1987-07-01soldstatus $45,000
ⓘ Source: listings_history table (triggers on properties + properties_extension) + one-shot
backfill from property_details.listing_events for pre-trigger history.
Tax reassessment forecast FL · Resets to sale price
- Current annual tax
- $499 · $42/mo
- Projected year-2 tax
- $1,245 · $104/mo
- Expected delta
- +$746/yr (+$62/mo · 149.5%)
ⓘ Screening estimate from a state-policy table — verify with the county assessor before closing.
Climate risk First Street
- Flood 1/10 Low FEMA zone X (unshaded) · 0% chance over 30 yrs
- Wildfire 1/10 Low
- Heat 8/10 Severe 7 d/yr ≥107°F today · 21 d/yr by 30 yrs out
- Wind 9/10 Extreme 99% chance of damaging wind over 30 yrs
- Air quality 2/10 Low 0 unhealthy d/yr today · 1 by 30 yrs out
Nearby sold comps map
Loading sold comps map…
Walkable amenities ~0.75 mi
Loading nearby amenities…
Taxation est. · year 1
- Rental income
- $20,920
- − Mortgage interest
- −$8,402
- − Property taxes
- −$499
- − Insurance
- −$750
- − Repairs & maintenance
- −$1,674
- − Management
- −$1,674
- − HOA
- −$4,704
- − Depreciation
- −$4,364
- Taxable loss
- −$1,146
- Est. tax savings @ 24.0%
- +$275
- After-tax cash flow
- $1,410/yr
For passive investors: Depreciation is non-cash, so a rental often shows a tax loss while cash-flowing — sheltering income. Rental losses are passive: they offset passive income freely, and up to $25,000/yr can offset ordinary (W-2) income if you actively participate and your MAGI is under $100k (phasing out to $0 by $150k); unused losses carry forward. On sale, claimed depreciation is recaptured at up to 25%, and gains may owe capital-gains tax (a 1031 exchange can defer both). Figures are a year-1 estimate at your 24.0% rate — not tax advice; consult a CPA.
Schools (NCES district)
- District
- Seminole
- NCES district ID
- 1201710
- Math proficiency
- 57% ▼ -7.00%
- Reading proficiency
- 61% ▼ -1.00%
- Median HH income
- $58,478
- Composite
- 51.05/100
- National rank
- #1769
- State rank
- #13 of 73 in FL
Livability — Altamonte Springs
- Score
- 82/100
- State rank
- #62
- US rank
- #1095
Category grades
Schools grade is shown separately in the Schools card above.
Census & demographics
- Census place
- Altamonte Springs, FL
- County
- Seminole County · 436,154 people
- City population
- 62,497
- Metro
- Orlando-Kissimmee-Sanford, FL
- Population (ZIP)
- 37,905
- Household income
- $70,955
- Rent vs Own
- Severe rent burden
- 1961.0
Population outlook (Seminole County) Hauer SSP2
- Today (2025)
- 515,494 people
- By 2030
- 545,713 · +5.9%
- By 2040
- 598,068 · +16.0%
- By 2050
- 640,663 · +24.3%
- By 2075
- 724,461 · +40.5%
- By 2100
- 755,530 · +46.6%
Race, ethnicity, and origin ACS 2023
- Neighborhood character
- Diverse neighborhood (Simpson 0.69)
- Race & ethnicity
- White 43% Hispanic / Latino 31% Two or more races 17% Black 17% Asian 2%
- Hispanic origin (detail)
- Mexican 3% Puerto Rican 10% Cuban 3% Dominican 2%
- Common ancestry
- Lithuanian 4% Hispanic 3% Scotch-Irish 2%
- Foreign-born
- 18% · Canada, Jamaica, South Korea
- Languages at home
- 71% English-only · Spanish 22% French/Haitian/Cajun 3% Other Indo-European 1%
Political lean MEDSL · Seminole
- 2024 margin
- Toss-up / Even · D 47.6% · R 51.1% · Other 1.3%
- 2008→2024 swing
- -0.8pp no change · 2008: -2.8pp · 2024: -3.5pp
- All cycles
- 2024: R+3.5 2020: D+2.8 2016: R+1.6 2012: R+6.5 2008: R+2.8
Not yet ingested
- Civics
- —
Market trends
- HPI YoY
- ▼ -200.78%
- Current HPI
- 338.6894
- Rent YoY
- ▼ -0.79%
- Metro
- Orlando-Kissimmee-Sanford, FL
- State GDP YoY
- ▲ 3.28%
- F500 in state
- 36
Industry mix (Fortune 500 HQ in FL)
| Industry | F500 HQs | Revenue |
|---|---|---|
| Industrial Technology | 2 | $29B |
|
||
| Insurance | 2 | $17B |
|
||
| Retail | 1 | $60B |
|
||
| Technology Distribution | 1 | $58B |
|
||
| Homebuilding | 1 | $35B |
|
||
| Technology Manufacturing | 1 | $35B |
|
||
Price history
+233.3% since first listed29 events — show timeline
- 2026-05-18 Listed $150,000 Stellar MLS as Distributed by MLS Grid
- 2026-01-07 Listing Removed — Stellar MLS as Distributed by MLS Grid
- 2025-11-01 Price Changed $172,000 Stellar MLS as Distributed by MLS Grid
- 2025-11-01 Price Changed $173,000 Stellar MLS as Distributed by MLS Grid
- 2025-08-25 Relisted — Stellar MLS as Distributed by MLS Grid
- 2025-08-20 Listing Removed — Stellar MLS as Distributed by MLS Grid
- 2025-07-28 Price Changed $177,000 Stellar MLS as Distributed by MLS Grid
- 2025-06-26 Price Changed $180,000 Stellar MLS as Distributed by MLS Grid
- 2025-05-20 Listed $185,000 Stellar MLS as Distributed by MLS Grid
- 2024-11-13 Price Changed $185,000 Stellar MLS as Distributed by MLS Grid
- 2024-10-19 Price Changed $190,000 Stellar MLS as Distributed by MLS Grid
- 2024-10-09 Price Changed $192,000 Stellar MLS as Distributed by MLS Grid
- 2024-09-13 Listed $195,000 Stellar MLS as Distributed by MLS Grid
- 2024-06-05 Pending — Stellar MLS as Distributed by MLS Grid
- 2024-06-03 Listing Removed — Stellar MLS as Distributed by MLS Grid
- 2024-04-18 Relisted — Stellar MLS as Distributed by MLS Grid
- 2024-04-17 Pending — Stellar MLS as Distributed by MLS Grid
- 2024-04-14 Price Changed $182,000 Stellar MLS as Distributed by MLS Grid
- 2024-04-03 Price Changed $185,000 Stellar MLS as Distributed by MLS Grid
- 2024-03-26 Relisted — Stellar MLS as Distributed by MLS Grid
- 2024-03-23 Pending — Stellar MLS as Distributed by MLS Grid
- 2024-03-13 Price Changed $187,000 Stellar MLS as Distributed by MLS Grid
- 2024-03-06 Listed $195,000 Stellar MLS as Distributed by MLS Grid
- 2015-06-02 Listing Removed — Stellar MLS as Distributed by MLS Grid
- 2015-06-01 Sold (MLS) $38,000 Stellar MLS as Distributed by MLS Grid
- 2015-04-23 Pending — Stellar MLS as Distributed by MLS Grid
- 2015-04-12 Listed $39,900 Stellar MLS as Distributed by MLS Grid
- 2005-01-03 Sold (Public Records) $90,000 Public Records
- 1987-07-01 Sold (Public Records) $45,000 Public Records
Property tax history
+18.1%/yrLatest (2025): $499 · +4.3% YoY. Source: county tax records.
Cash-flow waterfall
monthlySold comps — $/sqft
last 12 mo · ≤1 miLoading sold comps…