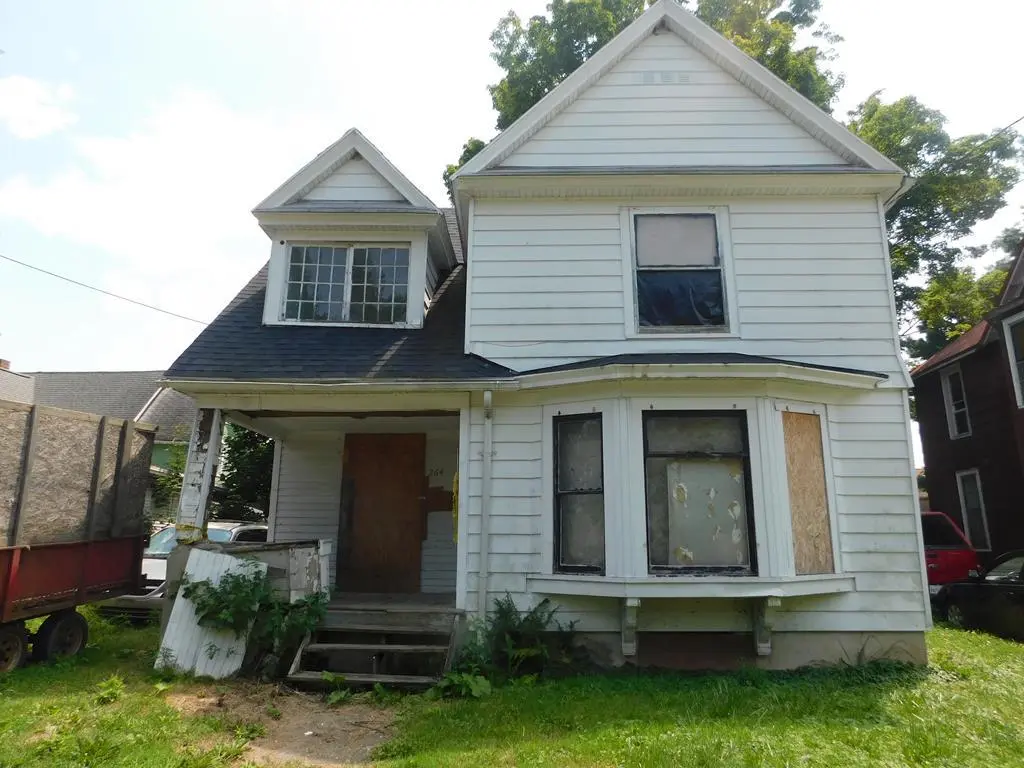
264 Brand St · Elmira, NY
Flood risk 5/10 · Moderate
- FEMA flood zone
- X (shaded)
- Chance of flooding over 30 yrs
- 0.24%
- Est. flood insurance / yr
- $473 – $860
Fire risk 3/10 · Minor
- Est. fire insurance / yr
- $691 – $1,283
Heat risk 3/10 · Minor
- Hot days now (above 96°F)
- 7 days/yr
- Hot days in 30 yrs
- 15 days/yr
Wind risk 2/10 · Minimal
- Chance of severe wind over 30 yrs
- 1.0%
Air-quality risk 1/10 · Minimal
- Unhealthy air days now
- 0 days/yr
- Unhealthy air days in 30 yrs
- 0 days/yr
Risk factors via First Street. Map © Google.
Why this score? — see what drove the B+ grade
The composite is a weighted blend of 9 inputs, each scored 0–100. Each bar is that input's sub-score; the figure is the points it added to the 100-point composite (weight × sub-score).
- Cash flow +30.0/30.0
- ARV discount +15.0/15.0
- 1% rule +10.0/10.0
- DSCR +10.0/10.0
- Livability +3.1/5.0
- Rent growth +2.5/5.0
- Condition / age +2.5/5.0
- Schools +2.4/10.0
- Appreciation +0.0/10.0
$40,000
🖨 Deal sheet 📄 Offer letter ✓ Due diligence
Listing remarks MLS
Attention Investors!! Prime opportunity to restore and revitalize a property on Elmira's south side. With the interior completely gutted, this home is a blank slate ready for your vision. Located close to all amenities, it's perfect for a rental property or a first-time home. Don't miss out on transforming this shell into a shining asset!
Key facts
- Blank slate ready
- 2,347 sq ft lot
- Built 1900
Tags
Neighborhood map
What this means for you Summary
Snapshot
- This is a 3-bed/1.5-bath single-family listed at $40k.
Deal economics
- At list price, monthly cash flow is $707 ($8k/yr) — positive.
- The deal already cash-flows at list — no discount required.
- Meets the 1% rule at list price ($1k rent vs $40k).
- Recommended offer: $35k (12.0% below list) — sets the bar for market timing.
- Cap rate 27.5% vs local median 10.1% in Elmira — top-decile yield for the area; either an underpriced asset or a hidden risk that comps aren't pricing in. Stress-test before assuming the spread holds.
Location & tenants
- Location reads 62/100 on livability (#832 in NY) — a middle-class / working-renter tenant base. Strengths: cost of living A+, housing A+, health & safety A+; Watch: schools F, crime F, amenities F.
- Elmira City School District (urban): math 23% / reading 35% proficiency, ranked #580 of 590 in NY (top 98%) — low school quality limits family demand, transient renter base, plan for 1-2y turnover.
- Market conditions: 101 active listings in the ZIP; 9 comparable units currently listed for rent nearby; rentals lingering (median 44d on market — plan ~5-8 weeks vacancy on turnover, expect pricing pressure); 100% of comp listings sitting > 30 days — soft ceiling on asking rent; 91 units permitted in Chemung County in 2024 (63 in 5+ unit buildings).
Forward outlook
- Local home prices are declining (-3.0%/yr); year-one equity from $277 of loan paydown is wiped out by about $1k of value loss. Plan a longer hold.
- Chemung County population projected at -17% by 2050 — secular population decline; favor cash flow + early exit over multi-decade hold.
- At projected returns (-3.0% appreciation + 3.0% rent growth), your $11k cash investment doubles in ~2 years — after that, you're playing with house money.
Negotiation context
- It's been on market 619 days — a 12% lower offer ($35k) is reasonable based on typical stale-listing flexibility.
- 8 sale attempts since 23y ago; this cycle's ask has dropped $20k (33%) from the opening price — seller is motivated, your offer sets the floor, not the list.
- Current owner paid $4k; list at $40k implies a 830% gain — meaningful room to come down on a strong offer.
Risks & watch-outs
- Watch-outs: built in 1900 — expect roof / HVAC / electrical / plumbing capex.
- Climate carrying-cost: moderate flood risk — expect insurance premiums to compound above CPI over the hold.
Questions for the listing agent
- It's been on market 619 days. Have you received any prior offers? Is the seller open to a 12% concession, seller financing, or rate buy-down credit?
- Built in 1900 — when were the roof, HVAC, electrical panel, plumbing, and water heater last replaced?
- Why hasn't it sold? Are there any deal-killer items the seller is aware of (foundation, flood, title, zoning, code violations)?
- Is there a deadline driving the sale (1031 exchange, divorce, estate, relocation)? That informs how much negotiation room exists.
- Schools are F-rated, which usually means shorter tenancies and higher turnover. Who's the typical renter profile here, and what's been the actual vacancy rate?
- Crime grade is F in this area — have there been break-ins, vandalism, or insurance claims at this property in the last 3 years? What carrier currently insures it and at what premium?
- What's the average days-on-market for RENTAL listings here right now (not sales)? A rising rental-DOM trend means longer vacancies and softer asking-rent achievability than the comps imply.
- What's the recent tenant-quality profile in this submarket — average credit score on applications, eviction rate, late-payment / NSF rate, and stable-employment percentage? A property-management company in the area should have these aggregated.
- How much new for-sale + rental construction is in the pipeline within 1–3 miles? Heavy new supply typically softens prices + rents 12–24 months out; constrained supply supports both.
Investment metrics
- 1% rule
- 3.11% ✓
- Cap rate
- 27.51%
- Cash-on-cash
- 75.78%
- DSCR
- 4.37
- GRM
- 2.7
CMA / ARV
- ARV (median comp)
- $69,898
- List price
- $40,000
- Delta
- -42.77%
- Verdict
- UNDERPRICED
- Comps
- 20 within 1.0 mi
Show comp detail 12 sales within ~0.75 mi
| Address | Dist | Beds/Ba | Sqft | Sold | Price | $/sf | Match |
|---|---|---|---|---|---|---|---|
| 310 Sly St | 0.25mi | 3/1.5 | 1,359 (-5%) | 6mo | $75,000 | $55 | 75 |
| 717 Spaulding St | 0.26mi | 3/2.0 | 1,344 (-6%) | 8mo | $70,000 | $52 | 69 |
| 708 Riverside Ave | 0.34mi | 4/1.5 (+1) | 1,484 (+4%) | 6mo | $83,000 | $56 | 68 |
| 752 Robinson St | 0.46mi | 3/1.0 | 1,344 (-6%) | 8mo | $32,000 | $24 | 60 |
| 502 Luce St | 0.54mi | 3/1.5 | 1,344 (-6%) | 7mo | $115,000 | $86 | 59 |
| 309 Broadway St | 0.61mi | 4/1.0 (+1) | 1,468 (+3%) | 3mo | $78,000 | $53 | 58 |
| 213 Juanita St | 0.57mi | 3/1.0 | 1,320 (-8%) | 6mo | $21,000 | $16 | 53 |
| 236 E Miller St | 0.42mi | 3/1.0 | 1,248 (-13%) | 7mo | $120,840 | $97 | 52 |
| 834 Maple Ave | 0.58mi | 3/2.0 | 1,246 (-13%) | 0mo | $135,000 | $108 | 49 |
| 421 Partridge St | 0.74mi | 3/1.5 | 1,274 (-11%) | 1mo | $47,000 | $37 | 46 |
| 506 Luce St | 0.58mi | 4/1.0 (+1) | 1,220 (-15%) | 8mo | $126,000 | $103 | 35 |
| 750 S Main St | 0.68mi | 2/1.5 (-1) | 1,216 (-15%) | 6mo | $72,000 | $59 | 33 |
Match score weights: distance 35% · size 25% · config 20% · recency 20%. Top-matched comps best support the ARV.
Projected returns pro-forma
-3.0% appreciation · 3.0% rent growth · sell at horizon
- IRR
- 75.7%
- Equity multiple
- 4.45×
- Total profit
- $38,586
- Equity at exit
- $5,964
- IRR
- 79.4%
- Equity multiple
- 9.19×
- Total profit
- $91,685
- Equity at exit
- $3,458
Cash invested: $11,200 (down + closing). Projections, not guarantees.
Landlord ↔ Tenant lean methodology
- Overall (STATE)
- 15 Strongly Tenant-Friendly
- State New York
- 15 Strongly Tenant-Friendly · D+10
- County
- — inherits STATE
- City
- — inherits STATE
ZIP-level market 14904
- Home prices YoY
- -9.6%
- Active inventory
- 101
- Price-to-rent
- 2.7×
Monthly cashflow live
- Estimated rent
- $1,245 high interval (Pro) →
- Mortgage (P&I)
- −$210
- Tax est. 1.5%
- −$50 /mo · $600/yr
- Insurance
- −$17
- HOA
- −$0
- Vacancy / Maint / Mgmt
- −$262
- Net cashflow
- $707
Break-even live
UW: 25.0% down · 7.5% · 30yr · 1.5% tax · 5.0% vac · 8.0% maint · 8.0% mgmt
Financing live
Cash to close
- Down payment
- $10,000
- Closing costs
- $1,200
- Reserves months
- —
- Total cash needed
- —
Loan-product check · same deal, 3 products live
Conventional
25% down · 7.5% · 30yr
- Down + closing
- —
- Monthly P&I
- —
- Monthly cashflow
- —
- DSCR
- —
- Eligible?
- —
Personal DTI + credit; lowest rate.
DSCR
20% down · 8.5% · 30yr
- Down + closing
- —
- Monthly P&I
- —
- Monthly cashflow
- —
- DSCR
- —
- Eligible?
- —
No personal income docs; deal must DSCR.
Hard money
10% down · 12.0% · 12mo
- Down + closing
- —
- Monthly P&I
- —
- Monthly cashflow
- —
- DSCR
- —
- Eligible?
- —
Short-term bridge; refi at stabilization.
Rent comps 9 comps
| Address | Beds | Baths | Sqft | Rent | $/sqft | DOM | Units | Dist |
|---|---|---|---|---|---|---|---|---|
| 160 Boardman St Unit B Elmira, NY | 2.0 | 1.0 | 1727 | $800 | $0.46 | 43d | 1 | 0.33mi |
| 419 Jefferson St Unit A Elmira, NY | 2.0 | 2.0 | 1100 | $1,995 | $1.81 | 43d | 1 | 0.76mi |
| 363 W Water St #2 Elmira, NY | 3.0 | 1.0 | 1084 | $1,250 | $1.15 | 43d | 1 | 0.81mi |
| 106 W 2nd St Unit A Elmira, NY | 3.0 | 1.0 | 1395 | $1,400 | $1.00 | 43d | 1 | 0.89mi |
| 355 W Clinton St Unit 1 Elmira, NY | 3.0 | 1.5 | 1650 | $1,400 | $0.85 | 43d | 1 | 1.14mi |
| 357 W Clinton St Unit 1 Elmira, NY | 2.0 | 1.5 | 1650 | $1,500 | $0.91 | 43d | 1 | 1.15mi |
| 454 W 2nd St Unit 1 Elmira, NY | 2.0 | 1.0 | 1400 | $1,000 | $0.71 | 43d | 1 | 1.16mi |
| 514 W 1st St Unit A Elmira, NY | 4.0 | 1.0 | 1416 | $1,275 | $0.90 | 43d | 1 | 1.21mi |
| 550 Spruce St Unit 303 Elmira, NY | 2.0 | 2.0 | 1350 | $1,350 | $1.00 | 43d | 1 | 1.40mi |
Listing history 32 events
-
2026-06-19days on market $40,000 Active 619 DOM
-
2026-06-18days on market $40,000 Active 618 DOM
-
2026-06-17days on market $40,000 Active 617 DOM
-
2026-06-16days on market $40,000 Active 616 DOM
-
2026-06-15days on market $40,000 Active 615 DOM
-
2026-06-14days on market $40,000 Active 613 DOM
-
2026-06-12days on market $40,000 Active 612 DOM
-
2026-06-09days on market $40,000 Active 609 DOM
-
2026-06-08days on market $40,000 Active 608 DOM
-
2026-06-07days on market $40,000 Active 607 DOM
-
2026-06-05days on market $40,000 Active 604 DOM
-
2026-06-03days on market $40,000 Active 603 DOM
-
2026-06-02days on market $40,000 Active 602 DOM
-
2026-06-01days on market $40,000 Active 601 DOM
-
2026-05-31days on market $40,000 Active 600 DOM
-
2026-05-30days on market $40,000 Active 599 DOM
-
2026-03-28status Active 341-char remark
Show marketing remark (341 chars)
Attention Investors!! Prime opportunity to restore and revitalize a property on Elmira's south side. With the interior completely gutted, this home is a blank slate ready for your vision. Located close to all amenities, it's perfect for a rental property or a first-time home. Don't miss out on transforming this shell into a shining asset!
-
2025-08-29status Active 341-char remark
Show marketing remark (341 chars)
Attention Investors!! Prime opportunity to restore and revitalize a property on Elmira's south side. With the interior completely gutted, this home is a blank slate ready for your vision. Located close to all amenities, it's perfect for a rental property or a first-time home. Don't miss out on transforming this shell into a shining asset!
-
2025-02-12status Active 341-char remark
Show marketing remark (341 chars)
Attention Investors!! Prime opportunity to restore and revitalize a property on Elmira's south side. With the interior completely gutted, this home is a blank slate ready for your vision. Located close to all amenities, it's perfect for a rental property or a first-time home. Don't miss out on transforming this shell into a shining asset!
-
2024-11-29price $40,000 341-char remark
Show marketing remark (341 chars)
Attention Investors!! Prime opportunity to restore and revitalize a property on Elmira's south side. With the interior completely gutted, this home is a blank slate ready for your vision. Located close to all amenities, it's perfect for a rental property or a first-time home. Don't miss out on transforming this shell into a shining asset!
-
2024-08-09$59,900 Active 341-char remark
Show marketing remark (341 chars)
Attention Investors!! Prime opportunity to restore and revitalize a property on Elmira's south side. With the interior completely gutted, this home is a blank slate ready for your vision. Located close to all amenities, it's perfect for a rental property or a first-time home. Don't miss out on transforming this shell into a shining asset!
-
2022-06-01historical
-
2021-10-26$29,900
-
2019-04-01historical
-
2019-01-15$24,900
-
2018-08-03soldstatus $4,300
-
2018-01-13$12,100
-
2004-09-28soldstatus $25,000
-
2004-08-13soldstatus $25,000
-
2003-11-06$27,000
-
1999-12-07soldstatus $39,500
-
1992-08-05soldstatus $15,000
ⓘ Source: listings_history table (triggers on properties + properties_extension) + one-shot
backfill from property_details.listing_events for pre-trigger history.
Climate risk First Street
- Flood 5/10 Major FEMA zone X (shaded) · 24% chance over 30 yrs
- Wildfire 3/10 Moderate
- Heat 3/10 Moderate 7 d/yr ≥96°F today · 15 d/yr by 30 yrs out
- Wind 2/10 Low 100% chance of damaging wind over 30 yrs
- Air quality 1/10 Low 0 unhealthy d/yr today · 0 by 30 yrs out
Nearby sold comps map
Loading sold comps map…
Walkable amenities ~0.75 mi
Loading nearby amenities…
Taxation est. · year 1
- Rental income
- $14,943
- − Mortgage interest
- −$2,241
- − Property taxes
- −$600
- − Insurance
- −$200
- − Repairs & maintenance
- −$1,195
- − Management
- −$1,195
- − Depreciation
- −$1,164
- Taxable income
- $8,348
- Est. tax owed @ 24.0%
- −$2,003
- After-tax cash flow
- $6,484/yr
For passive investors: Depreciation is non-cash, so a rental often shows a tax loss while cash-flowing — sheltering income. Rental losses are passive: they offset passive income freely, and up to $25,000/yr can offset ordinary (W-2) income if you actively participate and your MAGI is under $100k (phasing out to $0 by $150k); unused losses carry forward. On sale, claimed depreciation is recaptured at up to 25%, and gains may owe capital-gains tax (a 1031 exchange can defer both). Figures are a year-1 estimate at your 24.0% rate — not tax advice; consult a CPA.
Schools (NCES district)
- District
- Elmira City School District
- NCES district ID
- 3610560
- Math proficiency
- 23% ▼ -7.00%
- Reading proficiency
- 35% ▲ 7.00%
- Median HH income
- $40,180
- Composite
- 24.39/100
- National rank
- #7688
- State rank
- #580 of 590 in NY
Livability — Elmira
- Score
- 62/100
- State rank
- #832
- US rank
- #16139
Category grades
Schools grade is shown separately in the Schools card above.
Census & demographics
- Census place
- Elmira, NY
- City population
- 14,276
- Population (ZIP)
- 14,276
Population outlook (Chemung County) Hauer SSP2
- Today (2025)
- 82,931 people
- By 2030
- 80,356 · -3.1%
- By 2040
- 74,745 · -9.9%
- By 2050
- 69,012 · -16.8%
- By 2075
- 55,689 · -32.8%
- By 2100
- 41,428 · -50.0%
Race, ethnicity, and origin ACS 2023
- Neighborhood character
- Predominantly White (83%)
- Race & ethnicity
- White 83% Two or more races 7% Black 7% Hispanic / Latino 5% Native American 1%
- Common ancestry
- Romanian 7% Lithuanian 3% Slovak 2%
- Foreign-born
- 2% · Canada, Jamaica, Dominican Republic
- Languages at home
- 97% English-only · Spanish 2%
Political lean MEDSL · Chemung
- 2024 margin
- R (+16.8) · D 41.6% · R 58.4%
- 2008→2024 swing
- -15.6pp toward R · 2008: -1.2pp · 2024: -16.8pp
- All cycles
- 2024: R+16.8 2020: R+13.4 2016: R+20.0 2012: R+2.9 2008: R+1.2
Not yet ingested
- Civics
- —
Market trends
- HPI YoY
- ▼ -23.33%
- Current HPI
- 220.688
- Rent YoY
- —
- Metro
- —
- State GDP YoY
- ▲ 2.60%
- F500 in state
- 92
Industry mix (Fortune 500 HQ in NY)
| Industry | F500 HQs | Revenue |
|---|---|---|
| Financial Services | 10 | $950B |
|
||
| Consumer Goods | 9 | $162B |
|
||
| Insurance | 4 | $225B |
|
||
| Telecommunications | 2 | $144B |
|
||
| Pharmaceuticals | 2 | $112B |
|
||
| Media / Entertainment | 2 | $69B |
|
||
Price history
+166.7% since first listed16 events — show timeline
- 2026-03-28 Relisted — NMPA
- 2025-08-29 Relisted — NMPA
- 2025-02-12 Relisted — NMPA
- 2024-11-29 Price Changed $40,000 NMPA
- 2024-08-09 Listed $59,900 NMPA
- 2022-06-01 Listing Removed — UNYREIS
- 2021-10-26 Listed $29,900 UNYREIS
- 2019-04-01 Listing Removed — UNYREIS
- 2019-01-15 Listed $24,900 UNYREIS
- 2018-08-03 Sold (MLS) $4,300 UNYREIS
- 2018-01-13 Listed $12,100 UNYREIS
- 2004-09-28 Sold (Public Records) $25,000 Public Records
- 2004-08-13 Sold (MLS) $25,000 UNYREIS
- 2003-11-06 Listed $27,000 UNYREIS
- 1999-12-07 Sold (Public Records) $39,500 Public Records
- 1992-08-05 Sold (Public Records) $15,000 Public Records
Property tax history
+6.5%/yrLatest (2025): $2,366 · -14.3% YoY. Source: county tax records.
Cash-flow waterfall
monthlySold comps — $/sqft
last 12 mo · ≤1 miLoading sold comps…