 🏷️ Likely Rental
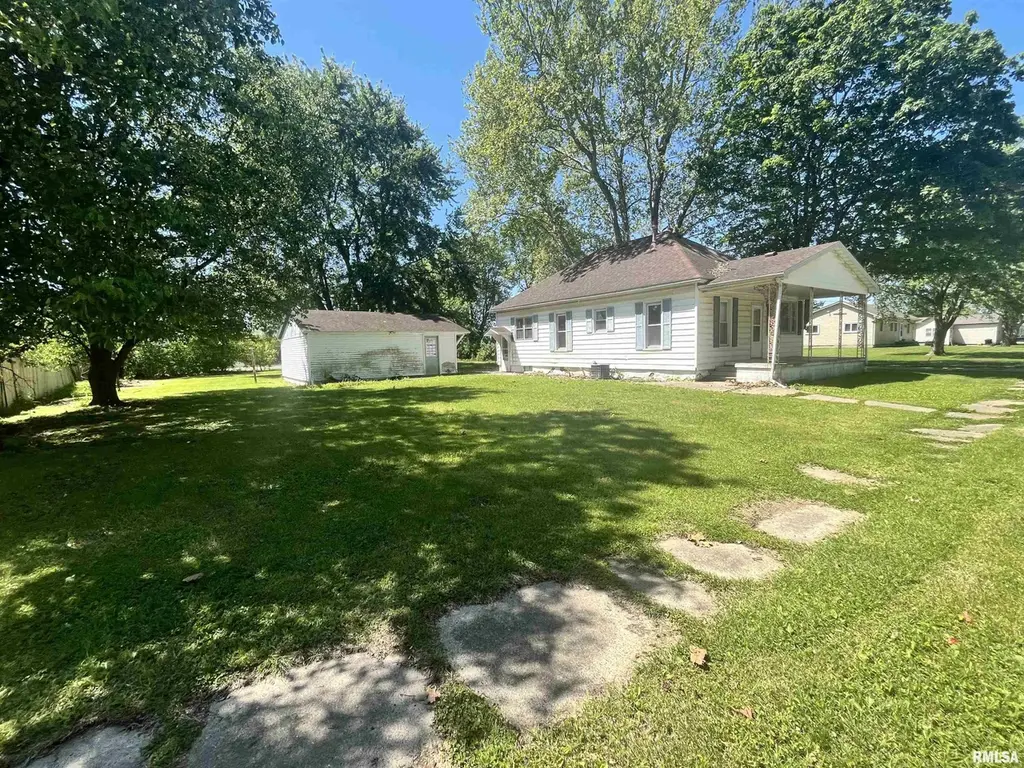
102 Sycamore St · Thayer, IL
Flood risk 1/10 · Minimal
- FEMA flood zone
- X (unshaded)
- Chance of flooding over 30 yrs
- 0.0%
- Est. flood insurance / yr
- $473 – $860
Fire risk 1/10 · Minimal
- Est. fire insurance / yr
- $804 – $1,492
Heat risk 4/10 · Minor
- Hot days now (above 105°F)
- 7 days/yr
- Hot days in 30 yrs
- 20 days/yr
Wind risk 2/10 · Minimal
- Chance of severe wind over 30 yrs
- 2.0%
Air-quality risk 2/10 · Minimal
- Unhealthy air days now
- 1 days/yr
- Unhealthy air days in 30 yrs
- 2 days/yr
Risk factors via First Street. Map © Google.
Why this score? — see what drove the A- grade
The composite is a weighted blend of 9 inputs, each scored 0–100. Each bar is that input's sub-score; the figure is the points it added to the 100-point composite (weight × sub-score).
- Cash flow +28.8/30.0
- ARV discount +15.0/15.0
- DSCR +10.0/10.0
- 1% rule +9.2/10.0
- Appreciation +5.0/10.0
- Schools +5.0/10.0
- Livability +3.2/5.0
- Rent growth +2.5/5.0
- Condition / age +2.5/5.0
$59,900
🖨 Deal sheet (PDF) 📄 Offer letter ✓ Due diligence
Listing remarks
Bring your vision and ideas to this solid 2-bedroom, 1-bath home featuring hardwood flooring throughout (under carpet and vinyl) and a spacious 2-car garage. Recent updates include a new water heater, replacement windows, and updated tub/shower. This property offers great potential for an investor or buyer looking to renovate and restore it to its former charm. Priced based on condition and being sold as-is. Cash or renovation loan only. Home is not available for rent or Contract for Deed (CFD).
Key facts
- Hardwood flooring
- Updated tub shower
- New water heater
Tags
Property features AI
Exterior
- Parking: Detached 2-car garage with alley access
- Utilities: Public water; Public sewer
- Home design: Single-family residence; Shingle roof
- Construction: Built year not specified
- Exterior features: Level lot; Lot dimensions approximately 100 x 165
Interior
- Kitchen: Kitchen on main level
- Bedrooms: 2 bedrooms (both on the main level)
- Flooring: Hardwood in bedrooms; Carpet in living room and office; Vinyl in kitchen and laundry
- Bathrooms: 1 full bathroom
- Heating & cooling: Forced air heating; Central air conditioning
- Interior features: Unfinished basement; No fireplaces
- Laundry & utility: Main level laundry room
Neighborhood map
What this means for you Summary
Snapshot
- This is a 2-bed/1.0-bath other listed at $60k.
Deal economics
- At list price, monthly cash flow is $202 ($2k/yr) — positive.
- The deal already cash-flows at list — no discount required.
- Meets the 1% rule at list price ($850 rent vs $60k).
- Recommended offer: $58k (3.0% below list) — sets the bar for market timing.
Location & tenants
- Location reads 65/100 on livability (#643 in IL) — a middle-class / working-renter tenant base. Strengths: cost of living A+, housing A+, health & safety A+; Watch: crime D+, schools D, amenities F.
- Market conditions: 4 active listings in the ZIP; 1 comparable units currently listed for rent nearby; 225 units permitted in Sangamon County in 2024 (48 in 5+ unit buildings).
Forward outlook
- In year one you build about $2k of equity ($414 loan paydown + $2k appreciation (3.0% local appreciation)).
- Sangamon County population projected to shrink 9% by 2050 — rents likely to lag national; underwrite the cash flow, not the appreciation.
- At projected returns (3.0% appreciation + 3.0% rent growth), your $17k cash investment doubles in ~4 years — after that, you're playing with house money.
Negotiation context
- It's been on market 41 days — a 3% lower offer ($58k) is reasonable based on typical stale-listing flexibility.
- Current owner paid $50k; 20% above their basis — modest negotiation headroom, anchor on the comps not their cost.
Risks & watch-outs
- Watch-outs: property tax is 2.6% of price.
Questions for the listing agent
- It's been on market 41 days. Have you received any prior offers? Is the seller open to a 3% concession, seller financing, or rate buy-down credit?
- Property tax is high relative to price — has the assessment been appealed recently, and will the sale trigger a re-assessment?
- Is there a deadline driving the sale (1031 exchange, divorce, estate, relocation)? That informs how much negotiation room exists.
- Schools are D-rated, which usually means shorter tenancies and higher turnover. Who's the typical renter profile here, and what's been the actual vacancy rate?
- Crime grade is D in this area — have there been break-ins, vandalism, or insurance claims at this property in the last 3 years? What carrier currently insures it and at what premium?
- What's the average days-on-market for RENTAL listings here right now (not sales)? A rising rental-DOM trend means longer vacancies and softer asking-rent achievability than the comps imply.
- What's the recent tenant-quality profile in this submarket — average credit score on applications, eviction rate, late-payment / NSF rate, and stable-employment percentage? A property-management company in the area should have these aggregated.
- How much new for-sale + rental construction is in the pipeline within 1–3 miles? Heavy new supply typically softens prices + rents 12–24 months out; constrained supply supports both.
Investment metrics
- 1% rule
- 1.42% ✓
- Cap rate
- 10.34%
- Cash-on-cash
- 14.45%
- DSCR
- 1.64
- GRM
- 5.9
CMA / ARV
- ARV (median comp)
- $87,412
- List price
- $59,900
- Delta
- -31.47%
- Verdict
- UNDERPRICED
- Comps
- 19 within 1.0 mi
Projected returns pro-forma
3.0% appreciation · 3.0% rent growth · sell at horizon
- IRR
- 21.1%
- Equity multiple
- 2.20×
- Total profit
- $20,128
- Equity at exit
- $26,934
- IRR
- 22.2%
- Equity multiple
- 4.20×
- Total profit
- $53,697
- Equity at exit
- $41,508
Cash invested: $16,772 (down + closing). Projections, not guarantees.
Landlord ↔ Tenant lean methodology
- Overall (STATE)
- 43 Moderately Tenant-Leaning
- State Illinois
- 43 Moderately Tenant-Leaning · D+7
- County
- — inherits STATE
- City
- — inherits STATE
ZIP-level market 62689
- Active inventory
- 4
- Price-to-rent
- 5.9×
Monthly cashflow live
- Estimated rent
- $850 medium interval (Pro) →
- Mortgage (P&I)
- −$314
- Tax from tax record
- −$130 /mo · $1,565/yr
- Insurance
- −$25
- HOA
- −$0
- Vacancy / Maint / Mgmt
- −$178
- Net cashflow
- $202
Break-even live
Sensitivity live
| Price | -10% $236 | -5% $219 | +0% $202 | +5% $185 | +10% $168 |
|---|---|---|---|---|---|
| Rent | -10% $135 | -5% $168 | +0% $202 | +5% $236 | +10% $269 |
| Rate | -1.0pp $232 | -0.5pp $217 | base $202 | +0.5pp $186 | +1.0pp $171 |
UW: 25.0% down · 7.5% · 30yr · 1.5% tax · 5.0% vac · 8.0% maint · 8.0% mgmt
Financing live
Cash to close
- Down payment
- $14,975
- Closing costs
- $1,797
- Reserves months
- —
- Total cash needed
- —
Loan-product check · same deal, 3 products live
Conventional
25% down · 7.5% · 30yr
- Down + closing
- —
- Monthly P&I
- —
- Monthly cashflow
- —
- DSCR
- —
- Eligible?
- —
Personal DTI + credit; lowest rate.
DSCR
20% down · 8.5% · 30yr
- Down + closing
- —
- Monthly P&I
- —
- Monthly cashflow
- —
- DSCR
- —
- Eligible?
- —
No personal income docs; deal must DSCR.
Hard money
10% down · 12.0% · 12mo
- Down + closing
- —
- Monthly P&I
- —
- Monthly cashflow
- —
- DSCR
- —
- Eligible?
- —
Short-term bridge; refi at stabilization.
Rent comps 1 comps
| Address | Beds | Baths | Sqft | Rent | $/sqft | DOM | Units | Dist |
|---|---|---|---|---|---|---|---|---|
| 216 E Elm St Thayer, IL | 2.0 | 1.0 | 800 | $850 | $1.06 | 44d | 1 | 0.22mi |
Listing history 19 events
-
2026-06-18days on market $59,900 Active 41 DOM
-
2026-06-17days on market $59,900 Active 40 DOM
-
2026-06-16days on market $59,900 Active 39 DOM
-
2026-06-15days on market $59,900 Active 38 DOM
-
2026-06-13days on market $59,900 Active 36 DOM
-
2026-06-12days on market $59,900 Active 35 DOM
-
2026-06-09days on market $59,900 Active 32 DOM
-
2026-06-08days on market $59,900 Active 31 DOM
-
2026-06-07days on market $59,900 Active 30 DOM
-
2026-06-07days on market $59,900 Active 29 DOM
-
2026-06-04days on market $59,900 Active 26 DOM
-
2026-06-02pricedays on market $59,900 Active 25 DOM
-
2026-06-01days on market $69,900 Active 24 DOM
-
2026-05-31days on market $69,900 Active 23 DOM
-
2026-05-31days on market $69,900 Active 22 DOM
-
2026-05-08$69,900 Active 500-char remark
-
2021-08-06historical
-
2009-06-15soldstatus $50,000
-
2001-07-16soldstatus $48,000
ⓘ Source: listings_history table (triggers on properties + properties_extension) + one-shot
backfill from property_details.listing_events for pre-trigger history.
Tax reassessment forecast IL · Partial reset (capped growth)
- Current annual tax
- $1,565 · $130/mo
- Projected year-2 tax
- $1,565 · $130/mo
- Expected delta
- $0/yr ($0/mo · 0.0%)
ⓘ Screening estimate from a state-policy table — verify with the county assessor before closing.
Climate risk First Street
- Flood 1/10 Low FEMA zone X (unshaded) · 0% chance over 30 yrs
- Wildfire 1/10 Low
- Heat 4/10 Moderate 7 d/yr ≥105°F today · 20 d/yr by 30 yrs out
- Wind 2/10 Low 2% chance of damaging wind over 30 yrs
- Air quality 2/10 Low 1 unhealthy d/yr today · 2 by 30 yrs out
Nearby sold comps map
Loading sold comps map…
Walkable amenities ~0.75 mi
Loading nearby amenities…
Taxation est. · year 1
- Rental income
- $10,200
- − Mortgage interest
- −$3,355
- − Property taxes
- −$1,565
- − Insurance
- −$300
- − Repairs & maintenance
- −$816
- − Management
- −$816
- − Depreciation
- −$1,743
- Taxable income
- $1,606
- Est. tax owed @ 24.0%
- −$385
- After-tax cash flow
- $2,039/yr
For passive investors: Depreciation is non-cash, so a rental often shows a tax loss while cash-flowing — sheltering income. Rental losses are passive: they offset passive income freely, and up to $25,000/yr can offset ordinary (W-2) income if you actively participate and your MAGI is under $100k (phasing out to $0 by $150k); unused losses carry forward. On sale, claimed depreciation is recaptured at up to 25%, and gains may owe capital-gains tax (a 1031 exchange can defer both). Figures are a year-1 estimate at your 24.0% rate — not tax advice; consult a CPA.
Schools (NCES district)
No district data.
Livability — Thayer
- Score
- 65/100
- State rank
- #643
- US rank
- #13143
Category grades
Schools grade is shown separately in the Schools card above.
Census & demographics
- Census place
- Thayer, IL
- Population (ZIP)
- 627
Population outlook (Sangamon County) Hauer SSP2
- Today (2025)
- 198,317 people
- By 2030
- 196,127 · -1.1%
- By 2040
- 188,664 · -4.9%
- By 2050
- 179,624 · -9.4%
- By 2075
- 155,027 · -21.8%
- By 2100
- 122,588 · -38.2%
Race, ethnicity, and origin ACS 2023
- Neighborhood character
- Predominantly White (96%)
- Race & ethnicity
- White 96% Two or more races 2% Asian 2%
- Common ancestry
- Portuguese 3% Lithuanian 2% Danish 1%
- Foreign-born
- 2% · China
- Languages at home
- 97% English-only · Other Indo-European 2% German/W. Germanic 1%
Political lean MEDSL · Sangamon
- 2024 margin
- Toss-up / Even · D 46.6% · R 51.6% · Other 1.8%
- 2008→2024 swing
- -9.3pp toward R · 2008: 4.4pp · 2024: -5.0pp
- All cycles
- 2024: R+5.0 2020: R+4.4 2016: R+9.4 2012: R+8.7 2008: D+4.4
Not yet ingested
- Civics
- —
Market trends
- HPI YoY
- —
- Current HPI
- —
- Rent YoY
- —
- Metro
- —
- State GDP YoY
- ▲ 1.59%
- F500 in state
- 60
Industry mix (Fortune 500 HQ in IL)
| Industry | F500 HQs | Revenue |
|---|---|---|
| Insurance | 4 | $201B |
|
||
| Consumer Goods | 4 | $87B |
|
||
| Industrial Machinery | 3 | $64B |
|
||
| Healthcare | 2 | $55B |
|
||
| Retail / Pharmacy | 1 | $148B |
|
||
| Agriculture / Food | 1 | $86B |
|
||
Price history
+24.8% since first listed5 events — show timeline
- 2026-06-02 Price Changed $59,900 RMLSA as Distributed by MLS Grid
- 2026-05-08 Listed $69,900 RMLSA as Distributed by MLS Grid
- 2021-08-06 Listing Removed — RMLSA as Distributed by MLS Grid
- 2009-06-15 Sold (Public Records) $50,000 Public Records
- 2001-07-16 Sold (Public Records) $48,000 Public Records
Property tax history
+2.8%/yrLatest (2025): $1,565 · -0.9% YoY. Source: county tax records.
Cash-flow waterfall
monthlySold comps — $/sqft
last 12 mo · ≤1 miLoading sold comps…