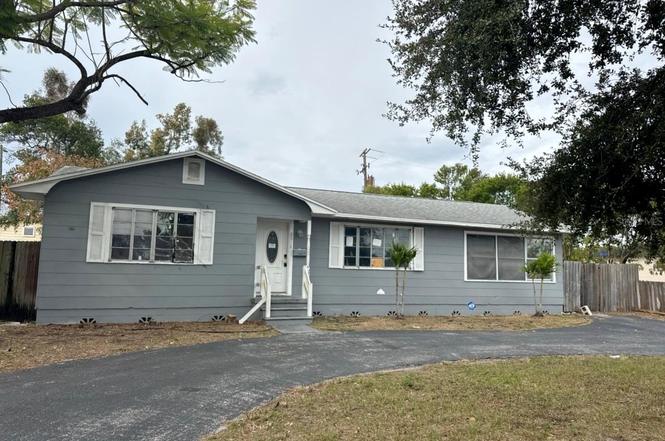
2918 49th St N · St. Petersburg, FL
Flood risk 1/10 · Minimal
- FEMA flood zone
- X (unshaded)
- Chance of flooding over 30 yrs
- 0.0%
- Est. flood insurance / yr
- $507 – $1,088
Fire risk 1/10 · Minimal
- Est. fire insurance / yr
- $947 – $1,759
Heat risk 10/10 · Severe
- Hot days now (above 106°F)
- 7 days/yr
- Hot days in 30 yrs
- 25 days/yr
Wind risk 10/10 · Severe
- Chance of severe wind over 30 yrs
- 99.0%
Air-quality risk 4/10 · Minor
- Unhealthy air days now
- 4 days/yr
- Unhealthy air days in 30 yrs
- 4 days/yr
Risk factors via First Street. Map © Google.
Why this score? — see what drove the C- grade
The composite is a weighted blend of 9 inputs, each scored 0–100. Each bar is that input's sub-score; the figure is the points it added to the 100-point composite (weight × sub-score).
- ARV discount +15.0/15.0
- Cash flow +13.7/30.0
- 1% rule +5.9/10.0
- Schools +4.3/10.0
- DSCR +4.2/10.0
- Livability +2.5/5.0
- Condition / age +2.5/5.0
- Rent growth +2.4/5.0
- Appreciation +0.0/10.0
$240,000
🖨 Deal sheet (PDF) 📄 Offer letter ✓ Due diligence
Listing remarks
Price reduced! Centrally located St Petersburg Home- Open floorplan with wood floors, split bedroom plan. Inside laundry area. Ready for a new owner to put their personal improvements and touches to make this their own! Walk to shopping, restaurants and stores. Front of home has circular driveway, and rear has Alley access for additional storage and parking. Ask agent about seller link to financing.
Key facts
- Alley access
- Inside laundry area
- Wood floors
Tags
Property features AI
Finance
- Other: Lease restrictions apply
- Financial info:
- HOA & community: No HOA association indicated
Exterior
- Parking:
- Security:
- Utilities: Public water; Public sewer; Sewer connected; Water connected; Cable available
- Home design: Single family residence; One story; Faces east; Entry level: One
- Construction: Frame construction; Shingle roof; Pillar/Post/Pier and slab foundation; Built on a 0.19-acre lot (approx. 74 x 110)
- Exterior features: Sidewalk; Asphalt road access
Interior
- Kitchen: Dishwasher; Microwave; Refrigerator
- Bedrooms: 3 bedrooms
- Flooring: Wood flooring
- Bathrooms: 2 full bathrooms
- Heating & cooling: Central heating; Central air conditioning
- Interior features: Eat-in kitchen; Living room/dining room combo
- Laundry & utility: Inside laundry
Neighborhood map
What this means for you Summary
Snapshot
- This is a 3-bed/2.0-bath single-family listed at $240k.
Deal economics
- At list price, monthly cash flow is $19 ($232/yr) — positive.
- The deal already cash-flows at list — no discount required.
- Meets the 1% rule at list price ($3k rent vs $240k).
- Recommended offer: $211k (12.0% below list) — sets the bar for market timing.
- Cap rate 6.4% vs local median 2.6% in St. Petersburg — top-decile yield for the area; either an underpriced asset or a hidden risk that comps aren't pricing in. Stress-test before assuming the spread holds.
Location & tenants
- Location reads: area grade C — affects rentability + tenant quality, not the cash-flow math above.
- Pinellas (suburban): math 51% / reading 51% proficiency, ranked #31 of 73 in FL (top 42%) — acceptable for families but not a draw, mixed tenant base, ~2y average lease.
- Zoned schools: Northwest Elementary School (math 56% / reading 50%, grade C, #963 of 2,144 statewide, top 45%, 477 students, 63% FRL); Tyrone Middle School (math 35% / reading 28%, grade F, #453 of 571 statewide, top 81%, 847 students, 68% FRL); St. Petersburg High School (math 31% / reading 61%, grade D-, #220 of 667 statewide, top 33%, 1,723 students, 39% FRL).
- Market conditions: Rents soft (-0.5%/yr); 320 active listings in the ZIP; 40 comparable units currently listed for rent nearby; rentals leasing fast (median 14d on market — plan ~1-2 weeks tenant-placement turnaround); solid renter incomes; 2,676 units permitted in Pinellas County in 2024 (1,422 in 5+ unit buildings).
- This rent runs 40% of the median local income ($79k/yr) — at the standard rent-burdened threshold; future hikes will face affordability resistance.
Forward outlook
- Local home prices are declining (-3.0%/yr); year-one equity from $2k of loan paydown is wiped out by about $7k of value loss. Plan a longer hold.
- Pinellas County population projected at +14% by 2050 — modest demand growth; plan on rents tracking national, not racing it.
Negotiation context
- It's been on market 135 days — a 12% lower offer ($211k) is reasonable based on typical stale-listing flexibility.
- 13 sale attempts since 18y ago; this cycle's ask has dropped $55k (19%) from the opening price — seller is motivated, your offer sets the floor, not the list.
Risks & watch-outs
- Watch-outs: property tax is 3.4% of price; built in 1953 — expect roof / HVAC / electrical / plumbing capex.
- Climate carrying-cost: severe wind risk, 99% chance of damaging wind over 30y; extreme-heat days projected 7→25/yr by 2055 (HVAC capex compounding) — expect insurance premiums to compound above CPI over the hold.
Questions for the listing agent
- It's been on market 135 days. Have you received any prior offers? Is the seller open to a 12% concession, seller financing, or rate buy-down credit?
- Built in 1953 — when were the roof, HVAC, electrical panel, plumbing, and water heater last replaced?
- Property tax is high relative to price — has the assessment been appealed recently, and will the sale trigger a re-assessment?
- Why hasn't it sold? Are there any deal-killer items the seller is aware of (foundation, flood, title, zoning, code violations)?
- Is there a deadline driving the sale (1031 exchange, divorce, estate, relocation)? That informs how much negotiation room exists.
- What's the average days-on-market for RENTAL listings here right now (not sales)? A rising rental-DOM trend means longer vacancies and softer asking-rent achievability than the comps imply.
- What's the recent tenant-quality profile in this submarket — average credit score on applications, eviction rate, late-payment / NSF rate, and stable-employment percentage? A property-management company in the area should have these aggregated.
- How much new for-sale + rental construction is in the pipeline within 1–3 miles? Heavy new supply typically softens prices + rents 12–24 months out; constrained supply supports both.
Investment metrics
- 1% rule
- 1.09% ✓
- Cap rate
- 6.39%
- Cash-on-cash
- 0.35%
- DSCR
- 1.02
- GRM
- 7.7
CMA / ARV
- ARV (on-the-fly)
- $456,630
- Comps found
- 12
Show comp detail 12 sales within ~0.75 mi
| Address | Dist | Beds/Ba | Sqft | Sold | Price | $/sf | Match |
|---|---|---|---|---|---|---|---|
| 2817 49th St N | 0.06mi | 3/2.0 | 1,396 (-5%) | 1mo | $320,000 | $229 | 87 |
| 2700 49th St N | 0.14mi | 3/2.0 | 1,628 (+10%) | 2mo | $505,000 | $310 | 75 |
| 5119 21st Ave N | 0.54mi | 3/2.0 | 1,483 (+1%) | 0mo | $536,000 | $361 | 73 |
| 2728 York St N | 0.23mi | 3/2.0 | 1,333 (-10%) | 3mo | $445,000 | $334 | 71 |
| 4803 32nd Ave N | 0.20mi | 3/2.0 | 1,302 (-12%) | 3mo | $485,000 | $373 | 69 |
| 2898 56th Ln N | 0.64mi | 3/2.0 | 1,465 (-0%) | 2mo | $528,000 | $360 | 68 |
| 4545 34th Ave N | 0.46mi | 2/2.0 (-1) | 1,376 (-7%) | 2mo | $385,000 | $280 | 61 |
| 2800 54th St N | 0.45mi | 2/2.0 (-1) | 1,374 (-7%) | 2mo | $375,000 | $273 | 61 |
| 4945 34th Ave N | 0.34mi | 3/2.0 | 1,272 (-14%) | 1mo | $385,000 | $303 | 60 |
| 3213 56th Way N | 0.59mi | 3/2.0 | 1,367 (-7%) | 3mo | $430,000 | $315 | 58 |
| 4322 22nd Ave N | 0.68mi | 2/2.0 (-1) | 1,344 (-9%) | 3mo | $408,000 | $304 | 46 |
| 3700 56th St N | 0.75mi | 2/1.0 (-1) | 1,266 (-14%) | 2mo | $365,000 | $288 | 31 |
Match score weights: distance 35% · size 25% · config 20% · recency 20%. Top-matched comps best support the ARV.
Projected returns pro-forma
-3.0% appreciation · 0.0% rent growth · sell at horizon
- IRR
- -19.9%
- Equity multiple
- 0.33×
- Total profit
- $-45,034
- Equity at exit
- $35,785
- IRR
- -23.7%
- Equity multiple
- 0.02×
- Total profit
- $-66,076
- Equity at exit
- $20,751
Cash invested: $67,200 (down + closing). Projections, not guarantees.
Landlord ↔ Tenant lean methodology
- Overall (STATE)
- 87 Strongly Landlord-Friendly
- State Florida
- 87 Strongly Landlord-Friendly · R+3
- County
- — inherits STATE
- City
- — inherits STATE
ZIP-level market 33710
- Rents YoY
- -0.5%
- Active inventory
- 320
- Price-to-rent
- 7.7×
Monthly cashflow live
- Estimated rent
- $2,610 high interval (Pro) →
- Mortgage (P&I)
- −$1,259
- Tax from tax record
- −$684 /mo · $8,212/yr
- Insurance
- −$100
- HOA
- −$0
- Vacancy / Maint / Mgmt
- −$548
- Net cashflow
- $19
Break-even live
Sensitivity live
| Price | -10% $155 | -5% $87 | +0% $19 | +5% $-49 | +10% $-117 |
|---|---|---|---|---|---|
| Rent | -10% $-187 | -5% $-84 | +0% $19 | +5% $122 | +10% $226 |
| Rate | -1.0pp $140 | -0.5pp $80 | base $19 | +0.5pp $-43 | +1.0pp $-106 |
UW: 25.0% down · 7.5% · 30yr · 1.5% tax · 5.0% vac · 8.0% maint · 8.0% mgmt
Financing live
Cash to close
- Down payment
- $60,000
- Closing costs
- $7,200
- Reserves months
- —
- Total cash needed
- —
Loan-product check · same deal, 3 products live
Conventional
25% down · 7.5% · 30yr
- Down + closing
- —
- Monthly P&I
- —
- Monthly cashflow
- —
- DSCR
- —
- Eligible?
- —
Personal DTI + credit; lowest rate.
DSCR
20% down · 8.5% · 30yr
- Down + closing
- —
- Monthly P&I
- —
- Monthly cashflow
- —
- DSCR
- —
- Eligible?
- —
No personal income docs; deal must DSCR.
Hard money
10% down · 12.0% · 12mo
- Down + closing
- —
- Monthly P&I
- —
- Monthly cashflow
- —
- DSCR
- —
- Eligible?
- —
Short-term bridge; refi at stabilization.
Rent comps 40 comps
| Address | Beds | Baths | Sqft | Rent | $/sqft | DOM | Units | Dist |
|---|---|---|---|---|---|---|---|---|
| 5200 26th Ave N St Petersburg, FL | 3.0 | 2.0 | 1755 | $4,500 | $2.56 | 26d | 1 | 0.37mi |
| 2819 53rd St N Saint Petersburg, FL | 2.0 | 1.0 | 900 | $1,995 | $2.22 | 6d | 1 | 0.41mi |
| 4912 23rd Ave N Saint Petersburg, FL | 3.0 | 2.0 | 1760 | $3,195 | $1.82 | 6d | 1 | 0.45mi |
| 3300 55th St N Saint Petersburg, FL | 3.0 | 2.0 | 1677 | $3,011 | $1.80 | 24d | 1 | 0.56mi |
| 4083 30th Ave N Saint Petersburg, FL | 2.0 | 1.0 | 924 | $1,750 | $1.89 | 20d | 1 | 0.65mi |
| 4218 24th Ave N Saint Petersburg, FL | 2.0 | 1.0 | 1121 | $1,925 | $1.72 | 6d | 1 | 0.66mi |
| 4116 Yardley Ave N Saint Petersburg, FL | 3.0 | 2.0 | 1680 | $4,150 | $2.47 | 6d | 1 | 0.68mi |
| 4220 37th Ave N Saint Petersburg, FL | 3.0 | 1.0 | 1245 | $2,250 | $1.81 | 20d | 1 | 0.69mi |
| 3910 44th St N Unit C9 Saint Petersburg, FL | 2.0 | 1.0 | 965 | $1,395 | $1.45 | 16d | 1 | 0.73mi |
| 5145 17th Ave N Saint Petersburg, FL | 3.0 | 2.0 | 1242 | $2,875 | $2.31 | 0d | 1 | 0.77mi |
| 5813 26th Ave N Saint Petersburg, FL | 4.0 | 2.0 | 1543 | $4,795 | $3.11 | 6d | 1 | 0.82mi |
| 5535 18th Ave N Saint Petersburg, FL | 2.0 | 1.5 | 961 | $1,975 | $2.06 | 0d | 1 | 0.88mi |
| 1803 42nd Way N Saint Petersburg, FL | 2.0 | 2.0 | 1421 | $4,200 | $2.96 | 26d | 1 | 0.89mi |
| 3750 28th Ave N Saint Petersburg, FL | 3.0 | 2.0 | 1512 | $2,830 | $1.87 | 26d | 1 | 0.95mi |
| 5900 22nd Ave N Unit 14 St. Petersburg, FL | 2.0 | 1.0 | 1000 | $1,650 | $1.65 | 16d | 1 | 0.97mi |
| 5900 22nd Ave N Saint Petersburg, FL | 3.0 | 1.0 | 1100 | $1,950 | $1.77 | 6d | 1 | 0.97mi |
| 5900 22nd Ave N Unit 1 St. Petersburg, FL | 3.0 | 2.0 | 1100 | $1,999 | $1.82 | 20d | 1 | 0.97mi |
| 5870 38th Ave N #40 Saint Petersburg, FL | 2.0 | 1.0 | 985 | $1,800 | $1.83 | 18d | 1 | 0.97mi |
| 3664 29th Ave N Saint Petersburg, FL | 2.0 | 1.0 | 1105 | $2,400 | $2.17 | 16d | 1 | 1.03mi |
| 4000 58th St N Kenneth City, FL | 2.0 | 1.0 | 900 | $1,649 | $1.83 | 17d | 4 | 1.04mi |
| 2176 Winchester Rd N #2 Saint Petersburg, FL | 3.0 | 2.0 | 1080 | $2,250 | $2.08 | 17d | 1 | 1.07mi |
| 3735 39th Ave N Saint Petersburg, FL | 2.0 | 1.0 | 1291 | $2,200 | $1.70 | 6d | 1 | 1.13mi |
| 1101 46th St N Saint Petersburg, FL | 2.0 | 1.0 | 1300 | $2,200 | $1.69 | 0d | 1 | 1.13mi |
| 5290 48th Ave N Saint Petersburg, FL | 3.0 | 1.0 | 1320 | $2,415 | $1.83 | 6d | 1 | 1.16mi |
| 5481 47th Ave N Saint Petersburg, FL | 3.0 | 1.0 | 1520 | $2,250 | $1.48 | 6d | 1 | 1.18mi |
| 5589 46th Ave N Kenneth City, FL | 4.0 | 2.0 | 1503 | $3,000 | $2.00 | 6d | 1 | 1.19mi |
| 4136 13th Ave N Saint Petersburg, FL | 3.0 | 2.0 | 1154 | $2,600 | $2.25 | 13d | 1 | 1.19mi |
| 6080 22nd Ave N #3 Saint Petersburg, FL | 2.0 | 2.0 | 890 | $1,825 | $2.05 | 26d | 1 | 1.19mi |
| 6080 22nd Ave N #5 Saint Petersburg, FL | 2.0 | 2.0 | 890 | $1,725 | $1.94 | 26d | 1 | 1.19mi |
| 6080 22nd Ave N #3 Saint Petersburg, FL | 2.0 | 2.0 | 900 | $1,825 | $2.03 | 6d | 1 | 1.19mi |
| 4594 10th Ave N Saint Petersburg, FL | 3.0 | 2.0 | 1432 | $3,100 | $2.16 | 26d | 1 | 1.23mi |
| 5261 48th Ter N Saint Petersburg, FL | 3.0 | 2.0 | 1283 | $2,400 | $1.87 | 0d | 1 | 1.23mi |
| 5261 48th Ter N Saint Petersburg, FL | 3.0 | 2.0 | 1283 | $2,400 | $1.87 | 13d | 1 | 1.23mi |
| 6190 36th Ave N Saint Petersburg, FL | 2.0 | 1.0 | 1008 | $2,500 | $2.48 | 6d | 1 | 1.26mi |
| 3316 31st Ave N St. Petersburg, FL | 1.0–2.0 | 1.0 | 825 | $1,649 | $2.00 | 0d | 3 | 1.30mi |
| 5318 9th Ave N Saint Petersburg, FL | 3.0 | 2.0 | 1142 | $2,600 | $2.28 | 6d | 1 | 1.31mi |
| 5038 54th Way N Saint Petersburg, FL | 3.0 | 2.0 | 1366 | $2,500 | $1.83 | 26d | 1 | 1.40mi |
| 630 50th St N Saint Petersburg, FL | 2.0 | 1.0 | 1085 | $2,070 | $1.91 | 26d | 1 | 1.41mi |
| 3200 33rd Ave N Saint Petersburg, FL | 2.0 | 1.5 | 1111 | $2,195 | $1.98 | 26d | 1 | 1.43mi |
| 4526 6th Ave N Saint Petersburg, FL | 2.0 | 1.0 | 888 | $1,950 | $2.20 | 6d | 1 | 1.49mi |
Listing history 39 events
-
2026-05-18price $240,000
-
2026-03-07price $275,000
-
2026-01-13$295,000 Active
-
2025-08-14$5,000 Active
-
2024-02-09historical
-
2023-11-20$370,000 Active
-
2023-07-25status Pending
-
2023-07-25historical
-
2023-07-10$304,900 Active
-
2023-05-26historical
-
2023-05-15$385,000 Active
-
2021-09-16soldstatus $329,000
-
2021-09-14soldstatus $329,000 Closed
-
2021-08-01status Pending
-
2021-07-25price $319,000
-
2021-07-16price $320,000
-
2021-07-09price $325,000
-
2021-07-03price $327,000
-
2021-06-11price $328,000
-
2021-05-29price $328,900
-
2021-05-21status Active
-
2021-05-21status Pending
-
2021-05-16$329,000 Active
-
2021-01-13soldstatus $200,000
-
2021-01-08soldstatus $200,000 Sold
-
2020-12-09status Pending
-
2020-11-29status Active
-
2020-11-23status Pending
-
2020-11-19$220,000 Active
-
2020-01-29status Pending
-
2020-01-28historical
-
2020-01-17$210,000 Active
-
2019-12-17historical
-
2019-11-06price $199,999
-
2019-10-03price $209,000
-
2019-08-21$219,900 Active
-
2010-07-15$70,000
-
2009-01-14historical
-
2008-04-18$139,000
ⓘ Source: listings_history table (triggers on properties + properties_extension) + one-shot
backfill from property_details.listing_events for pre-trigger history.
Tax reassessment forecast FL · Resets to sale price
- Current annual tax
- $8,212 · $684/mo
- Projected year-2 tax
- $8,212 · $684/mo
- Expected delta
- $0/yr ($0/mo · 0.0%)
ⓘ Screening estimate from a state-policy table — verify with the county assessor before closing.
Climate risk First Street
- Flood 1/10 Low FEMA zone X (unshaded) · 0% chance over 30 yrs
- Wildfire 1/10 Low
- Heat 10/10 Extreme 7 d/yr ≥106°F today · 25 d/yr by 30 yrs out
- Wind 10/10 Extreme 99% chance of damaging wind over 30 yrs
- Air quality 4/10 Moderate 4 unhealthy d/yr today · 4 by 30 yrs out
Nearby sold comps map
Loading sold comps map…
Walkable amenities ~0.75 mi
Loading nearby amenities…
Taxation est. · year 1
- Rental income
- $31,325
- − Mortgage interest
- −$13,444
- − Property taxes
- −$8,212
- − Insurance
- −$1,200
- − Repairs & maintenance
- −$2,506
- − Management
- −$2,506
- − Depreciation
- −$6,982
- Taxable loss
- −$3,524
- Est. tax savings @ 24.0%
- +$846
- After-tax cash flow
- $1,078/yr
For passive investors: Depreciation is non-cash, so a rental often shows a tax loss while cash-flowing — sheltering income. Rental losses are passive: they offset passive income freely, and up to $25,000/yr can offset ordinary (W-2) income if you actively participate and your MAGI is under $100k (phasing out to $0 by $150k); unused losses carry forward. On sale, claimed depreciation is recaptured at up to 25%, and gains may owe capital-gains tax (a 1031 exchange can defer both). Figures are a year-1 estimate at your 24.0% rate — not tax advice; consult a CPA.
Schools (NCES district)
- District
- Pinellas
- NCES district ID
- 1201560
- Math proficiency
- 51% ▼ -5.00%
- Reading proficiency
- 51% ▼ -3.00%
- Median HH income
- $46,270
- Composite
- 43.27/100
- National rank
- #3046
- State rank
- #31 of 73 in FL
Livability — St. Petersburg
No livability data for this city. (Only ~50 U.S. cities are tracked.)
Census & demographics
- Census place
- St. Petersburg, FL
- County
- Pinellas County · 939,478 people
- City population
- 249,151
- Metro
- Tampa-St. Petersburg-Clearwater, FL
- Population (ZIP)
- 33,796
- Household income
- $78,611
- Rent vs Own
- Severe rent burden
- 542.0
Population outlook (Pinellas County) Hauer SSP2
- Today (2025)
- 1,027,532 people
- By 2030
- 1,063,586 · +3.5%
- By 2040
- 1,125,020 · +9.5%
- By 2050
- 1,168,637 · +13.7%
- By 2075
- 1,265,188 · +23.1%
- By 2100
- 1,260,357 · +22.7%
Race, ethnicity, and origin ACS 2023
- Neighborhood character
- Predominantly White (77%)
- Race & ethnicity
- White 77% Two or more races 10% Hispanic / Latino 9% Asian 5% Black 4%
- Hispanic origin (detail)
- Mexican 1% Puerto Rican 2% Cuban 2%
- Common ancestry
- Lithuanian 3% Romanian 3% Slovak 2%
- Foreign-born
- 12% · Canada, Vietnam, China
- Languages at home
- 85% English-only · Spanish 7% Other Indo-European 2% Russian/Polish/Slavic 2%
Political lean MEDSL · Pinellas
- 2024 margin
- Lean R (+5.2) · D 46.9% · R 52.1%
- 2008→2024 swing
- -13.5pp toward R · 2008: 8.3pp · 2024: -5.2pp
- All cycles
- 2024: R+5.2 2020: D+0.2 2016: R+1.1 2012: D+5.6 2008: D+8.3
Not yet ingested
- Civics
- —
Market trends
- HPI YoY
- ▼ -547.31%
- Current HPI
- 405.0731
- Rent YoY
- ▼ -0.48%
- Metro
- Tampa-St. Petersburg-Clearwater, FL
- State GDP YoY
- ▲ 3.28%
- F500 in state
- 36
Industry mix (Fortune 500 HQ in FL)
| Industry | F500 HQs | Revenue |
|---|---|---|
| Industrial Technology | 2 | $29B |
|
||
| Insurance | 2 | $17B |
|
||
| Retail | 1 | $60B |
|
||
| Technology Distribution | 1 | $58B |
|
||
| Homebuilding | 1 | $35B |
|
||
| Technology Manufacturing | 1 | $35B |
|
||
Price history
+72.7% since first listed39 events — show timeline
- 2026-05-18 Price Changed $240,000 Stellar MLS as Distributed by MLS Grid
- 2026-03-07 Price Changed $275,000 Stellar MLS as Distributed by MLS Grid
- 2026-01-13 Listed $295,000 Stellar MLS as Distributed by MLS Grid
- 2025-08-14 Listed $5,000 NFMLS
- 2024-02-09 Listing Removed — Stellar MLS as Distributed by MLS Grid
- 2023-11-20 Listed $370,000 Stellar MLS as Distributed by MLS Grid
- 2023-07-25 Pending — Stellar MLS as Distributed by MLS Grid
- 2023-07-25 Listing Removed — Stellar MLS as Distributed by MLS Grid
- 2023-07-10 Listed $304,900 Stellar MLS as Distributed by MLS Grid
- 2023-05-26 Listing Removed — Stellar MLS as Distributed by MLS Grid
- 2023-05-15 Listed $385,000 Stellar MLS as Distributed by MLS Grid
- 2021-09-16 Sold (Public Records) $329,000 Public Records
- 2021-09-14 Sold (MLS) $329,000 Stellar MLS as Distributed by MLS Grid
- 2021-08-01 Pending — Stellar MLS as Distributed by MLS Grid
- 2021-07-25 Price Changed $319,000 Stellar MLS as Distributed by MLS Grid
- 2021-07-16 Price Changed $320,000 Stellar MLS as Distributed by MLS Grid
- 2021-07-09 Price Changed $325,000 Stellar MLS as Distributed by MLS Grid
- 2021-07-03 Price Changed $327,000 Stellar MLS as Distributed by MLS Grid
- 2021-06-11 Price Changed $328,000 Stellar MLS as Distributed by MLS Grid
- 2021-05-29 Price Changed $328,900 Stellar MLS as Distributed by MLS Grid
- 2021-05-21 Relisted — Stellar MLS as Distributed by MLS Grid
- 2021-05-21 Pending — Stellar MLS as Distributed by MLS Grid
- 2021-05-16 Listed $329,000 Stellar MLS as Distributed by MLS Grid
- 2021-01-13 Sold (Public Records) $200,000 Public Records
- 2021-01-08 Sold (MLS) $200,000 Stellar MLS as Distributed by MLS Grid
- 2020-12-09 Pending — Stellar MLS as Distributed by MLS Grid
- 2020-11-29 Relisted — Stellar MLS as Distributed by MLS Grid
- 2020-11-23 Pending — Stellar MLS as Distributed by MLS Grid
- 2020-11-19 Listed $220,000 Stellar MLS as Distributed by MLS Grid
- 2020-01-29 Pending — Stellar MLS as Distributed by MLS Grid
- 2020-01-28 Listing Removed — Stellar MLS as Distributed by MLS Grid
- 2020-01-17 Listed $210,000 Stellar MLS as Distributed by MLS Grid
- 2019-12-17 Listing Removed — Stellar MLS as Distributed by MLS Grid
- 2019-11-06 Price Changed $199,999 Stellar MLS as Distributed by MLS Grid
- 2019-10-03 Price Changed $209,000 Stellar MLS as Distributed by MLS Grid
- 2019-08-21 Listed $219,900 Stellar MLS as Distributed by MLS Grid
- 2010-07-15 Listed $70,000 Stellar MLS as Distributed by MLS Grid
- 2009-01-14 Listing Removed — Stellar MLS as Distributed by MLS Grid
- 2008-04-18 Listed $139,000 Stellar MLS as Distributed by MLS Grid
Property tax history
+12.6%/yrLatest (2025): $8,212 · +8.2% YoY. Source: county tax records.
Cash-flow waterfall
monthlySold comps — $/sqft
last 12 mo · ≤1 miLoading sold comps…