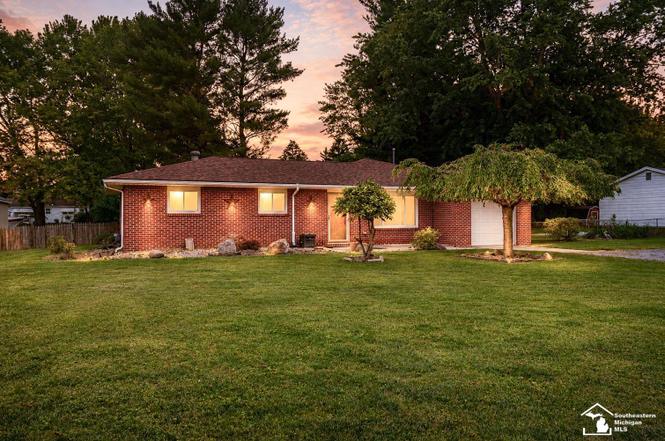
8940 Woodside Dr · Bedford, MI
Flood risk 1/10 · Minimal
- FEMA flood zone
- X (unshaded)
- Chance of flooding over 30 yrs
- 0.0%
- Est. flood insurance / yr
- $507 – $1,088
Fire risk 3/10 · Minor
- Est. fire insurance / yr
- $784 – $1,456
Heat risk 3/10 · Minor
- Hot days now (above 100°F)
- 7 days/yr
- Hot days in 30 yrs
- 16 days/yr
Wind risk 2/10 · Minimal
- Chance of severe wind over 30 yrs
- —
Air-quality risk 2/10 · Minimal
- Unhealthy air days now
- 1 days/yr
- Unhealthy air days in 30 yrs
- 3 days/yr
Risk factors via First Street. Map © Google.
Why this score? — see what drove the D grade
The composite is a weighted blend of 9 inputs, each scored 0–100. Each bar is that input's sub-score; the figure is the points it added to the 100-point composite (weight × sub-score).
- Cash flow +15.6/30.0
- ARV discount +8.5/15.0
- DSCR +4.8/10.0
- Schools +3.8/10.0
- 1% rule +3.0/10.0
- Rent growth +2.5/5.0
- Livability +2.5/5.0
- Condition / age +2.5/5.0
- Appreciation +0.0/10.0
$275,000
🖨 Deal sheet (PDF) 📄 Offer letter ✓ Due diligence
Listing remarks MLS
Welcome home to this well-maintained 4-bedroom, 2 full bath brick ranch in the desirable Bedford School District! Situated on a quarter-acre lot, this property offers a fully fenced backyard perfect for pets, play, and outdoor entertaining. ; As well as, two outbuildings providing plenty of storage. Inside, you'll find flawless hardwood floors throughout and a spacious family room featuring a cozy wood-burning fireplace. The 1-car attached garage provides convenience and additional storage. Buy with confidence knowing the home has a newer roof. With its solid construction, thoughtful maintenance, and comfortable layout, this home is move-in ready and waiting for its next owner!
Key facts
- Newer roof
- Two outbuildings
- Hardwood floors
Tags
Property features AI
Finance
- HOA & community: Property is part of a homeowners association
Exterior
- Parking: Attached garage with 1 parking space
- Utilities: Private well water; Septic tank sewer
- Home design: One-level single-family residence; Brick exterior
- Construction: Brick construction
- Exterior features: No pool; Lot approximately 100 x 160 (0.37 acres); Located in the Ridgewood Addition subdivision; near W. Temperance Rd. and Marengo Dr.
Interior
- Flooring: Hardwood floors
- Bathrooms: Two full bathrooms
- Heating & cooling: Forced air heating (natural gas); Central air conditioning
- Interior features: Gas water heater; Wood-burning fireplace in the family room; Crawl space basement
Neighborhood map
What this means for you Summary
Snapshot
- This is a 4-bed/2.0-bath single-family listed at $275k.
Deal economics
- At list price, monthly cash flow is $115 ($1k/yr) — positive.
- The deal already cash-flows at list — no discount required.
- To meet the 1% rule (rent ≥ 1% of price), the offer needs to be $221k (19.8% below list).
- Recommended offer: $221k (19.8% below list) — sets the bar for 1% rule.
Location & tenants
- Location reads: area grade D — affects rentability + tenant quality, not the cash-flow math above.
- Bedford Public Schools (suburban): math 33% / reading 53% proficiency, ranked #150 of 540 in MI (top 28%) — families likely to look elsewhere, expect single-tenant / working-renter base with shorter leases; only 18% free/reduced lunch — higher-income household profile.
- Zoned schools: Douglas Road Elementary School (math 37% / reading 47%, grade F, #547 of 1,397 statewide, top 41%, 575 students, 32% FRL); Bedford Junior High School (math 30% / reading 52%, grade F, #195 of 493 statewide, top 41%, 911 students, 29% FRL); Bedford Senior High School (math 38% / reading 64%, grade D+, #142 of 713 statewide, top 20%, 1,294 students, 27% FRL).
- Market conditions: 82 active listings in the ZIP; solid renter incomes; 264 units permitted in Monroe County in 2024 (40 in 5+ unit buildings).
- This rent runs 32% of the median local income ($83k/yr) — at the standard rent-burdened threshold; future hikes will face affordability resistance.
Forward outlook
- Local home prices are declining (-3.0%/yr); year-one equity from $2k of loan paydown is wiped out by about $8k of value loss. Plan a longer hold.
- Monroe County population projected at -20% by 2050 — secular population decline; favor cash flow + early exit over multi-decade hold.
Negotiation context
- Only 2 days on market — expect competitive offers; lowballing is unlikely to land.
- 4 sale attempts since 21y ago with the ask held roughly flat each time — persistent listings suggest the price (not the market) is what's stuck; bring a comps-based counter.
- Current owner paid $148k; list at $275k implies a 85% gain — meaningful room to come down on a strong offer.
Questions for the listing agent
- Built in 1965 — when were the roof, HVAC, electrical panel, plumbing, and water heater last replaced?
- Is there a deadline driving the sale (1031 exchange, divorce, estate, relocation)? That informs how much negotiation room exists.
- The area grade is low — what's the realistic commute time and amenity access for the typical tenant pool here? Any planned neighborhood developments (good or bad) we should know about?
- What's the average days-on-market for RENTAL listings here right now (not sales)? A rising rental-DOM trend means longer vacancies and softer asking-rent achievability than the comps imply.
- What's the recent tenant-quality profile in this submarket — average credit score on applications, eviction rate, late-payment / NSF rate, and stable-employment percentage? A property-management company in the area should have these aggregated.
- How much new for-sale + rental construction is in the pipeline within 1–3 miles? Heavy new supply typically softens prices + rents 12–24 months out; constrained supply supports both.
Investment metrics
- 1% rule
- 0.80% ✗
- Cap rate
- 6.79%
- Cash-on-cash
- 1.79%
- DSCR
- 1.08
- GRM
- 10.4
CMA / ARV
- ARV (on-the-fly)
- $281,106
- Comps found
- 3
Show comp detail 3 sales within ~0.75 mi
| Address | Dist | Beds/Ba | Sqft | Sold | Price | $/sf | Match |
|---|---|---|---|---|---|---|---|
| 8872 Woodside Dr | 0.13mi | 3/1.0 (-1) | 1,888 (+8%) | 1mo | $239,900 | $127 | 70 |
| 8650 Mary Meadows Dr | 0.46mi | 3/2.0 (-1) | 1,792 (+3%) | 11mo | $400,000 | $223 | 60 |
| 9161 Cedar Ridge Ln | 0.61mi | 4/2.0 | 1,902 (+9%) | 4mo | $307,000 | $161 | 54 |
Match score weights: distance 35% · size 25% · config 20% · recency 20%. Top-matched comps best support the ARV.
Projected returns pro-forma
-3.0% appreciation · 3.0% rent growth · sell at horizon
- IRR
- -13.5%
- Equity multiple
- 0.51×
- Total profit
- $-37,389
- Equity at exit
- $41,003
- IRR
- -4.7%
- Equity multiple
- 0.69×
- Total profit
- $-23,692
- Equity at exit
- $23,777
Cash invested: $77,000 (down + closing). Projections, not guarantees.
Landlord ↔ Tenant lean methodology
- Overall (STATE)
- 62 Landlord-Friendly
- State Michigan
- 62 Landlord-Friendly · EVEN
- County
- — inherits STATE
- City
- — inherits STATE
ZIP-level market 48182
- Active inventory
- 82
- Price-to-rent
- 10.4×
Monthly cashflow live
- Estimated rent
- $2,206 medium interval (Pro) →
- Mortgage (P&I)
- −$1,442
- Tax from tax record
- −$72 /mo · $859/yr
- Insurance
- −$115
- HOA
- −$0
- Vacancy / Maint / Mgmt
- −$463
- Net cashflow
- $115
Break-even live
Sensitivity live
| Price | -10% $270 | -5% $193 | +0% $115 | +5% $37 | +10% $-41 |
|---|---|---|---|---|---|
| Rent | -10% $-60 | -5% $28 | +0% $115 | +5% $202 | +10% $289 |
| Rate | -1.0pp $253 | -0.5pp $185 | base $115 | +0.5pp $43 | +1.0pp $-29 |
UW: 25.0% down · 7.5% · 30yr · 1.5% tax · 5.0% vac · 8.0% maint · 8.0% mgmt
Financing live
Cash to close
- Down payment
- $68,750
- Closing costs
- $8,250
- Reserves months
- —
- Total cash needed
- —
Loan-product check · same deal, 3 products live
Conventional
25% down · 7.5% · 30yr
- Down + closing
- —
- Monthly P&I
- —
- Monthly cashflow
- —
- DSCR
- —
- Eligible?
- —
Personal DTI + credit; lowest rate.
DSCR
20% down · 8.5% · 30yr
- Down + closing
- —
- Monthly P&I
- —
- Monthly cashflow
- —
- DSCR
- —
- Eligible?
- —
No personal income docs; deal must DSCR.
Hard money
10% down · 12.0% · 12mo
- Down + closing
- —
- Monthly P&I
- —
- Monthly cashflow
- —
- DSCR
- —
- Eligible?
- —
Short-term bridge; refi at stabilization.
Listing history 4 events
-
2026-06-19status $275,000 Pending 2 DOM
-
2026-06-18days on market $275,000 Active 2 DOM
-
2026-06-17remarks 687-char remark
-
2026-06-17$275,000 Active 1 DOM
ⓘ Source: listings_history table (triggers on properties + properties_extension) + one-shot
backfill from property_details.listing_events for pre-trigger history.
Tax reassessment forecast MI · Partial reset (capped growth)
- Current annual tax
- $859 · $72/mo
- Projected year-2 tax
- $2,547 · $212/mo
- Expected delta
- +$1,688/yr (+$141/mo · 196.6%)
ⓘ Screening estimate from a state-policy table — verify with the county assessor before closing.
Climate risk First Street
- Flood 1/10 Low FEMA zone X (unshaded) · 0% chance over 30 yrs
- Wildfire 3/10 Moderate
- Heat 3/10 Moderate 7 d/yr ≥100°F today · 16 d/yr by 30 yrs out
- Wind 2/10 Low
- Air quality 2/10 Low 1 unhealthy d/yr today · 3 by 30 yrs out
Nearby sold comps map
Loading sold comps map…
Walkable amenities ~0.75 mi
Loading nearby amenities…
Taxation est. · year 1
- Rental income
- $26,476
- − Mortgage interest
- −$15,404
- − Property taxes
- −$859
- − Insurance
- −$1,375
- − Repairs & maintenance
- −$2,118
- − Management
- −$2,118
- − Depreciation
- −$8,000
- Taxable loss
- −$3,398
- Est. tax savings @ 24.0%
- +$816
- After-tax cash flow
- $2,192/yr
For passive investors: Depreciation is non-cash, so a rental often shows a tax loss while cash-flowing — sheltering income. Rental losses are passive: they offset passive income freely, and up to $25,000/yr can offset ordinary (W-2) income if you actively participate and your MAGI is under $100k (phasing out to $0 by $150k); unused losses carry forward. On sale, claimed depreciation is recaptured at up to 25%, and gains may owe capital-gains tax (a 1031 exchange can defer both). Figures are a year-1 estimate at your 24.0% rate — not tax advice; consult a CPA.
Schools (NCES district)
- District
- Bedford Public Schools
- NCES district ID
- 2604470
- Math proficiency
- 33% ▼ -14.00%
- Reading proficiency
- 53% ▼ -3.00%
- Median HH income
- $63,784
- Composite
- 38.22/100
- National rank
- #4252
- State rank
- #150 of 540 in MI
Livability — Bedford
No livability data for this city. (Only ~50 U.S. cities are tracked.)
Census & demographics
- County
- Monroe · 31,363 people
- Metro
- Monroe, MI
- Population (ZIP)
- 20,705
- Household income
- $83,155
- Rent vs Own
- Severe rent burden
- 12.7
Population outlook (Monroe County) Hauer SSP2
- Today (2025)
- 144,439 people
- By 2030
- 140,033 · -3.1%
- By 2040
- 128,408 · -11.1%
- By 2050
- 115,024 · -20.4%
- By 2075
- 87,273 · -39.6%
- By 2100
- 63,110 · -56.3%
Race, ethnicity, and origin ACS 2023
- Neighborhood character
- Predominantly White (90%)
- Race & ethnicity
- White 90% Hispanic / Latino 6% Two or more races 5% Black 1%
- Hispanic origin (detail)
- Mexican 4%
- Common ancestry
- Romanian 14% Lithuanian 4% Italian 3%
- Foreign-born
- 2% · Canada
- Languages at home
- 97% English-only · Spanish 2% Other Indo-European 1%
Political lean MEDSL · Monroe
- 2024 margin
- Strong R (+27.1) · D 35.7% · R 62.9% · Other 1.4%
- 2008→2024 swing
- -31.5pp toward R · 2008: 4.3pp · 2024: -27.1pp
- All cycles
- 2024: R+27.1 2020: R+22.6 2016: R+22.1 2012: D+1.0 2008: D+4.3
Not yet ingested
- Civics
- —
Market trends
- HPI YoY
- ▼ -140.99%
- Current HPI
- 158.2484
- Rent YoY
- —
- Metro
- —
- State GDP YoY
- ▲ 1.37%
- F500 in state
- 28
Industry mix (Fortune 500 HQ in MI)
| Industry | F500 HQs | Revenue |
|---|---|---|
| Automotive Parts | 3 | $48B |
|
||
| Automotive | 2 | $372B |
|
||
| Chemicals | 1 | $45B |
|
||
| Automotive Retail | 1 | $29B |
|
||
| Healthcare / Medical Devices | 1 | $23B |
|
||
| Automotive Technology | 1 | $20B |
|
||
Price history
+72.0% since first listed7 events — show timeline
- 2026-06-16 Listed $275,000 REALCOMP
- 2026-06-16 Listed $275,000 MiRealSource-MiMLS
- 2005-12-13 Sold (Public Records) $148,500 Public Records
- 2005-11-28 Sold (MLS) $148,500 REALCOMP
- 2005-11-28 Sold (MLS) $148,500 MiRealSource-MiMLS
- 2005-05-06 Listed $159,900 REALCOMP
- 2005-05-06 Listed $159,900 MiRealSource-MiMLS
Property tax history
-3.4%/yrLatest (2025): $859 · -58.2% YoY. Source: county tax records.
Cash-flow waterfall
monthlySold comps — $/sqft
last 12 mo · ≤1 miLoading sold comps…