55 West End Ave · East Quogue, NY
Flood risk No data
- FEMA flood zone
- —
- Chance of flooding over 30 yrs
- —
- Est. flood insurance / yr
- —
Fire risk No data
- Est. fire insurance / yr
- —
Heat risk No data
- Hot days now (above threshold)
- —
- Hot days in 30 yrs
- —
Wind risk No data
- Chance of severe wind over 30 yrs
- —
Air-quality risk No data
- Unhealthy air days now
- —
- Unhealthy air days in 30 yrs
- —
Risk factors via First Street. Map © Google.
Why this score? — see what drove the C+ grade
The composite is a weighted blend of 9 inputs, each scored 0–100. Each bar is that input's sub-score; the figure is the points it added to the 100-point composite (weight × sub-score).
- Cash flow +26.8/30.0
- DSCR +9.2/10.0
- ARV discount +7.6/15.0
- 1% rule +6.9/10.0
- Schools +5.0/10.0
- Livability +3.1/5.0
- Rent growth +2.5/5.0
- Condition / age +2.5/5.0
- Appreciation +0.0/10.0
$1,250,000
🖨 Deal sheet (PDF) 📄 Offer letter ✓ Due diligence
Listing remarks MLS
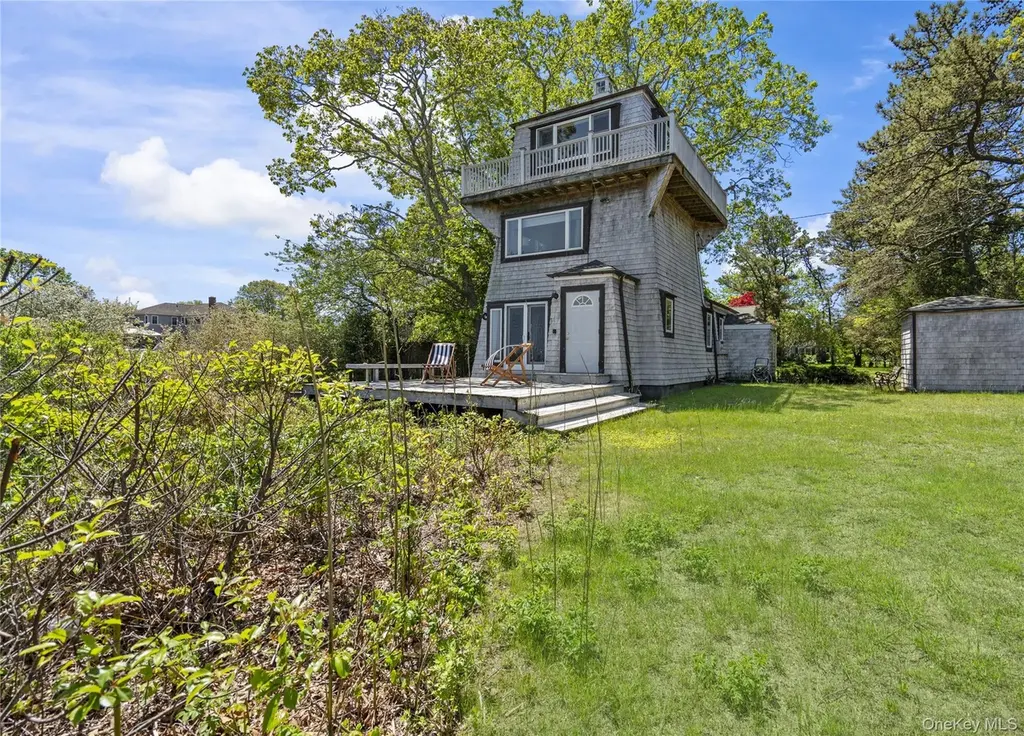
This bold, lighthouse-inspired waterfront home is one-of-a-kind. Located in the coveted East Quogue community, tucked away on a dead-end street overlooking Shinnecock Bay. Perfect as a stylish, income-producing summer getaway or a year-round retreat. Comes with exclusive access to Hampton Point Bay Beach less than a quarter mile up the road. In close proximity to Westhampton Beach/Village so you can enjoy everything the Hamptons has to offer without the hustle and bustle. Features a spacious primary en-suite with walk-in closet and large picture windows facing the bay. The spectacular 3rd floor great room is filled with natural light, offering extra room for lounging and entertaining accompanied by panoramic water views and access to the wraparound upper deck/balcony. Ground floor features 2nd bedroom and 2nd full bathroom, expansive living room with gas fireplace, laundry, and a horseshoe kitchen with breakfast bar flowing into a dining/sitting room combo with more views. French doors open to the deck overlooking the creek and bay. Includes a large 2-car detached garage. Situated on a generous .34 acre lot with room for a pool or expansion.
Key facts
- Waterfront home
- 0.34 acre lot
- 2 garage spots
Tags
Neighborhood map
What this means for you Summary
Snapshot
- This is a 2-bed/2.0-bath single-family listed at $1.25M.
Deal economics
- At list price, monthly cash flow is $3k ($41k/yr) — positive.
- The deal already cash-flows at list — no discount required.
- Meets the 1% rule at list price ($15k rent vs $1.25M).
- Recommended offer: $1.14M (9.0% below list) — sets the bar for market timing.
Location & tenants
- Location reads 61/100 on livability (#943 in NY) — a middle-class / working-renter tenant base. Strengths: crime A+, employment A+; Watch: amenities F, commute F, cost of living F.
- East Quogue Union Free School District (suburban): math 55% / reading 50% proficiency, ranked #342 of 755 in NY (top 45%) — acceptable for families but not a draw, mixed tenant base, ~2y average lease; only 15% free/reduced lunch — higher-income household profile.
- Zoned schools: East Quogue School (math 57% / reading 62%, grade B-, #745 of 2,108 statewide, top 39%, 355 students, 31% FRL) — zoned schools average 31% FRL vs 15% district-wide (16 pts higher); higher-poverty schools than district average — tighter screening recommended.
- Market conditions: 75 active listings in the ZIP; 5 comparable units currently listed for rent nearby; rentals at typical pace (median 26d on market — plan ~3-4 weeks tenant-placement turnaround); 40% of comp listings sitting > 30 days — soft ceiling on asking rent; 1,366 units permitted in Suffolk County in 2024 (216 in 5+ unit buildings).
Forward outlook
- Local home prices are declining (-3.0%/yr); year-one equity from $9k of loan paydown is wiped out by about $38k of value loss. Plan a longer hold.
- Suffolk County population projected to shrink 5% by 2050 — rents likely to lag national; underwrite the cash flow, not the appreciation.
- At projected returns (-3.0% appreciation + 3.0% rent growth), your $350k cash investment doubles in ~10 years — after that, you're playing with house money.
Negotiation context
- It's been on market 104 days — a 9% lower offer ($1.14M) is reasonable based on typical stale-listing flexibility.
- 12 sale attempts since 5y ago with the ask held roughly flat each time — persistent listings suggest the price (not the market) is what's stuck; bring a comps-based counter.
- Current owner paid $1000k; 25% above their basis — modest negotiation headroom, anchor on the comps not their cost.
Risks & watch-outs
- Watch-outs: built in 1957 — expect roof / HVAC / electrical / plumbing capex.
Questions for the listing agent
- It's been on market 104 days. Have you received any prior offers? Is the seller open to a 9% concession, seller financing, or rate buy-down credit?
- Built in 1957 — when were the roof, HVAC, electrical panel, plumbing, and water heater last replaced?
- What does the HOA fee cover, when was the last increase, and are there any pending special assessments or reserve-fund shortfalls?
- Why hasn't it sold? Are there any deal-killer items the seller is aware of (foundation, flood, title, zoning, code violations)?
- Is there a deadline driving the sale (1031 exchange, divorce, estate, relocation)? That informs how much negotiation room exists.
- Schools are B-rated — typically a magnet for longer-tenancy family renters. What's the average tenant stay here, and is there a school-zone premium baked into asking?
- What's the average days-on-market for RENTAL listings here right now (not sales)? A rising rental-DOM trend means longer vacancies and softer asking-rent achievability than the comps imply.
- What's the recent tenant-quality profile in this submarket — average credit score on applications, eviction rate, late-payment / NSF rate, and stable-employment percentage? A property-management company in the area should have these aggregated.
- How much new for-sale + rental construction is in the pipeline within 1–3 miles? Heavy new supply typically softens prices + rents 12–24 months out; constrained supply supports both.
Investment metrics
- 1% rule
- 1.19% ✓
- Cap rate
- 9.58%
- Cash-on-cash
- 11.72%
- DSCR
- 1.52
- GRM
- 7.0
CMA / ARV
- ARV (median comp)
- $1,252,550
- List price
- $1,250,000
- Delta
- -0.20%
- Verdict
- FAIR
- Comps
- 11 within 1.0 mi
Show comp detail 4 sales within ~0.75 mi
| Address | Dist | Beds/Ba | Sqft | Sold | Price | $/sf | Match |
|---|---|---|---|---|---|---|---|
| 15 Bayside Ave | 0.17mi | 3/2.5 (+1) | 1,600 (-9%) | 10mo | $1,749,000 | $1,093 | 62 |
| 5 Argyle Rd | 0.12mi | 3/2.0 (+1) | 1,500 (-14%) | 6mo | $1,085,000 | $723 | 60 |
| 13 West End Ave | 0.37mi | 3/2.0 (+1) | 1,987 (+14%) | 5mo | $840,000 | $423 | 52 |
| 647 Montauk Hwy | 0.45mi | 3/2.5 (+1) | 1,936 (+11%) | 6mo | $840,000 | $434 | 49 |
Match score weights: distance 35% · size 25% · config 20% · recency 20%. Top-matched comps best support the ARV.
Projected returns pro-forma
-3.0% appreciation · 3.0% rent growth · sell at horizon
- IRR
- 1.1%
- Equity multiple
- 1.04×
- Total profit
- $15,221
- Equity at exit
- $186,379
- IRR
- 10.8%
- Equity multiple
- 1.84×
- Total profit
- $293,728
- Equity at exit
- $108,077
Cash invested: $350,000 (down + closing). Projections, not guarantees.
Landlord ↔ Tenant lean methodology
- Overall (STATE)
- 15 Strongly Tenant-Friendly
- State New York
- 15 Strongly Tenant-Friendly · D+10
- County
- — inherits STATE
- City
- — inherits STATE
ZIP-level market 11942
- Home prices YoY
- -25.0%
- Active inventory
- 75
- Price-to-rent
- 7.0×
Monthly cashflow live
- Estimated rent
- $14,842 medium interval (Pro) →
- Mortgage (P&I)
- −$6,555
- Tax from tax record
- −$1,213 /mo · $14,555/yr
- Insurance
- −$521
- HOA
- −$17
- Vacancy / Maint / Mgmt
- −$3,117
- Net cashflow
- $3,419
Break-even live
Sensitivity live
| Price | -10% $4,127 | -5% $3,773 | +0% $3,419 | +5% $3,065 | +10% $2,711 |
|---|---|---|---|---|---|
| Rent | -10% $2,246 | -5% $2,833 | +0% $3,419 | +5% $4,005 | +10% $4,591 |
| Rate | -1.0pp $4,048 | -0.5pp $3,737 | base $3,419 | +0.5pp $3,095 | +1.0pp $2,766 |
UW: 25.0% down · 7.5% · 30yr · 1.5% tax · 5.0% vac · 8.0% maint · 8.0% mgmt
Financing live
Cash to close
- Down payment
- $312,500
- Closing costs
- $37,500
- Reserves months
- —
- Total cash needed
- —
Loan-product check · same deal, 3 products live
Conventional
25% down · 7.5% · 30yr
- Down + closing
- —
- Monthly P&I
- —
- Monthly cashflow
- —
- DSCR
- —
- Eligible?
- —
Personal DTI + credit; lowest rate.
DSCR
20% down · 8.5% · 30yr
- Down + closing
- —
- Monthly P&I
- —
- Monthly cashflow
- —
- DSCR
- —
- Eligible?
- —
No personal income docs; deal must DSCR.
Hard money
10% down · 12.0% · 12mo
- Down + closing
- —
- Monthly P&I
- —
- Monthly cashflow
- —
- DSCR
- —
- Eligible?
- —
Short-term bridge; refi at stabilization.
Rent comps 5 comps
| Address | Beds | Baths | Sqft | Rent | $/sqft | DOM | Units | Dist |
|---|---|---|---|---|---|---|---|---|
| 22 W End Ave East Quogue, NY | 3.0 | 2.0 | 1368 | $16,000 | $11.70 | 7d | 1 | 0.27mi |
| 30 Vail Ave East Quogue, NY | 3.0 | 2.0 | 1260 | $38,500 | $30.56 | 26d | 1 | 0.75mi |
| 85 Lewis Rd East Quogue, NY | 3.0 | 2.0 | 1593 | $4,450 | $2.79 | 45d | 1 | 1.20mi |
| 20 Marlin Rd East Quogue, NY | 3.0 | 2.0 | 2000 | $10,000 | $5.00 | 45d | 1 | 1.24mi |
| 24 Quogue Riverhead Rd Quogue, NY | 3.0 | 3.0 | 2054 | $15,000 | $7.30 | 26d | 1 | 1.32mi |
HOA detail
- Monthly dues
- $17 · $204/yr
- Likely covers
- watergaspool
Listing history 47 events
-
2026-06-21days on market $1,250,000 Active 104 DOM
-
2026-06-18days on market $1,250,000 Active 101 DOM
-
2026-06-17days on market $1,250,000 Active 100 DOM
-
2026-06-16days on market $1,250,000 Active 99 DOM
-
2026-06-15days on market $1,250,000 Active 98 DOM
-
2026-06-13days on market $1,250,000 Active 96 DOM
-
2026-06-13days on market $1,250,000 Active 95 DOM
-
2026-06-09days on market $1,250,000 Active 92 DOM
-
2026-06-08days on market $1,250,000 Active 91 DOM
-
2026-06-07days on market $1,250,000 Active 90 DOM
-
2026-06-04days on market $1,250,000 Active 87 DOM
-
2026-06-03days on market $1,250,000 Active 86 DOM
-
2026-06-02days on market $1,250,000 Active 85 DOM
-
2026-06-01days on market $1,250,000 Active 84 DOM
-
2026-05-31days on market $1,250,000 Active 83 DOM
-
2026-03-14historical $4,500
-
2026-03-07$1,250,000 Active 1160-char remark
Show marketing remark (1160 chars)
This bold, lighthouse-inspired waterfront home is one-of-a-kind. Located in the coveted East Quogue community, tucked away on a dead-end street overlooking Shinnecock Bay. Perfect as a stylish, income-producing summer getaway or a year-round retreat. Comes with exclusive access to Hampton Point Bay Beach less than a quarter mile up the road. In close proximity to Westhampton Beach/Village so you can enjoy everything the Hamptons has to offer without the hustle and bustle. Features a spacious primary en-suite with walk-in closet and large picture windows facing the bay. The spectacular 3rd floor great room is filled with natural light, offering extra room for lounging and entertaining accompanied by panoramic water views and access to the wraparound upper deck/balcony. Ground floor features 2nd bedroom and 2nd full bathroom, expansive living room with gas fireplace, laundry, and a horseshoe kitchen with breakfast bar flowing into a dining/sitting room combo with more views. French doors open to the deck overlooking the creek and bay. Includes a large 2-car detached garage. Situated on a generous .34 acre lot with room for a pool or expansion.
-
2026-02-02historical
-
2025-09-19status Active
-
2025-09-16historical
-
2025-09-11$4,500
-
2025-05-12$1,350,000 Active
-
2025-05-02historical
-
2025-02-18historical
-
2025-01-01historical $4,750
-
2024-12-31$1,375,000 Active
-
2024-12-30historical
-
2024-12-05$1,375,000 Active
-
2024-11-26$4,750
-
2024-11-26historical $4,750
-
2024-11-12price $4,750
-
2024-09-12$5,250
-
2024-07-10historical
-
2024-02-05$1,395,000 Active
-
2023-10-02historical $16,000
-
2023-07-16$16,000
-
2023-02-06soldstatus $999,999
-
2022-11-29soldstatus $999,999 Closed
-
2022-11-29soldstatus $999,999
-
2022-07-01status Pending
-
2022-05-28price $999,999
-
2022-04-04price $1,150,000
-
2022-03-22historical
-
2021-09-21$1,250,000 Active
-
2021-09-18historical
-
2021-09-17$1,250,000 Active
-
1985-09-24soldstatus $212,000
ⓘ Source: listings_history table (triggers on properties + properties_extension) + one-shot
backfill from property_details.listing_events for pre-trigger history.
Tax reassessment forecast NY · Partial reset (capped growth)
- Current annual tax
- $14,555 · $1,213/mo
- Projected year-2 tax
- $17,840 · $1,487/mo
- Expected delta
- +$3,285/yr (+$274/mo · 22.6%)
ⓘ Screening estimate from a state-policy table — verify with the county assessor before closing.
Nearby sold comps map
Loading sold comps map…
Walkable amenities ~0.75 mi
Loading nearby amenities…
Taxation est. · year 1
- Rental income
- $178,099
- − Mortgage interest
- −$70,019
- − Property taxes
- −$14,555
- − Insurance
- −$6,250
- − Repairs & maintenance
- −$14,248
- − Management
- −$14,248
- − HOA
- −$204
- − Depreciation
- −$36,364
- Taxable income
- $22,211
- Est. tax owed @ 24.0%
- −$5,331
- After-tax cash flow
- $35,697/yr
For passive investors: Depreciation is non-cash, so a rental often shows a tax loss while cash-flowing — sheltering income. Rental losses are passive: they offset passive income freely, and up to $25,000/yr can offset ordinary (W-2) income if you actively participate and your MAGI is under $100k (phasing out to $0 by $150k); unused losses carry forward. On sale, claimed depreciation is recaptured at up to 25%, and gains may owe capital-gains tax (a 1031 exchange can defer both). Figures are a year-1 estimate at your 24.0% rate — not tax advice; consult a CPA.
Schools (NCES district)
- District
- East Quogue Union Free School District
- NCES district ID
- 3609900
- Math proficiency
- 55% ▬ 0.00%
- Reading proficiency
- 50% ▲ 5.00%
- Median HH income
- $81,457
- Composite
- 49.79/100
- National rank
- #4207
- State rank
- #342 of 755 in NY
Livability — East Quogue
- Score
- 61/100
- State rank
- #943
- US rank
- #18348
Category grades
Schools grade is shown separately in the Schools card above.
Census & demographics
- Census place
- East Quogue, NY
- City population
- 5,871
- Population (ZIP)
- 5,871
Population outlook (Suffolk County) Hauer SSP2
- Today (2025)
- 1,505,262 people
- By 2030
- 1,498,318 · -0.5%
- By 2040
- 1,471,101 · -2.3%
- By 2050
- 1,424,848 · -5.3%
- By 2075
- 1,337,157 · -11.2%
- By 2100
- 1,217,720 · -19.1%
Race, ethnicity, and origin ACS 2023
- Neighborhood character
- Predominantly White (80%)
- Race & ethnicity
- White 80% Hispanic / Latino 16% Asian 2% Two or more races 2%
- Hispanic origin (detail)
- Mexican 3%
- Common ancestry
- Romanian 6% Scotch-Irish 3% Lithuanian 3%
- Foreign-born
- 13% · Canada, Jamaica, Guatemala
- Languages at home
- 80% English-only · Spanish 12% Other Indo-European 2% Russian/Polish/Slavic 2%
Political lean MEDSL · Suffolk
- 2024 margin
- Lean R (+10.0) · D 45.0% · R 55.0%
- 2008→2024 swing
- -16.0pp toward R · 2008: 6.0pp · 2024: -10.0pp
- All cycles
- 2024: R+10.0 2020: R+0.0 2016: R+8.2 2012: D+2.9 2008: D+6.0
Not yet ingested
- Civics
- —
Market trends
- HPI YoY
- ▼ -145.33%
- Current HPI
- 435.8017
- Rent YoY
- —
- Metro
- —
- State GDP YoY
- ▲ 2.60%
- F500 in state
- 92
Industry mix (Fortune 500 HQ in NY)
| Industry | F500 HQs | Revenue |
|---|---|---|
| Financial Services | 10 | $950B |
|
||
| Consumer Goods | 9 | $162B |
|
||
| Insurance | 4 | $225B |
|
||
| Telecommunications | 2 | $144B |
|
||
| Pharmaceuticals | 2 | $112B |
|
||
| Media / Entertainment | 2 | $69B |
|
||
Price history
-97.9% since first listed32 events — show timeline
- 2026-03-14 Rental Removed $4,500 ONEKEY
- 2026-03-07 Listed $1,250,000 OneKey® MLS as Distributed by MLS Grid
- 2026-02-02 Listing Removed — OneKey® MLS as Distributed by MLS Grid
- 2025-09-19 Relisted — OneKey® MLS as Distributed by MLS Grid
- 2025-09-16 Listing Removed — OneKey® MLS as Distributed by MLS Grid
- 2025-09-11 Listed for Rent $4,500 ONEKEY
- 2025-05-12 Listed $1,350,000 OneKey® MLS as Distributed by MLS Grid
- 2025-05-02 Listing Removed — OneKey® MLS as Distributed by MLS Grid
- 2025-02-18 Listing Removed — OneKey® MLS as Distributed by MLS Grid
- 2025-01-01 Rental Removed $4,750 ONEKEY
- 2024-12-31 Listed $1,375,000 OneKey® MLS as Distributed by MLS Grid
- 2024-12-30 Coming Soon — OneKey® MLS as Distributed by MLS Grid
- 2024-12-05 Listed $1,375,000 OneKey® MLS as Distributed by MLS Grid
- 2024-11-26 Listed for Rent $4,750 ONEKEY
- 2024-11-26 Rental Removed $4,750 ONEKEY
- 2024-11-12 Price Changed $4,750 ONEKEY
- 2024-09-12 Listed for Rent $5,250 ONEKEY
- 2024-07-10 Listing Removed — OneKey® MLS as Distributed by MLS Grid
- 2024-02-05 Listed $1,395,000 OneKey® MLS as Distributed by MLS Grid
- 2023-10-02 Rental Removed $16,000 ONEKEY
- 2023-07-16 Listed for Rent $16,000 ONEKEY
- 2023-02-06 Sold (Public Records) $999,999 Public Records
- 2022-11-29 Sold (Public Records) $999,999 Public Records
- 2022-11-29 Sold (MLS) $999,999 OneKey® MLS as Distributed by MLS Grid
- 2022-07-01 Pending — OneKey® MLS as Distributed by MLS Grid
- 2022-05-28 Price Changed $999,999 OneKey® MLS as Distributed by MLS Grid
- 2022-04-04 Price Changed $1,150,000 OneKey® MLS as Distributed by MLS Grid
- 2022-03-22 Listing Removed — OneKey® MLS as Distributed by MLS Grid
- 2021-09-21 Listed $1,250,000 OneKey® MLS as Distributed by MLS Grid
- 2021-09-18 Coming Soon — OneKey® MLS as Distributed by MLS Grid
- 2021-09-17 Listed $1,250,000 OneKey® MLS as Distributed by MLS Grid
- 1985-09-24 Sold (Public Records) $212,000 Public Records
Property tax history
+1.5%/yrLatest (2024): $14,555 · +0.0% YoY. Source: county tax records.
Cash-flow waterfall
monthlySold comps — $/sqft
last 12 mo · ≤1 miLoading sold comps…