 🏢 Co-op
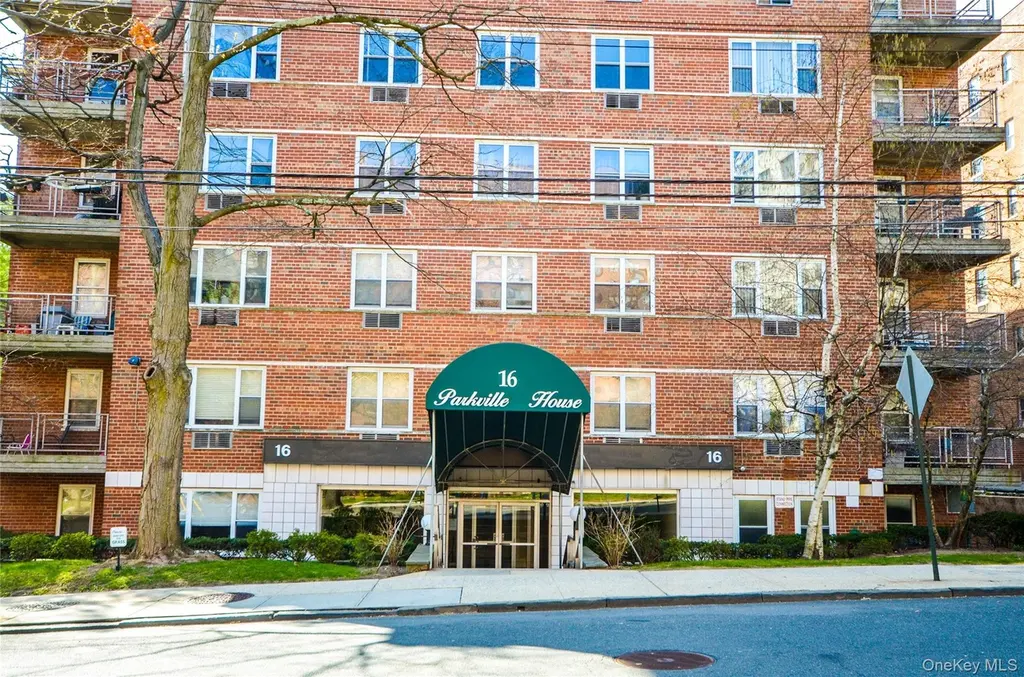
16 Lake St Unit 6A · White Plains, NY
Flood risk 1/10 · Minimal
- FEMA flood zone
- X (unshaded)
- Chance of flooding over 30 yrs
- 0.0%
- Est. flood insurance / yr
- $507 – $1,088
Fire risk 4/10 · Minor
- Est. fire insurance / yr
- $691 – $1,283
Heat risk 6/10 · Moderate
- Hot days now (above 98°F)
- 7 days/yr
- Hot days in 30 yrs
- 15 days/yr
Wind risk 6/10 · Moderate
- Chance of severe wind over 30 yrs
- 27.0%
Air-quality risk 4/10 · Minor
- Unhealthy air days now
- 3 days/yr
- Unhealthy air days in 30 yrs
- 5 days/yr
Risk factors via First Street. Map © Google.
Why this score? — see what drove the B- grade
The composite is a weighted blend of 9 inputs, each scored 0–100. Each bar is that input's sub-score; the figure is the points it added to the 100-point composite (weight × sub-score).
- Cash flow +30.0/30.0
- DSCR +10.0/10.0
- 1% rule +8.6/10.0
- Schools +4.7/10.0
- ARV discount +3.8/15.0
- Livability +3.6/5.0
- Rent growth +2.5/5.0
- Condition / age +2.5/5.0
- Appreciation +0.0/10.0
$265,000
🖨 Deal sheet 📄 Offer letter ✓ Due diligence
Listing remarks
Beautiful co-op apartment located in the center of downtown White Plains. Short distance to metro north, park , restaurants , and shopping. Nice kitchen with granite countertop and stainless steel appliances. Living room has wood flooring and crown molding with access to a nice balcony , and dinning area. Nice big bedroom with build in closets another bedroom with closet. Hall bath with vanity. Laundry is on the same floor.
Key facts
- Garage
- Built 1966
- Listed 44 days
Property features AI
Finance
- HOA & community: Building has elevator(s); Live-in superintendent
Exterior
- Parking: Off-site parking (waitlist); 1 garage space
- Utilities: Public sewer; Cable available; Electricity connected; Sewer connected; Water connected
- Home design: Stock cooperative; Located on 6th floor or higher
- Construction: Brick and other construction; Other foundation
- Exterior features: Balcony
Interior
- Kitchen: Dishwasher; Oven; Range; Refrigerator
- Bedrooms: Entry level: 6
- Bathrooms: 1 full bathroom
- Heating & cooling: Hot water heating; Natural gas heating; Radiant heating; Other heating; No cooling
- Interior features: Open floor plan; Eat-in kitchen; Balcony
- Laundry & utility: Separate laundry room
Neighborhood map
What this means for you Summary
Snapshot
- This is a 2-bed/1.0-bath condo listed at $265k.
Deal economics
- At list price, monthly cash flow is $1k ($12k/yr) — positive.
- The deal already cash-flows at list — no discount required.
- Meets the 1% rule at list price ($4k rent vs $265k).
- Recommended offer: $257k (3.0% below list) — sets the bar for market timing.
- Cap rate 10.9% vs local median 4.3% in White Plains — top-decile yield for the area; either an underpriced asset or a hidden risk that comps aren't pricing in. Stress-test before assuming the spread holds.
Location & tenants
- Location reads 71/100 on livability (#410 in NY) — a middle-class / working-renter tenant base. Strengths: commute A+, employment A+, crime A-; Watch: amenities F, cost of living F.
- White Plains City School District (urban): math 49% / reading 54% proficiency, ranked #313 of 590 in NY (top 53%) — acceptable for families but not a draw, mixed tenant base, ~2y average lease.
- Zoned schools: White Plains Middle School (math 36% / reading 53%, grade D, #348 of 729 statewide, top 50%, 1,517 students, 50% FRL); White Plains Senior High School (math 89% / reading 67%, grade A-, #577 of 1,100 statewide, top 52%, 2,220 students, 53% FRL).
- Market conditions: 111 active listings in the ZIP; 40 comparable units currently listed for rent nearby; rentals at typical pace (median 24d on market — plan ~3-4 weeks tenant-placement turnaround); 42% of comp listings sitting > 30 days — soft ceiling on asking rent; 954 units permitted in Westchester County in 2024 (649 in 5+ unit buildings).
Forward outlook
- Local home prices are declining (-3.0%/yr); year-one equity from $2k of loan paydown is wiped out by about $8k of value loss. Plan a longer hold.
- Westchester County population projected at +10% by 2050 — modest demand growth; plan on rents tracking national, not racing it.
- At projected returns (-3.0% appreciation + 3.0% rent growth), your $74k cash investment doubles in ~8 years — after that, you're playing with house money.
Negotiation context
- It's been on market 44 days — a 3% lower offer ($257k) is reasonable based on typical stale-listing flexibility.
- 8 sale attempts since 16y ago with the ask held roughly flat each time — persistent listings suggest the price (not the market) is what's stuck; bring a comps-based counter.
- Current owner paid $97k; list at $265k implies a 173% gain — meaningful room to come down on a strong offer.
Risks & watch-outs
- Climate carrying-cost: major wind risk, 27% chance of damaging wind over 30y; extreme-heat days projected 7→15/yr by 2055 (HVAC capex compounding) — expect insurance premiums to compound above CPI over the hold.
Questions for the listing agent
- It's been on market 44 days. Have you received any prior offers? Is the seller open to a 3% concession, seller financing, or rate buy-down credit?
- Built in 1966 — when were the roof, HVAC, electrical panel, plumbing, and water heater last replaced?
- Any open or pending special assessments — roof, HVAC, plumbing, elevator, façade? What's the per-unit balance and payoff schedule, and is the seller paying it off at close or rolling it to the buyer?
- Is there a deadline driving the sale (1031 exchange, divorce, estate, relocation)? That informs how much negotiation room exists.
- What's the average days-on-market for RENTAL listings here right now (not sales)? A rising rental-DOM trend means longer vacancies and softer asking-rent achievability than the comps imply.
- What's the recent tenant-quality profile in this submarket — average credit score on applications, eviction rate, late-payment / NSF rate, and stable-employment percentage? A property-management company in the area should have these aggregated.
- How much new apartment / multifamily construction is in the pipeline within 1–3 miles? Heavy new supply (>2% of stock underway) typically softens rents 12–24 months out; light construction supports rent growth.
Investment metrics
- 1% rule
- 1.36% ✓
- Cap rate
- 10.92%
- Cash-on-cash
- 16.52%
- DSCR
- 1.74
- GRM
- 6.1
CMA / ARV
- ARV (median comp)
- $245,000
- List price
- $265,000
- Delta
- 8.16%
- Verdict
- FAIR
- Comps
- 20 within 1.0 mi
Projected returns pro-forma
-3.0% appreciation · 3.0% rent growth · sell at horizon
- IRR
- 7.6%
- Equity multiple
- 1.30×
- Total profit
- $22,180
- Equity at exit
- $39,512
- IRR
- 16.9%
- Equity multiple
- 2.39×
- Total profit
- $103,318
- Equity at exit
- $22,912
Cash invested: $74,200 (down + closing). Projections, not guarantees.
Landlord ↔ Tenant lean methodology
- Overall (STATE)
- 15 Strongly Tenant-Friendly
- State New York
- 15 Strongly Tenant-Friendly · D+10
- County
- — inherits STATE
- City
- — inherits STATE
ZIP-level market 10603
- Home prices YoY
- -24.2%
- Active inventory
- 111
- Price-to-rent
- 6.1×
Monthly cashflow live
- Estimated rent
- $3,611 high interval (Pro) →
- Mortgage (P&I)
- −$1,390
- Tax est. 1.5%
- −$331 /mo · $3,975/yr
- Insurance
- −$110
- HOA
- −$0
- Vacancy / Maint / Mgmt
- −$758
- Net cashflow
- $1,022
Break-even live
UW: 25.0% down · 7.5% · 30yr · 1.5% tax · 5.0% vac · 8.0% maint · 8.0% mgmt
Financing live
Cash to close
- Down payment
- $66,250
- Closing costs
- $7,950
- Reserves months
- —
- Total cash needed
- —
Loan-product check · same deal, 3 products live
Conventional
25% down · 7.5% · 30yr
- Down + closing
- —
- Monthly P&I
- —
- Monthly cashflow
- —
- DSCR
- —
- Eligible?
- —
Personal DTI + credit; lowest rate.
DSCR
20% down · 8.5% · 30yr
- Down + closing
- —
- Monthly P&I
- —
- Monthly cashflow
- —
- DSCR
- —
- Eligible?
- —
No personal income docs; deal must DSCR.
Hard money
10% down · 12.0% · 12mo
- Down + closing
- —
- Monthly P&I
- —
- Monthly cashflow
- —
- DSCR
- —
- Eligible?
- —
Short-term bridge; refi at stabilization.
Rent comps 40 comps
| Address | Beds | Baths | Sqft | Rent | $/sqft | DOM | Units | Dist |
|---|---|---|---|---|---|---|---|---|
| 7 Lake St Unit 8k White Plains, NY | 2.0 | 1.0 | 975 | $3,150 | $3.23 | 44d | 1 | 0.07mi |
| 440 Hamilton Ave White Plains, NY | 2.0 | 1.0–2.0 | 880 | $5,554 | $6.31 | 1d | 31 | 0.11mi |
| 21 Lake St Unit 6G White Plains, NY | 1.0 | 1.0 | 806 | $2,650 | $3.29 | 43d | 1 | 0.11mi |
| 312 Main St Apt 2 E White Plains, NY | 1.0 | 1.0 | 800 | $2,450 | $3.06 | 13d | 1 | 0.12mi |
| 30 Lake St Apt 2I White Plains, NY | 2.0 | 1.0 | 950 | $3,100 | $3.26 | 5d | 1 | 0.12mi |
| 300 Main St White Plains, NY | 1.0 | 1.0 | 956 | $2,825 | $2.95 | 22d | 2 | 0.13mi |
| 37 Lake St White Plains, NY | 1.0–2.0 | 1.0 | 685 | $3,240 | $4.73 | 43d | 1 | 0.17mi |
| 1 S Broadway Apt 1L White Plains, NY | 2.0 | 1.0 | 1000 | $2,950 | $2.95 | 43d | 1 | 0.18mi |
| 42 Barker Ave Unit 4C White Plains, NY | 1.0 | 1.0 | 800 | $2,300 | $2.88 | 43d | 1 | 0.20mi |
| 7-11 S Broadway White Plains, NY | 1.0 | 1.0 | 746 | $3,295 | $4.42 | 13d | 1 | 0.20mi |
| 37 Lake St Unit 2B White Plains, NY | 2.0 | 1.0 | 721 | $3,140 | $4.36 | 20d | 1 | 0.20mi |
| 17 Terrace Ave White Plains, NY | 2.0 | 1.0 | 980 | $3,500 | $3.57 | 24d | 1 | 0.22mi |
| 55 N Broadway Unit 3-15H White Plains, NY | 2.0 | 2.5 | 1310 | $3,850 | $2.94 | 43d | 1 | 0.25mi |
| 10 City Pl Unit 2D White Plains, NY | 1.0 | 1.5 | 1069 | $3,895 | $3.64 | 15d | 1 | 0.28mi |
| 240 Martine Ave Apt 4G White Plains, NY | 3.0 | 2.0 | 1460 | $4,195 | $2.87 | 43d | 1 | 0.31mi |
| 234 Martine Ave White Plains, NY | 3.0 | 2.0 | 1460 | $4,195 | $2.87 | 24d | 1 | 0.31mi |
| 1 Renaissance Sq Unit 7B White Plains, NY | 1.0 | 1.5 | 1048 | $5,500 | $5.25 | 43d | 1 | 0.32mi |
| 51 S Broadway White Plains, NY | 1.0 | 1.0 | 752 | $3,342 | $4.44 | 3d | 2 | 0.36mi |
| 131 Mamaroneck Ave White Plains, NY | 3.0 | 1.0–2.0 | 974 | $5,355 | $5.50 | 1d | 19 | 0.41mi |
| 108 N Kensico AVE Unit 5A | 2.0 | 1.5 | 950 | $3,400 | $3.58 | 24d | 1 | 0.43mi |
| 1 Lyon Pl Unit 907 White Plains, NY | 2.0 | 2.0 | 1120 | $4,555 | $4.07 | 3d | 1 | 0.45mi |
| 10 Lyon Pl White Plains, NY | 2.0 | 1.0–2.0 | 870 | $4,375 | $5.03 | 43d | 17 | 0.48mi |
| 100 Hale Ave White Plains, NY | 2.0 | 1.0–2.0 | 908 | $4,961 | $5.46 | 1d | 11 | 0.49mi |
| 26 Hillside Ter Unit F White Plains, NY | 1.0 | 1.0 | 782 | $2,700 | $3.45 | 43d | 1 | 0.51mi |
| 1 DeKalb Ave White Plains, NY | 1.0 | 1.0 | 749 | $3,390 | $4.53 | 43d | 1 | 0.52mi |
| 42 Waller Ave White Plains, NY | 2.0 | 1.0 | 1150 | $3,300 | $2.87 | 43d | 1 | 0.53mi |
| 115 N Broadway White Plains, NY | 2.0 | 2.5 | 1450 | $3,750 | $2.59 | 43d | 1 | 0.54mi |
| 125 Lake St Unit 6BN White Plains, NY | 2.0 | 2.0 | 975 | $3,050 | $3.13 | 44d | 1 | 0.54mi |
| 125 Lake St Unit 12NN White Plains, NY | 2.0 | 1.0 | 850 | $2,700 | $3.18 | 43d | 1 | 0.54mi |
| 25 N Lexington Ave White Plains, NY | 3.0 | 1.0–2.0 | 988 | $6,146 | $6.22 | 1d | 28 | 0.58mi |
| 26 Fairview Ave White Plains, NY | 3.0 | 1.5 | 1100 | $3,600 | $3.27 | 43d | 1 | 0.60mi |
| 34 S Lexington Ave White Plains, NY | 1.0–2.0 | 1.0–2.0 | 871 | $4,195 | $4.82 | 5d | 6 | 0.61mi |
| 28 Beechwood Ave West Harrison, NY | 3.0 | 1.0 | 1239 | $4,800 | $3.87 | 17d | 1 | 0.63mi |
| 4 Martine Ave White Plains, NY | 1.0 | 1.0 | 707 | $2,750 | $3.89 | 2d | 1 | 0.64mi |
| 4 Martine Ave White Plains, NY | 1.0 | 1.0–1.5 | 773 | $2,850 | $3.69 | 13d | 2 | 0.64mi |
| 4 Martine Ave White Plains, NY | 1.0 | 1.0–1.5 | 773 | $3,025 | $3.91 | 19d | 2 | 0.64mi |
| 4 Martine Ave White Plains, NY | 1.0 | 1.0–1.5 | 773 | $2,900 | $3.75 | 43d | 2 | 0.64mi |
| 1 Martine Ave White Plains, NY | 1.0–2.0 | 1.0–2.0 | 827 | $4,295 | $5.19 | 2d | 12 | 0.66mi |
| 250 Mamaroneck Ave White Plains, NY | 1.0–3.0 | 1.0–2.5 | 1298 | $7,098 | $5.47 | 1d | 126 | 0.66mi |
| 15 Bank St White Plains, NY | 1.0–2.0 | 1.0–2.0 | 934 | $5,064 | $5.42 | 1d | 20 | 0.68mi |
HOA detail condo
- Monthly dues
- $0 · $0/yr
- Assessments
- None detected in remarks — confirm with the listing agent.
Listing history 38 events
-
2026-06-18days on market $265,000 Active 44 DOM
-
2026-06-17days on market $265,000 Active 43 DOM
-
2026-06-16days on market $265,000 Active 42 DOM
-
2026-06-15days on market $265,000 Active 41 DOM
-
2026-06-13days on market $265,000 Active 39 DOM
-
2026-06-13days on market $265,000 Active 38 DOM
-
2026-06-09days on market $265,000 Active 35 DOM
-
2026-06-08days on market $265,000 Active 34 DOM
-
2026-06-07days on market $265,000 Active 33 DOM
-
2026-06-04days on market $265,000 Active 30 DOM
-
2026-06-03days on market $265,000 Active 29 DOM
-
2026-06-02days on market $265,000 Active 28 DOM
-
2026-06-01days on market $265,000 Active 27 DOM
-
2026-05-31days on market $265,000 Active 26 DOM
-
2026-05-04$265,000 Active 426-char remark
-
2025-04-02$299,000 Active
-
2025-01-05historical
-
2024-08-23price $290,000
-
2024-07-04$299,000 Active
-
2024-06-18historical
-
2024-02-09$299,000 Active
-
2017-04-21soldstatus $97,000 Sold
-
2017-02-07historical Pending
-
2017-01-08price $104,900
-
2016-12-07price $129,900
-
2016-10-08$149,000 Active
-
2011-06-30historical
-
2011-06-21price
-
2011-06-17price
-
2011-04-12price
-
2011-02-03Active
-
2011-02-01historical
-
2011-01-17price
-
2010-11-01Active
-
2010-10-01historical
-
2010-06-25price
-
2010-04-28price
-
2010-03-30Active
ⓘ Source: listings_history table (triggers on properties + properties_extension) + one-shot
backfill from property_details.listing_events for pre-trigger history.
Climate risk First Street
- Flood 1/10 Low FEMA zone X (unshaded) · 0% chance over 30 yrs
- Wildfire 4/10 Moderate
- Heat 6/10 Major 7 d/yr ≥98°F today · 15 d/yr by 30 yrs out
- Wind 6/10 Major 27% chance of damaging wind over 30 yrs
- Air quality 4/10 Moderate 3 unhealthy d/yr today · 5 by 30 yrs out
Nearby sold comps map
Loading sold comps map…
Walkable amenities ~0.75 mi
Loading nearby amenities…
Taxation est. · year 1
- Rental income
- $43,336
- − Mortgage interest
- −$14,844
- − Property taxes
- −$3,975
- − Insurance
- −$1,325
- − Repairs & maintenance
- −$3,467
- − Management
- −$3,467
- − Depreciation
- −$7,709
- Taxable income
- $8,549
- Est. tax owed @ 24.0%
- −$2,052
- After-tax cash flow
- $10,207/yr
For passive investors: Depreciation is non-cash, so a rental often shows a tax loss while cash-flowing — sheltering income. Rental losses are passive: they offset passive income freely, and up to $25,000/yr can offset ordinary (W-2) income if you actively participate and your MAGI is under $100k (phasing out to $0 by $150k); unused losses carry forward. On sale, claimed depreciation is recaptured at up to 25%, and gains may owe capital-gains tax (a 1031 exchange can defer both). Figures are a year-1 estimate at your 24.0% rate — not tax advice; consult a CPA.
Schools (NCES district)
- District
- White Plains City School District
- NCES district ID
- 3631260
- Math proficiency
- 49% ▼ -6.00%
- Reading proficiency
- 54% ▲ 2.00%
- Median HH income
- $78,366
- Composite
- 46.72/100
- National rank
- #2397
- State rank
- #313 of 590 in NY
Livability — White Plains
- Score
- 71/100
- State rank
- #410
- US rank
- #6801
Category grades
Schools grade is shown separately in the Schools card above.
Census & demographics
- Census place
- White Plains, NY
- City population
- 61,281
- Population (ZIP)
- 19,201
Population outlook (Westchester County) Hauer SSP2
- Today (2025)
- 1,028,035 people
- By 2030
- 1,051,636 · +2.3%
- By 2040
- 1,098,520 · +6.9%
- By 2050
- 1,136,044 · +10.5%
- By 2075
- 1,196,925 · +16.4%
- By 2100
- 1,175,147 · +14.3%
Race, ethnicity, and origin ACS 2023
- Neighborhood character
- Highly diverse neighborhood (Simpson 0.71)
- Race & ethnicity
- Hispanic / Latino 35% White 34% Black 21% Two or more races 13% Asian 5%
- Hispanic origin (detail)
- Mexican 4% Puerto Rican 7% Dominican 3%
- Common ancestry
- Hispanic 3% Romanian 2% Lithuanian 1%
- Foreign-born
- 33% · Canada, Jamaica, China
- Languages at home
- 55% English-only · Spanish 31% Other Indo-European 8% French/Haitian/Cajun 2%
Political lean MEDSL · Westchester
- 2024 margin
- Strong D (+26.3) · D 63.1% · R 36.9%
- 2008→2024 swing
- -1.3pp toward R · 2008: 27.6pp · 2024: 26.3pp
- All cycles
- 2024: D+26.3 2020: D+36.3 2016: D+32.8 2012: D+22.2 2008: D+27.6
Not yet ingested
- Civics
- —
Market trends
- HPI YoY
- ▼ -101.72%
- Current HPI
- 317.8177
- Rent YoY
- —
- Metro
- —
- State GDP YoY
- ▲ 2.60%
- F500 in state
- 92
Industry mix (Fortune 500 HQ in NY)
| Industry | F500 HQs | Revenue |
|---|---|---|
| Financial Services | 10 | $950B |
|
||
| Consumer Goods | 9 | $162B |
|
||
| Insurance | 4 | $225B |
|
||
| Telecommunications | 2 | $144B |
|
||
| Pharmaceuticals | 2 | $112B |
|
||
| Media / Entertainment | 2 | $69B |
|
||
Price history
+77.9% since first listed24 events — show timeline
- 2026-05-04 Listed $265,000 OneKey® MLS as Distributed by MLS Grid
- 2025-04-02 Listed $299,000 OneKey® MLS as Distributed by MLS Grid
- 2025-01-05 Listing Removed — OneKey® MLS as Distributed by MLS Grid
- 2024-08-23 Price Changed $290,000 OneKey® MLS as Distributed by MLS Grid
- 2024-07-04 Listed $299,000 OneKey® MLS as Distributed by MLS Grid
- 2024-06-18 Listing Removed — OneKey® MLS as Distributed by MLS Grid
- 2024-02-09 Listed $299,000 OneKey® MLS as Distributed by MLS Grid
- 2017-04-21 Sold (MLS) $97,000 OneKey® MLS as Distributed by MLS Grid
- 2017-02-07 Contingent — OneKey® MLS as Distributed by MLS Grid
- 2017-01-08 Price Changed $104,900 OneKey® MLS as Distributed by MLS Grid
- 2016-12-07 Price Changed $129,900 OneKey® MLS as Distributed by MLS Grid
- 2016-10-08 Listed $149,000 OneKey® MLS as Distributed by MLS Grid
- 2011-06-30 Delisted — HGMLS
- 2011-06-21 Price Changed — HGMLS
- 2011-06-17 Price Changed — HGMLS
- 2011-04-12 Price Changed — HGMLS
- 2011-02-03 Listed — HGMLS
- 2011-02-01 Delisted — HGMLS
- 2011-01-17 Price Changed — HGMLS
- 2010-11-01 Listed — HGMLS
- 2010-10-01 Delisted — HGMLS
- 2010-06-25 Price Changed — HGMLS
- 2010-04-28 Price Changed — HGMLS
- 2010-03-30 Listed — HGMLS
Cash-flow waterfall
monthlySold comps — $/sqft
last 12 mo · ≤1 miLoading sold comps…