1348 S Avenida Polar Unit K111 · Tucson, AZ
Flood risk 1/10 · Minimal
- FEMA flood zone
- X (unshaded)
- Chance of flooding over 30 yrs
- 0.0%
- Est. flood insurance / yr
- $507 – $1,088
Fire risk 1/10 · Minimal
- Est. fire insurance / yr
- $610 – $1,132
Heat risk 7/10 · Major
- Hot days now (above 105°F)
- 4 days/yr
- Hot days in 30 yrs
- 11 days/yr
Wind risk 1/10 · Minimal
- Chance of severe wind over 30 yrs
- —
Air-quality risk 1/10 · Minimal
- Unhealthy air days now
- 0 days/yr
- Unhealthy air days in 30 yrs
- 0 days/yr
Risk factors via First Street. Map © Google.
Why this score? — see what drove the C- grade
The composite is a weighted blend of 9 inputs, each scored 0–100. Each bar is that input's sub-score; the figure is the points it added to the 100-point composite (weight × sub-score).
- ARV discount +15.0/15.0
- Cash flow +11.8/30.0
- 1% rule +9.8/10.0
- Livability +3.7/5.0
- DSCR +3.5/10.0
- Rent growth +2.9/5.0
- Condition / age +2.8/5.0
- Schools +1.6/10.0
- Appreciation +0.0/10.0
$70,000
🖨 Deal sheet 📄 Offer letter ✓ Due diligence
Listing remarks
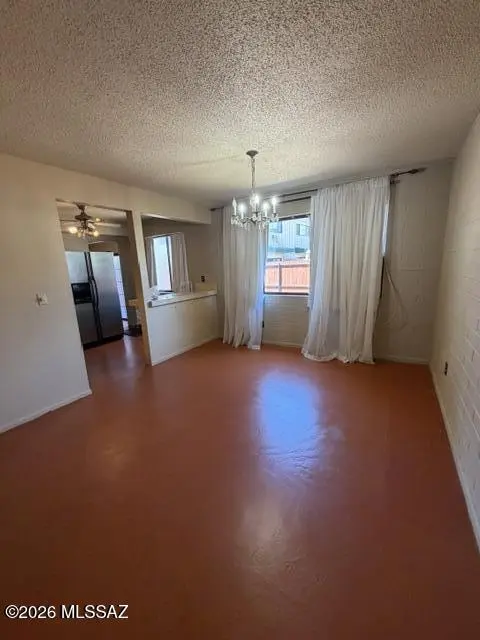
Rare ground-floor 1-bedroom, 1-bath home featuring an enclosed patio and a large, fenced backyard. Concrete floors throughout and an updated bathroom. Ideally located near the community room, pool and hot tub, and convenient parking. The monthly fee includes property taxes, water, trash, sewer, gas, roof, exterior maintenance, pest control, access to the community room, and more. Close to shopping, bus lines, and restaurants. Cash only. No rentals permitted.
Key facts
- Community room
- Pool
- Concrete floors
Tags
Property features AI
Finance
- HOA & community: Association: Oxford Homes; Monthly HOA fee; Community clubhouse; On-site laundry; Community pool and spa/hot tub; HOA covers common area maintenance, exterior unit maintenance, gas, pest control, roof repair/replacement, sewer and water; HOA transfer fee
Exterior
- Security: Wrought iron security door
- Utilities: Public water; Sewer connected
- Home design: Condominium; One story; Facing north
- Construction: Brick construction; Built-up reflective roof
- Exterior features: Enclosed patio/porch; Wood fencing; Paved road access (city-maintained); North/South exposure
Interior
- Kitchen: Refrigerator; Electric range; Electric oven
- Flooring: Concrete floors
- Bathrooms: 1 full bathroom
- Heating & cooling: Wall furnace heating; Evaporative cooling; Window cooling unit(s)
- Interior features: Refrigerator; Electric range and oven
Neighborhood map
What this means for you Summary
Snapshot
- This is a 1-bed/1.0-bath condo listed at $70k. Condition is rated average.
Deal economics
- At list price, monthly cash flow is $-19 ($-231/yr) — negative.
- To cash-flow at today's rent, offer at most $67k (4.0% below list).
- Meets the 1% rule at list price ($1k rent vs $70k).
- Recommended offer: $67k (4.0% below list) — sets the bar for cash-flow.
- Cap rate 6.0% vs local median 3.7% in Tucson — top-decile yield for the area; either an underpriced asset or a hidden risk that comps aren't pricing in. Stress-test before assuming the spread holds.
Location & tenants
- Location reads 74/100 on livability (#17 in AZ, #4,502 nationally) — a middle-class / working-renter tenant base. Strengths: commute A+, cost of living A+, housing A+; Watch: health & safety C-, crime F, employment D-.
- Tucson Unified District (4403) (urban): math 14% / reading 23% proficiency, ranked #190 of 249 in AZ (top 76%) — low school quality limits family demand, transient renter base, plan for 1-2y turnover.
- Zoned schools: Wheeler Elementary School (math 22% / reading 32%, grade F, #600 of 1,109 statewide, top 56%, 416 students, 73% FRL); Palo Verde High Magnet School (math 8% / reading 12%, grade F, #343 of 381 statewide, top 93%, 691 students, 65% FRL).
- Market conditions: Rents rising (+1.6%/yr); 210 active listings in the ZIP; 40 comparable units currently listed for rent nearby; rentals at typical pace (median 24d on market — plan ~3-4 weeks tenant-placement turnaround); 48% of comp listings sitting > 30 days — soft ceiling on asking rent; 5,268 units permitted in Pima County in 2024 (996 in 5+ unit buildings).
Forward outlook
- Local home prices are declining (-3.0%/yr); year-one equity from $484 of loan paydown is wiped out by about $2k of value loss. Plan a longer hold.
- Pima County population projected at +8% by 2050 — modest demand growth; plan on rents tracking national, not racing it.
Negotiation context
- It's been on market 41 days — a 3% lower offer ($68k) is reasonable based on typical stale-listing flexibility.
Risks & watch-outs
- Watch-outs: HOA is 34% of rent.
- Climate carrying-cost: extreme-heat days projected 4→11/yr by 2055 (HVAC capex compounding) — expect insurance premiums to compound above CPI over the hold.
Questions for the listing agent
- What do current leases actually rent for vs. the listed asking? Can we see a recent rent roll and the last 12 months of T-12 income?
- It's been on market 41 days. Have you received any prior offers? Is the seller open to a 4% concession, seller financing, or rate buy-down credit?
- Built in 1964 — when were the roof, HVAC, electrical panel, plumbing, and water heater last replaced?
- What does the HOA fee cover, when was the last increase, and are there any pending special assessments or reserve-fund shortfalls?
- Any open or pending special assessments — roof, HVAC, plumbing, elevator, façade? What's the per-unit balance and payoff schedule, and is the seller paying it off at close or rolling it to the buyer?
- Is there a deadline driving the sale (1031 exchange, divorce, estate, relocation)? That informs how much negotiation room exists.
- Schools are D-rated, which usually means shorter tenancies and higher turnover. Who's the typical renter profile here, and what's been the actual vacancy rate?
- Crime grade is F in this area — have there been break-ins, vandalism, or insurance claims at this property in the last 3 years? What carrier currently insures it and at what premium?
- What's the average days-on-market for RENTAL listings here right now (not sales)? A rising rental-DOM trend means longer vacancies and softer asking-rent achievability than the comps imply.
- What's the recent tenant-quality profile in this submarket — average credit score on applications, eviction rate, late-payment / NSF rate, and stable-employment percentage? A property-management company in the area should have these aggregated.
- How much new apartment / multifamily construction is in the pipeline within 1–3 miles? Heavy new supply (>2% of stock underway) typically softens rents 12–24 months out; light construction supports rent growth.
Investment metrics
- 1% rule
- 1.48% ✓
- Cap rate
- 5.96%
- Cash-on-cash
- -1.18%
- DSCR
- 0.95
- GRM
- 5.6
CMA / ARV
- ARV (median comp)
- $117,547
- List price
- $70,000
- Delta
- -40.45%
- Verdict
- UNDERPRICED
- Comps
- 20 within 1.0 mi
Projected returns pro-forma
-3.0% appreciation · 1.61% rent growth · sell at horizon
- IRR
- -20.6%
- Equity multiple
- 0.30×
- Total profit
- $-13,763
- Equity at exit
- $10,437
- IRR
- -19.3%
- Equity multiple
- 0.07×
- Total profit
- $-18,317
- Equity at exit
- $6,052
Cash invested: $19,600 (down + closing). Projections, not guarantees.
Landlord ↔ Tenant lean methodology
- Overall (STATE)
- 87 Strongly Landlord-Friendly
- State Arizona
- 87 Strongly Landlord-Friendly · R+3
- County
- — inherits STATE
- City
- — inherits STATE
ZIP-level market 85710
- Rents YoY
- 1.6%
- Active inventory
- 210
- Price-to-rent
- 5.6×
Monthly cashflow live
- Estimated rent
- $1,036 high interval (Pro) →
- Mortgage (P&I)
- −$367
- Tax est. 1.5%
- −$88 /mo · $1,050/yr
- Insurance
- −$29
- HOA
- −$354
- Vacancy / Maint / Mgmt
- −$218
- Net cashflow
- $-19
Break-even live
UW: 25.0% down · 7.5% · 30yr · 1.5% tax · 5.0% vac · 8.0% maint · 8.0% mgmt
Financing live
Cash to close
- Down payment
- $17,500
- Closing costs
- $2,100
- Reserves months
- —
- Total cash needed
- —
Loan-product check · same deal, 3 products live
Conventional
25% down · 7.5% · 30yr
- Down + closing
- —
- Monthly P&I
- —
- Monthly cashflow
- —
- DSCR
- —
- Eligible?
- —
Personal DTI + credit; lowest rate.
DSCR
20% down · 8.5% · 30yr
- Down + closing
- —
- Monthly P&I
- —
- Monthly cashflow
- —
- DSCR
- —
- Eligible?
- —
No personal income docs; deal must DSCR.
Hard money
10% down · 12.0% · 12mo
- Down + closing
- —
- Monthly P&I
- —
- Monthly cashflow
- —
- DSCR
- —
- Eligible?
- —
Short-term bridge; refi at stabilization.
Rent comps 40 comps
| Address | Beds | Baths | Sqft | Rent | $/sqft | DOM | Units | Dist |
|---|---|---|---|---|---|---|---|---|
| 1312 S Sahuara Ave Tucson, AZ | 2.0 | 1.0 | 730 | $1,290 | $1.77 | 3d | 1 | 0.69mi |
| 1266 S Sahuara Ave Tucson, AZ | 2.0 | 1.0 | 986 | $1,195 | $1.21 | 23d | 1 | 0.71mi |
| 834 S Langley Ave #201 Tucson, AZ | 2.0 | 2.0 | 970 | $1,200 | $1.24 | 43d | 1 | 0.77mi |
| 822 S Langley Ave #207 Tucson, AZ | 2.0 | 2.0 | 948 | $1,050 | $1.11 | 3d | 1 | 0.78mi |
| 822 S Langley Ave #207 Tucson, AZ | 2.0 | 2.0 | 948 | $1,175 | $1.24 | 23d | 1 | 0.78mi |
| 820 S Langley Ave Unit 204 Tucson, AZ | 2.0 | 2.0 | 945 | $1,100 | $1.16 | 11d | 1 | 0.81mi |
| 840 S Langley Ave #102 Tucson, AZ | 1.0 | 1.0 | 610 | $1,095 | $1.80 | 43d | 1 | 0.81mi |
| 5757 E 23rd St Tucson, AZ | 1.0 | 1.0 | 550 | $695 | $1.26 | 21d | 1 | 0.82mi |
| 6625 E Golf Links Rd #2 Tucson, AZ | 2.0 | 2.0 | 849 | $995 | $1.17 | 11d | 1 | 0.82mi |
| 808 S Langley Ave Unit 106 Tucson, AZ | 2.0 | 2.0 | 945 | $1,175 | $1.24 | 2d | 1 | 0.83mi |
| 808 S Langley Ave Unit 201 Tucson, AZ | 2.0 | 2.0 | 945 | $1,050 | $1.11 | 23d | 1 | 0.83mi |
| 5758 E 24th St Tucson, AZ | 2.0 | 1.0 | 860 | $1,175 | $1.37 | 43d | 1 | 0.83mi |
| 816 S Langley Ave #203 Tucson, AZ | 2.0 | 1.0 | 945 | $1,050 | $1.11 | 23d | 1 | 0.86mi |
| 816 S Langley Ave #204 Tucson, AZ | 2.0 | 2.0 | 945 | $1,800 | $1.90 | 43d | 1 | 0.86mi |
| 5737 E 24th St Tucson, AZ | 2.0 | 1.0 | 873 | $1,200 | $1.37 | 43d | 1 | 0.86mi |
| 5711 E 26th St Apt B Tucson, AZ | 2.0 | 1.0 | 700 | $800 | $1.14 | 43d | 1 | 0.89mi |
| 6502 E Golf Links Rd Tucson, AZ | 2.0 | 1.0 | 550 | $852 | $1.55 | 10d | 12 | 0.89mi |
| 6091 E Golf Links Rd Unit 6141-06 Tucson, AZ | 2.0 | 1.0 | 900 | $1,270 | $1.41 | 23d | 1 | 0.89mi |
| 6091 E Golf Links Rd Unit 6121-14 Tucson, AZ | 2.0 | 1.0 | 810 | $1,139 | $1.41 | 23d | 1 | 0.89mi |
| 5706 E 24th St Tucson, AZ | 2.0 | 1.0 | 784 | $1,250 | $1.59 | 11d | 1 | 0.90mi |
| 810 S Kolb Rd Unit 4 Tucson, AZ | 2.0 | 1.0 | 850 | $995 | $1.17 | 43d | 1 | 0.90mi |
| 1809 S Van Buren Ave Tucson, AZ | 2.0 | 1.0 | 816 | $995 | $1.22 | 16d | 1 | 0.94mi |
| 1345 S Kolb Rd Tucson, AZ | 2.0 | 1.5 | 1050 | $1,399 | $1.33 | 43d | 1 | 0.99mi |
| 6850 E Golf Links Rd Tucson, AZ | 2.0 | 1.0–1.5 | 517 | $998 | $1.93 | 43d | 1 | 1.01mi |
| 5626 E 26th St Unit 5626 05 Tucson, AZ | 1.0 | 1.0 | 640 | $750 | $1.17 | 23d | 1 | 1.03mi |
| 5626 E 26th St Unit 5626 10 Tucson, AZ | 1.0 | 1.0 | 640 | $695 | $1.09 | 23d | 1 | 1.03mi |
| 5619 E 28th St Unit 5629 Tucson, AZ | 1.0 | 1.0 | 720 | $795 | $1.10 | 43d | 1 | 1.03mi |
| 7001 E Golf Links Rd Tucson, AZ | 2.0–3.0 | 1.0–2.0 | 885 | $1,121 | $1.27 | 2d | 9 | 1.07mi |
| 5550 E 26th St Tucson, AZ | 2.0 | 1.0 | 412 | $874 | $2.12 | 43d | 1 | 1.11mi |
| 1704 S Jefferson Ave Unit WI1710-6 Tucson, AZ | 2.0 | 1.0 | 750 | $995 | $1.33 | 43d | 1 | 1.12mi |
| 1005 S Craycroft Rd Unit CWAC18 Tucson, AZ | 1.0 | 1.0 | 604 | $825 | $1.37 | 23d | 1 | 1.20mi |
| 1507 S Woodland Ave Unit A Tucson, AZ | 2.0 | 1.0 | 737 | $995 | $1.35 | 43d | 1 | 1.24mi |
| 1501 S Woodland Ave Tucson, AZ | 2.0 | 1.0 | 608 | $822 | $1.35 | 43d | 4 | 1.24mi |
| 1501 S Woodland Ave Unit B Tucson, AZ | 2.0 | 1.0 | 737 | $949 | $1.29 | 23d | 1 | 1.24mi |
| 1503 S Woodland Ave Unit B Tucson, AZ | 2.0 | 1.0 | 737 | $1,050 | $1.42 | 43d | 1 | 1.24mi |
| 6639 E Broadway Blvd Tucson, AZ | 1.0 | 1.0 | 650 | $949 | $1.46 | 43d | 1 | 1.24mi |
| 6639 E Broadway Blvd Tucson, AZ | 2.0 | 2.0 | 962 | $1,249 | $1.30 | 44d | 1 | 1.24mi |
| 1401 S Woodland Ave Unit 1401 Tucson, AZ | 2.0 | 1.0 | 830 | $700 | $0.84 | 23d | 1 | 1.24mi |
| 1523 S Woodland Ave Unit A Tucson, AZ | 1.0 | 1.0 | 625 | $895 | $1.43 | 43d | 1 | 1.25mi |
| 1505 S Woodland Ave Unit B Tucson, AZ | 2.0 | 1.0 | 757 | $995 | $1.31 | 43d | 1 | 1.25mi |
HOA detail condo
- Monthly dues
- $354 · $4,248/yr
- Likely covers
- watersewertrashgasexterior maint.pool
- Assessments
- None detected in remarks — confirm with the listing agent.
Listing history 15 events
-
2026-06-18days on market $70,000 Active 41 DOM
-
2026-06-17days on market $70,000 Active 40 DOM
-
2026-06-16days on market $70,000 Active 39 DOM
-
2026-06-15days on market $70,000 Active 38 DOM
-
2026-06-13days on market $70,000 Active 36 DOM
-
2026-06-10days on market $70,000 Active 33 DOM
-
2026-06-09days on market $70,000 Active 32 DOM
-
2026-06-08days on market $70,000 Active 31 DOM
-
2026-06-07days on market $70,000 Active 30 DOM
-
2026-06-05days on market $70,000 Active 27 DOM
-
2026-06-03days on market $70,000 Active 26 DOM
-
2026-06-02days on market $70,000 Active 25 DOM
-
2026-06-01days on market $70,000 Active 24 DOM
-
2026-05-31days on market $70,000 Active 23 DOM
-
2026-05-08$70,000 Active 464-char remark
ⓘ Source: listings_history table (triggers on properties + properties_extension) + one-shot
backfill from property_details.listing_events for pre-trigger history.
Climate risk First Street
- Flood 1/10 Low FEMA zone X (unshaded) · 0% chance over 30 yrs
- Wildfire 1/10 Low
- Heat 7/10 Severe 4 d/yr ≥105°F today · 11 d/yr by 30 yrs out
- Wind 1/10 Low
- Air quality 1/10 Low 0 unhealthy d/yr today · 0 by 30 yrs out
Nearby sold comps map
Loading sold comps map…
Walkable amenities ~0.75 mi
Loading nearby amenities…
Taxation est. · year 1
- Rental income
- $12,433
- − Mortgage interest
- −$3,921
- − Property taxes
- −$1,050
- − Insurance
- −$350
- − Repairs & maintenance
- −$995
- − Management
- −$995
- − HOA
- −$4,248
- − Depreciation
- −$2,036
- Taxable loss
- −$1,161
- Est. tax savings @ 24.0%
- +$279
- After-tax cash flow
- $48/yr
For passive investors: Depreciation is non-cash, so a rental often shows a tax loss while cash-flowing — sheltering income. Rental losses are passive: they offset passive income freely, and up to $25,000/yr can offset ordinary (W-2) income if you actively participate and your MAGI is under $100k (phasing out to $0 by $150k); unused losses carry forward. On sale, claimed depreciation is recaptured at up to 25%, and gains may owe capital-gains tax (a 1031 exchange can defer both). Figures are a year-1 estimate at your 24.0% rate — not tax advice; consult a CPA.
Condition & rehab AI · 22 photos
A moderately updated townhouse with average condition, requiring minor repairs and maintenance to enhance its resale and rental value.
Repairs flagged
- Minor kitchen backsplash — Dated appearance
- Minor bathroom tile — Dated appearance
- Minor exterior siding — Weathered appearance
Value-add opportunities
- Both Paint interior walls — Enhances curb appeal and interior aesthetics
- Both Replace kitchen backsplash — Modernizes kitchen and adds value
- Both Replace bathroom tile — Modernizes bathroom and adds value
- Both Paint exterior siding — Enhances curb appeal and adds value
Renovation cost estimate screening
| Repair item | Severity | Est. cost |
|---|---|---|
| kitchen backsplash · Dated appearance | Minor | $500–3,000 |
| bathroom tile · Dated appearance | Minor | $500–3,000 |
| exterior siding · Weathered appearance | Minor | $500–3,000 |
| Total estimated repair cost · 3 items | $1,500–9,000 |
Value-add ROI direction
- Both Paint interior walls — Enhances curb appeal and interior aesthetics ↑
- Both Replace kitchen backsplash — Modernizes kitchen and adds value ↑
- Both Replace bathroom tile — Modernizes bathroom and adds value ↑
- Both Paint exterior siding — Enhances curb appeal and adds value ↑
ⓘ Cost ranges are severity-bucket heuristics (US national rule-of-thumb). Get contractor quotes + a written scope before underwriting a rehab budget.
Schools (NCES district)
- District
- Tucson Unified District (4403)
- NCES district ID
- 0408800
- Math proficiency
- 14% ▼ -17.00%
- Reading proficiency
- 23% ▼ -11.00%
- Median HH income
- $40,962
- Composite
- 15.78/100
- National rank
- #9270
- State rank
- #190 of 249 in AZ
Livability — Tucson
- Score
- 74/100
- State rank
- #17
- US rank
- #4502
Category grades
Schools grade is shown separately in the Schools card above.
Census & demographics
- Census place
- Tucson, AZ
- County
- Pima County · 1,012,107 people
- City population
- 839,336
- Metro
- Tucson, AZ
- Population (ZIP)
- 56,125
- Household income
- $57,175
- Rent vs Own
- Severe rent burden
- 3888.0
Population outlook (Pima County) Hauer SSP2
- Today (2025)
- 1,066,056 people
- By 2030
- 1,086,684 · +1.9%
- By 2040
- 1,117,160 · +4.8%
- By 2050
- 1,149,778 · +7.9%
- By 2075
- 1,271,480 · +19.3%
- By 2100
- 1,321,160 · +23.9%
Race, ethnicity, and origin ACS 2023
- Neighborhood character
- Diverse neighborhood (Simpson 0.56)
- Race & ethnicity
- White 62% Hispanic / Latino 25% Two or more races 13% Black 5% Asian 2% Native American 1%
- Hispanic origin (detail)
- Mexican 22%
- Common ancestry
- Lithuanian 3% Romanian 2% Italian 2%
- Foreign-born
- 9% · Canada, South Korea
- Languages at home
- 83% English-only · Spanish 11% Arabic 1% Other Indo-European 1%
Political lean MEDSL · Pima
- 2024 margin
- D (+15.2) · D 57.0% · R 41.8% · Other 1.2%
- 2008→2024 swing
- +9.1pp toward D · 2008: 6.1pp · 2024: 15.2pp
- All cycles
- 2024: D+15.2 2020: D+18.7 2016: D+13.5 2012: D+5.8 2008: D+6.1
Not yet ingested
- Civics
- —
Market trends
- HPI YoY
- ▼ -287.68%
- Current HPI
- 291.8039
- Rent YoY
- ▲ 1.61%
- Metro
- Tucson, AZ
- State GDP YoY
- ▲ 4.54%
- F500 in state
- 20
Industry mix (Fortune 500 HQ in AZ)
| Industry | F500 HQs | Revenue |
|---|---|---|
| Technology | 2 | $13B |
|
||
| Mining / Metals | 1 | $23B |
|
||
| Environmental Services | 1 | $16B |
|
||
| Metals / Steel | 1 | $14B |
|
||
| Technology Distribution | 1 | $9B |
|
||
| Homebuilding | 1 | $8B |
|
||
Price history
1 event — show timeline
- 2026-05-08 Listed $70,000 MLSSAZ
Cash-flow waterfall
monthlySold comps — $/sqft
last 12 mo · ≤1 miLoading sold comps…