509 1/2 8th Avenue Ext · Cramerton, NC
Flood risk 1/10 · Minimal
- FEMA flood zone
- X (unshaded)
- Chance of flooding over 30 yrs
- 0.0%
- Est. flood insurance / yr
- $507 – $1,088
Fire risk 1/10 · Minimal
- Est. fire insurance / yr
- $906 – $1,684
Heat risk 6/10 · Moderate
- Hot days now (above 104°F)
- 7 days/yr
- Hot days in 30 yrs
- 17 days/yr
Wind risk 5/10 · Moderate
- Chance of severe wind over 30 yrs
- 22.0%
Air-quality risk 3/10 · Minor
- Unhealthy air days now
- 3 days/yr
- Unhealthy air days in 30 yrs
- 5 days/yr
Risk factors via First Street. Map © Google.
Why this score? — see what drove the C+ grade
The composite is a weighted blend of 9 inputs, each scored 0–100. Each bar is that input's sub-score; the figure is the points it added to the 100-point composite (weight × sub-score).
- Cash flow +24.0/30.0
- ARV discount +15.0/15.0
- DSCR +7.7/10.0
- 1% rule +6.2/10.0
- Livability +3.9/5.0
- Schools +3.6/10.0
- Rent growth +2.5/5.0
- Condition / age +1.0/5.0
- Appreciation +0.0/10.0
$150,000
🖨 Deal sheet 📄 Offer letter ✓ Due diligence
Listing remarks
Investors, take a look. Motivated Seller. Bring an offer. Home sold as is.
Key facts
- 0.34 acre lot
- Built 1993
- Listed 14 days
Property features AI
Finance
- HOA & community: No HOA
Exterior
- Parking: Driveway
- Utilities: Well water; Septic system installed
- Home design: Single-family residential home; Site-built construction; Vinyl exterior; One story
- Construction: Site-built construction with vinyl siding; Crawl space foundation
- Exterior features: Private-maintained concrete/paved road
Interior
- Kitchen: Electric range; Refrigerator
- Bedrooms: 3 bedrooms on the main level
- Bathrooms: 1 full bathroom on the main level
- Heating & cooling: Heat pump
- Interior features: 7 total rooms; Heat pump for heating and cooling; Crawl space foundation; One-level living
- Laundry & utility: Laundry located on the main level
Neighborhood map
What this means for you Summary
Snapshot
- This is a 3-bed/1.0-bath single-family listed at $150k. Condition is rated poor.
Deal economics
- At list price, monthly cash flow is $293 ($4k/yr) — positive.
- The deal already cash-flows at list — no discount required.
- Meets the 1% rule at list price ($2k rent vs $150k).
- Cap rate 8.6% vs local median 3.5% in Cramerton — top-decile yield for the area; either an underpriced asset or a hidden risk that comps aren't pricing in. Stress-test before assuming the spread holds.
Location & tenants
- Location reads 77/100 on livability (#28 in NC, #2,789 nationally) — a middle-class / working-renter tenant base. Strengths: employment A+, housing A+, crime A; Watch: amenities F, commute F.
- Gaston County Schools (suburban): math 44% / reading 42% proficiency, ranked #93 of 178 in NC (top 52%) — families likely to look elsewhere, expect single-tenant / working-renter base with shorter leases.
- Market conditions: 60 active listings in the ZIP; 6 comparable units currently listed for rent nearby; rentals at typical pace (median 24d on market — plan ~3-4 weeks tenant-placement turnaround); 2,069 units permitted in Gaston County in 2024 (142 in 5+ unit buildings).
- This rent runs 33% of the median local income ($61k/yr) — at the standard rent-burdened threshold; future hikes will face affordability resistance.
Forward outlook
- Local home prices are declining (-3.0%/yr); year-one equity from $1k of loan paydown is wiped out by about $4k of value loss. Plan a longer hold.
- Gaston County population projected at +12% by 2050 — modest demand growth; plan on rents tracking national, not racing it.
Negotiation context
- Only 14 days on market — expect competitive offers; lowballing is unlikely to land.
Risks & watch-outs
- Climate carrying-cost: moderate wind risk, 22% chance of damaging wind over 30y; extreme-heat days projected 7→17/yr by 2055 (HVAC capex compounding) — expect insurance premiums to compound above CPI over the hold.
Questions for the listing agent
- Have any recent inspections been done? Can we get a copy of the seller's disclosures and any deferred-maintenance estimates?
- Is there a deadline driving the sale (1031 exchange, divorce, estate, relocation)? That informs how much negotiation room exists.
- What's the average days-on-market for RENTAL listings here right now (not sales)? A rising rental-DOM trend means longer vacancies and softer asking-rent achievability than the comps imply.
- What's the recent tenant-quality profile in this submarket — average credit score on applications, eviction rate, late-payment / NSF rate, and stable-employment percentage? A property-management company in the area should have these aggregated.
- How much new for-sale + rental construction is in the pipeline within 1–3 miles? Heavy new supply typically softens prices + rents 12–24 months out; constrained supply supports both.
Investment metrics
- 1% rule
- 1.12% ✓
- Cap rate
- 8.64%
- Cash-on-cash
- 8.38%
- DSCR
- 1.37
- GRM
- 7.4
CMA / ARV
- ARV (on-the-fly)
- $218,066
- Comps found
- 12
Show comp detail 12 sales within ~0.75 mi
| Address | Dist | Beds/Ba | Sqft | Sold | Price | $/sf | Match |
|---|---|---|---|---|---|---|---|
| 509 1/2 8th Avenue Ext | 0.00mi | 3/1.0 | 1,019 (0%) | 1mo | $130,000 | $128 | 99 |
| 335 Mayflower Ave | 0.36mi | 2/1.0 (-1) | 966 (-5%) | 1mo | $254,000 | $263 | 69 |
| 401 Woodlawn Ave | 0.46mi | 2/2.0 (-1) | 1,004 (-2%) | 9mo | $264,000 | $263 | 60 |
| 399 Woodlawn Ave | 0.47mi | 2/1.0 (-1) | 1,099 (+8%) | 3mo | $235,000 | $214 | 58 |
| 408 Woodlawn Ave | 0.41mi | 2/1.0 (-1) | 1,162 (+14%) | 0mo | $230,000 | $198 | 52 |
| 331 Mayflower Ave | 0.41mi | 2/2.0 (-1) | 966 (-5%) | 19mo | $225,900 | $234 | 47 |
| 325 Mayflower Ave | 0.50mi | 2/2.0 (-1) | 1,067 (+5%) | 17mo | $255,000 | $239 | 46 |
| 313 Mayflower Ave | 0.66mi | 2/1.0 (-1) | 1,100 (+8%) | 7mo | $215,000 | $195 | 45 |
| 516 Washington St | 0.64mi | 2/1.0 (-1) | 960 (-6%) | 14mo | $199,000 | $207 | 44 |
| 380 Woodlawn Ave | 0.59mi | 2/1.0 (-1) | 1,157 (+14%) | 3mo | $233,000 | $201 | 42 |
| 125 Ashe St | 0.39mi | 2/2.0 (-1) | 869 (-15%) | 11mo | $215,000 | $247 | 39 |
| 504 Washington St | 0.71mi | 2/1.0 (-1) | 939 (-8%) | 15mo | $200,500 | $214 | 37 |
Match score weights: distance 35% · size 25% · config 20% · recency 20%. Top-matched comps best support the ARV.
Projected returns pro-forma
-3.0% appreciation · 3.0% rent growth · sell at horizon
- IRR
- -3.6%
- Equity multiple
- 0.87×
- Total profit
- $-5,601
- Equity at exit
- $22,365
- IRR
- 6.2%
- Equity multiple
- 1.46×
- Total profit
- $19,279
- Equity at exit
- $12,969
Cash invested: $42,000 (down + closing). Projections, not guarantees.
Landlord ↔ Tenant lean methodology
- Overall (STATE)
- 85 Strongly Landlord-Friendly
- State North Carolina
- 85 Strongly Landlord-Friendly · R+3
- County
- — inherits STATE
- City
- — inherits STATE
ZIP-level market 28032
- Active inventory
- 60
- Price-to-rent
- 7.4×
Monthly cashflow live
- Estimated rent
- $1,683 high interval (Pro) →
- Mortgage (P&I)
- −$787
- Tax est. 1.5%
- −$188 /mo · $2,250/yr
- Insurance
- −$62
- HOA
- −$0
- Vacancy / Maint / Mgmt
- −$354
- Net cashflow
- $293
Break-even live
UW: 25.0% down · 7.5% · 30yr · 1.5% tax · 5.0% vac · 8.0% maint · 8.0% mgmt
Financing live
Cash to close
- Down payment
- $37,500
- Closing costs
- $4,500
- Reserves months
- —
- Total cash needed
- —
Loan-product check · same deal, 3 products live
Conventional
25% down · 7.5% · 30yr
- Down + closing
- —
- Monthly P&I
- —
- Monthly cashflow
- —
- DSCR
- —
- Eligible?
- —
Personal DTI + credit; lowest rate.
DSCR
20% down · 8.5% · 30yr
- Down + closing
- —
- Monthly P&I
- —
- Monthly cashflow
- —
- DSCR
- —
- Eligible?
- —
No personal income docs; deal must DSCR.
Hard money
10% down · 12.0% · 12mo
- Down + closing
- —
- Monthly P&I
- —
- Monthly cashflow
- —
- DSCR
- —
- Eligible?
- —
Short-term bridge; refi at stabilization.
Rent comps 6 comps
| Address | Beds | Baths | Sqft | Rent | $/sqft | DOM | Units | Dist |
|---|---|---|---|---|---|---|---|---|
| 1654 Lowell Bethesda Rd Gastonia, NC | 2.0 | 2.0 | 1000 | $1,495 | $1.50 | 23d | 1 | 0.53mi |
| 1654 Lowell Bethesda Rd Gastonia, NC | 2.0 | 2.0 | 1000 | $1,495 | $1.50 | 3d | 1 | 0.53mi |
| 236 8th Ave Cramerton, NC | 1.0–2.0 | 1.0–2.0 | 849 | $1,404 | $1.65 | 23d | 1 | 0.93mi |
| 2000 Hampton Meadows Ln Unit 2111HML Cramerton, NC | 3.0 | 2.0 | 1075 | $1,350 | $1.26 | 23d | 1 | 1.28mi |
| 1001 Haven Cir Belmont, NC | 1.0–3.0 | 1.0–2.0 | 1115 | $1,965 | $1.76 | 2d | 12 | 1.43mi |
| 814 King Arthur Dr Gastonia, NC | 3.0 | 2.0 | 960 | $1,795 | $1.87 | 23d | 1 | 1.45mi |
Listing history 5 events
-
2026-04-24status Pending
-
2026-04-20price $150,000
-
2026-04-11price $190,000
-
2026-04-10$210,000 Active
-
2026-04-08historical $210,000
ⓘ Source: listings_history table (triggers on properties + properties_extension) + one-shot
backfill from property_details.listing_events for pre-trigger history.
Climate risk First Street
- Flood 1/10 Low FEMA zone X (unshaded) · 0% chance over 30 yrs
- Wildfire 1/10 Low
- Heat 6/10 Major 7 d/yr ≥104°F today · 17 d/yr by 30 yrs out
- Wind 5/10 Major 22% chance of damaging wind over 30 yrs
- Air quality 3/10 Moderate 3 unhealthy d/yr today · 5 by 30 yrs out
Nearby sold comps map
Loading sold comps map…
Walkable amenities ~0.75 mi
Loading nearby amenities…
Taxation est. · year 1
- Rental income
- $20,201
- − Mortgage interest
- −$8,402
- − Property taxes
- −$2,250
- − Insurance
- −$750
- − Repairs & maintenance
- −$1,616
- − Management
- −$1,616
- − Depreciation
- −$4,364
- Taxable income
- $1,203
- Est. tax owed @ 24.0%
- −$289
- After-tax cash flow
- $3,231/yr
For passive investors: Depreciation is non-cash, so a rental often shows a tax loss while cash-flowing — sheltering income. Rental losses are passive: they offset passive income freely, and up to $25,000/yr can offset ordinary (W-2) income if you actively participate and your MAGI is under $100k (phasing out to $0 by $150k); unused losses carry forward. On sale, claimed depreciation is recaptured at up to 25%, and gains may owe capital-gains tax (a 1031 exchange can defer both). Figures are a year-1 estimate at your 24.0% rate — not tax advice; consult a CPA.
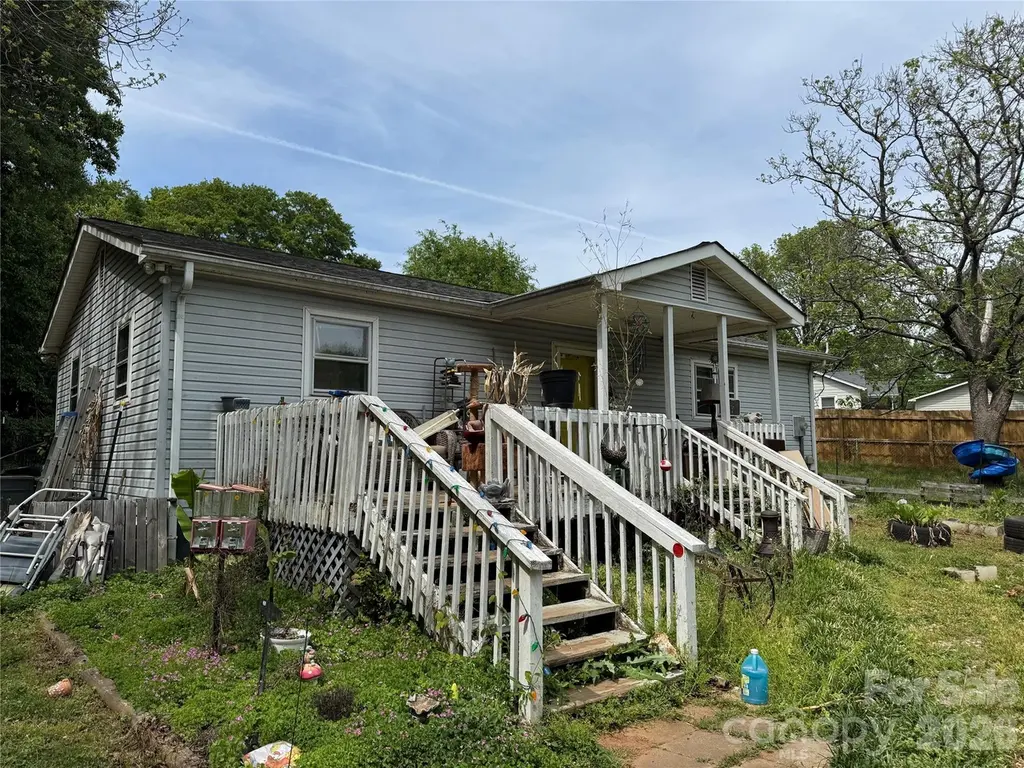
Condition & rehab AI · 1 photo
This home requires extensive repairs and maintenance, including a new roof and landscaping, to become move-in ready.
Repairs flagged
- Major roof — Missing shingles
- Major exterior — Overgrown yard, damaged fence
- Major porch floor — Worn-out and damaged
- Major interior walls — Paint peeling
Value-add opportunities
- Both Landscaping and yard cleanup — Improves curb appeal and value
- Both New roof — Essential for structural integrity and value
- Both Porch floor replacement — Enhances safety and aesthetics
- Both Interior wall repairs and painting — Enhances home's appearance and value
Renovation cost estimate screening
| Repair item | Severity | Est. cost |
|---|---|---|
| roof · Missing shingles | Major | $15,000–50,000 |
| exterior · Overgrown yard, damaged fence | Major | $15,000–50,000 |
| porch floor · Worn-out and damaged | Major | $15,000–50,000 |
| interior walls · Paint peeling | Major | $15,000–50,000 |
| Total estimated repair cost · 4 items | $60,000–200,000 |
Value-add ROI direction
- Both Landscaping and yard cleanup — Improves curb appeal and value ↑
- Both New roof — Essential for structural integrity and value ↑
- Both Porch floor replacement — Enhances safety and aesthetics ↑
- Both Interior wall repairs and painting — Enhances home's appearance and value ↑
ⓘ Cost ranges are severity-bucket heuristics (US national rule-of-thumb). Get contractor quotes + a written scope before underwriting a rehab budget.
Schools (NCES district)
- District
- Gaston County Schools
- NCES district ID
- 3701620
- Math proficiency
- 44% ▲ 4.00%
- Reading proficiency
- 42% ▲ 1.00%
- Median HH income
- $43,644
- Composite
- 36.39/100
- National rank
- #4680
- State rank
- #93 of 178 in NC
Livability — Cramerton
- Score
- 77/100
- State rank
- #28
- US rank
- #2789
Category grades
Schools grade is shown separately in the Schools card above.
Census & demographics
- County
- Gaston County · 201,497 people
- City population
- 2,869
- Metro
- Charlotte-Concord-Gastonia, NC-SC
- Population (ZIP)
- 2,869
- Household income
- $60,924
- Rent vs Own
- Severe rent burden
- 73.0
Population outlook (Gaston County) Hauer SSP2
- Today (2025)
- 230,027 people
- By 2030
- 237,300 · +3.2%
- By 2040
- 249,659 · +8.5%
- By 2050
- 257,806 · +12.1%
- By 2075
- 272,163 · +18.3%
- By 2100
- 268,652 · +16.8%
Race, ethnicity, and origin ACS 2023
- Neighborhood character
- Predominantly White (83%)
- Race & ethnicity
- White 83% Black 8% Hispanic / Latino 3% Two or more races 2% Asian 1%
- Common ancestry
- Iranian 3% Lithuanian 3% Italian 3%
- Foreign-born
- 5% · China, Canada
- Languages at home
- 94% English-only · Spanish 2% Other Indo-European 1% Chinese 1%
Political lean MEDSL · Gaston
- 2024 margin
- Strong R (+25.0) · D 37.0% · R 62.1%
- 2008→2024 swing
- 0.0pp no change · 2008: -25.0pp · 2024: -25.0pp
- All cycles
- 2024: R+25.0 2020: R+27.8 2016: R+32.1 2012: R+25.6 2008: R+25.0
Not yet ingested
- Civics
- —
Market trends
- HPI YoY
- ▼ -140.82%
- Current HPI
- 244.7087
- Rent YoY
- —
- Metro
- Charlotte-Concord-Gastonia, NC-SC
- State GDP YoY
- ▲ 3.28%
- F500 in state
- 26
Industry mix (Fortune 500 HQ in NC)
| Industry | F500 HQs | Revenue |
|---|---|---|
| Financial Services | 2 | $213B |
|
||
| Retail | 2 | $95B |
|
||
| Industrial Conglomerate | 1 | $38B |
|
||
| Metals / Steel | 1 | $35B |
|
||
| Utilities | 1 | $30B |
|
||
| Industrial Machinery | 1 | $19B |
|
||
Price history
-28.6% since first listed5 events — show timeline
- 2026-04-24 Pending — CANOPYMLS as Distributed by MLS Grid
- 2026-04-20 Price Changed $150,000 CANOPYMLS as Distributed by MLS Grid
- 2026-04-11 Price Changed $190,000 CANOPYMLS as Distributed by MLS Grid
- 2026-04-10 Listed $210,000 CANOPYMLS as Distributed by MLS Grid
- 2026-04-08 Coming Soon $210,000 CANOPYMLS as Distributed by MLS Grid
Cash-flow waterfall
monthlySold comps — $/sqft
last 12 mo · ≤1 miLoading sold comps…