138 Liberty · Newport Beach, CA
Flood risk 1/10 · Minimal
- FEMA flood zone
- X (unshaded)
- Chance of flooding over 30 yrs
- 0.0%
- Est. flood insurance / yr
- $507 – $1,088
Fire risk 1/10 · Minimal
- Est. fire insurance / yr
- $659 – $1,223
Heat risk 5/10 · Moderate
- Hot days now (above 82°F)
- 7 days/yr
- Hot days in 30 yrs
- 23 days/yr
Wind risk 1/10 · Minimal
- Chance of severe wind over 30 yrs
- —
Air-quality risk 4/10 · Minor
- Unhealthy air days now
- 6 days/yr
- Unhealthy air days in 30 yrs
- 6 days/yr
Risk factors via First Street. Map © Google.
Why this score? — see what drove the B- grade
The composite is a weighted blend of 9 inputs, each scored 0–100. Each bar is that input's sub-score; the figure is the points it added to the 100-point composite (weight × sub-score).
- Cash flow +22.5/30.0
- Appreciation +10.0/10.0
- ARV discount +8.5/15.0
- DSCR +7.2/10.0
- 1% rule +5.9/10.0
- Schools +4.8/10.0
- Livability +3.8/5.0
- Rent growth +3.5/5.0
- Condition / age +2.5/5.0
$420,000
🖨 Deal sheet 📄 Offer letter ✓ Due diligence
Listing remarks
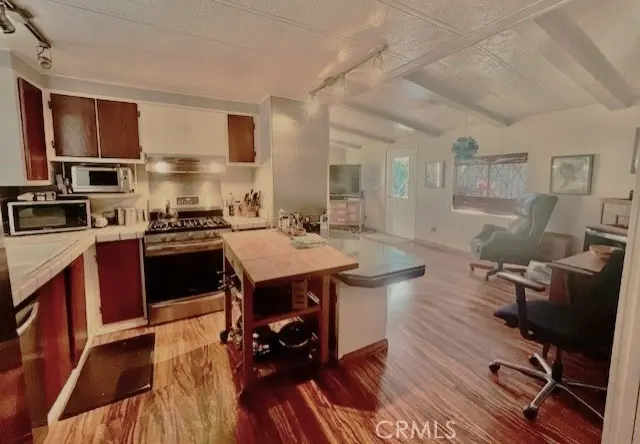
Welcome to Bayside Village in the heart of Newport Beach. This 2 bedroom/2 bath home is in a great location and is just a short stroll to Back Bay, the bayfront clubhouse with pool & jacuzzi plus a private beach! Also close by is the fitness room, picnic area with barbeque and dog park. There is also a marina. This home has an open floorplan with great room and dining area plus open kitchen with stainless appliances. The spacious primary bedroom has a walk in closet and bathroom with walk in shower. The second bedroom has a sliding glass door leading out to the patio area. There is also a laundry area. Outside is an oversized private patio yard with mature trees. There is also a larg
Key facts
- Picnic area
- Private beach
- Fitness room
Tags
Property features AI
Finance
- Other: Part of Bayside Village community
- Financial info: Land lease (monthly) — amount reported by seller
- HOA & community: Community amenities: pool, spa (in-ground, community, heated), clubhouse, gym/exercise room, billiard room, card room, recreational/multipurpose room, picnic area, barbecue/outdoor cooking area, fire pit, dog park, street lighting, onsite property management, trash and sewer service; Association allows pets with breed restrictions; Permitted types and pet rules enforced
Exterior
- Parking: Attached carport (1 space); Private road access (paved)
- Security: Onsite resident manager
- Utilities: Electricity on property; electricity connected; Natural gas connected; Water connected (district/public); Public sewer (sewer paid); Cable available; Telephone in street
- Home design: Single-story home; Entry on side; Faces south; Model: Canyon Crest; Mobile home remains (20' x 48'); One-level living
- Construction: Wood construction with drywall interior walls; Skirted with wood and brick; Pier jacks foundation
- Exterior features: Porch; Patio; Rain gutters; Storage building; Wood fencing; Patio-home lot; Treed lot; Landscaped; Level with street; Park nearby; Community marina view; Community pool (fenced, filtered, heated)
Interior
- Kitchen: Kitchen open to family room; Kitchen island; Pots & pan drawers; Garbage disposal; Built-in range; Dishwasher; Gas water heater
- Bedrooms: Primary suite; Walk-in closet
- Flooring: Carpet; Wood
- Bathrooms: Two full bathrooms; Bathtub; Shower; Walk-in shower; Shower in tub
- Heating & cooling: Central furnace
- Interior features: Beamed ceilings; Built-in shelving/cabinetry; Bar area; Home automation system; Track lighting; Open floor plan; Tile countertops; Sliding glass doors; Casement windows with drapes/curtains and screens; No interior steps (accessible); Doors swing inward
- Laundry & utility: Washer hookup; Laundry area in kitchen; 220V outlet in laundry
Neighborhood map
What this means for you Summary
Snapshot
- This is a 2-bed/2.0-bath manufactured listed at $420k.
Deal economics
- At list price, monthly cash flow is $705 ($8k/yr) — positive.
- The deal already cash-flows at list — no discount required.
- Meets the 1% rule at list price ($5k rent vs $420k).
- Recommended offer: $414k (1.5% below list) — sets the bar for market timing.
- Cap rate 8.3% vs local median 0.6% in Newport Beach — top-decile yield for the area; either an underpriced asset or a hidden risk that comps aren't pricing in. Stress-test before assuming the spread holds.
Location & tenants
- Location reads 76/100 on livability (#101 in CA, #3,645 nationally) — a middle-class / working-renter tenant base. Strengths: amenities A+, employment A+, commute A; Watch: health & safety C-, cost of living F.
- Newport-Mesa Unified (urban): math 46% / reading 58% proficiency, ranked #106 of 517 in CA (top 20%) — acceptable for families but not a draw, mixed tenant base, ~2y average lease.
- Zoned schools: Corona Del Mar High (math 55% / reading 63%, grade C+, #221 of 1,170 statewide, top 19%, 2,059 students, 20% FRL) — zoned schools average 20% FRL vs 40% district-wide (20 pts lower); this property's tenant base skews higher-income than the district average.
- Market conditions: Rents rising fast (+4.1%/yr); 154 active listings in the ZIP; 40 comparable units currently listed for rent nearby; rentals at typical pace (median 25d on market — plan ~3-4 weeks tenant-placement turnaround); 40% of comp listings sitting > 30 days — soft ceiling on asking rent; high-income renter base; 6,974 units permitted in Orange County in 2024 (3,839 in 5+ unit buildings).
- This rent runs 34% of the median local income ($160k/yr) — at the standard rent-burdened threshold; future hikes will face affordability resistance.
Forward outlook
- In year one you build about $45k of equity ($3k loan paydown + $42k appreciation (10.0% local appreciation)).
- Orange County population projected at +14% by 2050 — modest demand growth; plan on rents tracking national, not racing it.
- At projected returns (10.0% appreciation + 4.1% rent growth), your $118k cash investment doubles in ~3 years — after that, you're playing with house money.
- By year 2, paydown + projected appreciation supports a ~$72k cash-out refi (75% LTV) — recoverable capital for the next deal without selling this one.
Negotiation context
- It's been on market 30 days — a 2% lower offer ($414k) is reasonable based on typical stale-listing flexibility.
- 2 sale attempts; this cycle's ask has dropped $55k (12%) from the opening price — seller is motivated, your offer sets the floor, not the list.
Risks & watch-outs
- Climate carrying-cost: extreme-heat days projected 7→23/yr by 2055 (HVAC capex compounding) — expect insurance premiums to compound above CPI over the hold.
Questions for the listing agent
- Is there a deadline driving the sale (1031 exchange, divorce, estate, relocation)? That informs how much negotiation room exists.
- Schools are A-rated — typically a magnet for longer-tenancy family renters. What's the average tenant stay here, and is there a school-zone premium baked into asking?
- What's the average days-on-market for RENTAL listings here right now (not sales)? A rising rental-DOM trend means longer vacancies and softer asking-rent achievability than the comps imply.
- What's the recent tenant-quality profile in this submarket — average credit score on applications, eviction rate, late-payment / NSF rate, and stable-employment percentage? A property-management company in the area should have these aggregated.
- How much new for-sale + rental construction is in the pipeline within 1–3 miles? Heavy new supply typically softens prices + rents 12–24 months out; constrained supply supports both.
Investment metrics
- 1% rule
- 1.09% ✓
- Cap rate
- 8.31%
- Cash-on-cash
- 7.19%
- DSCR
- 1.32
- GRM
- 7.7
CMA / ARV
- ARV (on-the-fly)
- $429,120
- Comps found
- 6
Show comp detail 6 sales within ~0.75 mi
| Address | Dist | Beds/Ba | Sqft | Sold | Price | $/sf | Match |
|---|---|---|---|---|---|---|---|
| 312 Concord Ln | 0.14mi | 2/2.0 | 1,000 (+4%) | 14mo | $350,000 | $350 | 75 |
| 265 Mayflower | 0.08mi | 2/2.0 | 1,100 (+15%) | 0mo | $370,000 | $336 | 72 |
| 208 Tremont Dr | 0.07mi | 2/2.0 | 1,040 (+8%) | 16mo | $465,000 | $447 | 70 |
| 205 Tremont Dr | 0.09mi | 3/2.0 (+1) | 1,078 (+12%) | 6mo | $649,000 | $602 | 65 |
| 24 Saratoga #24 | 0.10mi | 2/2.0 | 1,100 (+15%) | 9mo | $850,000 | $773 | 64 |
| 72 Saratoga | 0.07mi | 2/2.0 | 1,104 (+15%) | 19mo | $440,000 | $399 | 56 |
Match score weights: distance 35% · size 25% · config 20% · recency 20%. Top-matched comps best support the ARV.
Projected returns pro-forma
10.0% appreciation · 4.11% rent growth · sell at horizon
- IRR
- 30.0%
- Equity multiple
- 3.37×
- Total profit
- $278,859
- Equity at exit
- $378,369
- IRR
- 26.3%
- Equity multiple
- 7.78×
- Total profit
- $796,977
- Equity at exit
- $815,968
Cash invested: $117,600 (down + closing). Projections, not guarantees.
Landlord ↔ Tenant lean methodology
- Overall (STATE)
- 18 Strongly Tenant-Friendly
- State California
- 18 Strongly Tenant-Friendly · D+13
- County
- — inherits STATE
- City
- — inherits STATE
ZIP-level market 92660
- Home prices YoY
- 3.4%
- Rents YoY
- 4.1%
- Active inventory
- 154
- Price-to-rent
- 7.7×
Monthly cashflow live
- Estimated rent
- $4,566 high interval (Pro) →
- Mortgage (P&I)
- −$2,203
- Tax est. 1.5%
- −$525 /mo · $6,300/yr
- Insurance
- −$175
- HOA
- −$0
- Vacancy / Maint / Mgmt
- −$959
- Net cashflow
- $705
Break-even live
UW: 25.0% down · 7.5% · 30yr · 1.5% tax · 5.0% vac · 8.0% maint · 8.0% mgmt
Financing live
Cash to close
- Down payment
- $105,000
- Closing costs
- $12,600
- Reserves months
- —
- Total cash needed
- —
Loan-product check · same deal, 3 products live
Conventional
25% down · 7.5% · 30yr
- Down + closing
- —
- Monthly P&I
- —
- Monthly cashflow
- —
- DSCR
- —
- Eligible?
- —
Personal DTI + credit; lowest rate.
DSCR
20% down · 8.5% · 30yr
- Down + closing
- —
- Monthly P&I
- —
- Monthly cashflow
- —
- DSCR
- —
- Eligible?
- —
No personal income docs; deal must DSCR.
Hard money
10% down · 12.0% · 12mo
- Down + closing
- —
- Monthly P&I
- —
- Monthly cashflow
- —
- DSCR
- —
- Eligible?
- —
Short-term bridge; refi at stabilization.
Rent comps 40 comps
| Address | Beds | Baths | Sqft | Rent | $/sqft | DOM | Units | Dist |
|---|---|---|---|---|---|---|---|---|
| 94 Yorktown Newport Beach, CA | 2.0 | 2.0 | 1029 | $4,250 | $4.13 | 13d | 1 | 0.02mi |
| 200 Promontory Dr W Newport Beach, CA | 1.0–2.0 | 1.0–2.0 | 1187 | $5,385 | $4.54 | 2d | 25 | 0.38mi |
| 226 Garnet Ave Newport Beach, CA | 1.0 | 1.0 | 589 | $4,195 | $7.12 | 43d | 1 | 0.67mi |
| 212 Garnet Ave Newport Beach, CA | 2.0 | 2.0 | 791 | $5,900 | $7.46 | 43d | 1 | 0.70mi |
| 120 Garnet Ave Newport Beach, CA | 2.0 | 1.0 | 850 | $5,150 | $6.06 | 43d | 1 | 0.75mi |
| 216 Agate Ave Unit 1/2 Newport Beach, CA | 1.0 | 1.0 | 767 | $4,000 | $5.22 | 43d | 1 | 0.75mi |
| 1728 Bedford Ln Newport Beach, CA | 1.0–2.0 | 1.0–2.0 | 954 | $3,795 | $3.98 | 1d | 2 | 0.76mi |
| 320 Sapphire Ave Newport Beach, CA | 2.0 | 2.0 | 1000 | $4,200 | $4.20 | 2d | 1 | 0.77mi |
| 232 Villa Point Dr Newport Beach, CA | 1.0 | 1.0 | 851 | $4,350 | $5.11 | 24d | 1 | 0.83mi |
| 208 Villa Point Dr Newport Beach, CA | 1.0 | 1.0 | 774 | $3,490 | $4.51 | 43d | 1 | 0.83mi |
| 122 Opal Ave Unit 2 Newport Beach, CA | 2.0 | 1.0 | 700 | $4,750 | $6.79 | 18d | 1 | 0.85mi |
| 312 Saint Andrews Rd Unit B Newport Beach, CA | 2.0 | 1.0 | 1000 | $4,850 | $4.85 | 43d | 1 | 0.86mi |
| 533 Saint Andrews Rd Newport Beach, CA | 2.0 | 1.0 | 980 | $3,800 | $3.88 | 2d | 1 | 0.87mi |
| 1400 Haven Pl Unit 533 Newport Beach, CA | 2.0 | 1.0 | 980 | $3,800 | $3.88 | 2d | 1 | 0.87mi |
| 880 Irvine Ave Newport Beach, CA | 2.0 | 1.0–2.0 | 704 | $3,179 | $4.51 | 1d | 99 | 0.87mi |
| 305 Marine Ave Newport Beach, CA | 2.0 | 1.0 | 625 | $4,000 | $6.40 | 43d | 1 | 0.90mi |
| 207 E Edgewater Ave Newport Beach, CA | 2.0 | 2.0 | 950 | $9,000 | $9.47 | 20d | 1 | 0.91mi |
| 2101 E 15th St #8 Newport Beach, CA | 2.0 | 1.5 | 1025 | $4,350 | $4.24 | 43d | 1 | 0.93mi |
| 1510 Abalone Pl Newport Beach, CA | 1.0 | 1.0 | 750 | $3,500 | $4.67 | 43d | 1 | 0.94mi |
| 307 Anade Ave Newport Beach, CA | 2.0 | 2.0 | 1100 | $4,750 | $4.32 | 43d | 1 | 0.99mi |
| 114 Onyx Ave Newport Beach, CA | 3.0 | 2.0 | 1050 | $6,750 | $6.43 | 43d | 1 | 1.02mi |
| 206 Adams St #1 Newport Beach, CA | 3.0 | 3.0 | 1065 | $9,000 | $8.45 | 3d | 1 | 1.04mi |
| 618 W Balboa Blvd Newport Beach, CA | 2.0 | 1.0 | 780 | $4,195 | $5.38 | 43d | 1 | 1.08mi |
| 5100 Colony Plz Newport Beach, CA | 1.0–2.0 | 1.0–2.0 | 1316 | $6,260 | $4.76 | 2d | 10 | 1.14mi |
| 1581 Tustin Ave Costa Mesa, CA | 2.0 | 2.0 | 1100 | $5,400 | $4.91 | 18d | 1 | 1.16mi |
| 384 16th Pl Unit B Costa Mesa, CA | 2.0 | 1.0 | 1015 | $4,400 | $4.33 | 43d | 1 | 1.18mi |
| 1 Park Newport Newport Beach, CA | 3.0 | 1.0–2.5 | 1013 | $4,188 | $4.13 | 1d | 116 | 1.20mi |
| 1114 W Balboa Blvd Unit 1114 Newport Beach, CA | 2.0 | 1.0 | 800 | $3,850 | $4.81 | 24d | 1 | 1.24mi |
| 1741 Tustin Ave #49 Costa Mesa, CA | 2.0 | 2.0 | 1044 | $4,000 | $3.83 | 43d | 1 | 1.24mi |
| 1144 W Balboa Blvd Unit A1 Newport Beach, CA | 2.0 | 1.0 | 1100 | $6,500 | $5.91 | 24d | 1 | 1.26mi |
| 1144 W Balboa Blvd Unit A Newport Beach, CA | 2.0 | 1.0 | 1100 | $4,750 | $4.32 | 24d | 1 | 1.26mi |
| 393 Broadway Costa Mesa, CA | 1.0 | 1.0 | 590 | $2,995 | $5.08 | 24d | 1 | 1.28mi |
| 1000 San Joaquin Plz Newport Beach, CA | 1.0–3.0 | 1.0–2.0 | 1146 | $6,998 | $6.10 | 1d | 32 | 1.29mi |
| 1312 W Balboa Blvd Newport Beach, CA | 1.0 | 1.0 | 600 | $2,675 | $4.46 | 3d | 1 | 1.34mi |
| 1597 San Bernardino Pl Costa Mesa, CA | 2.0 | 1.0 | 900 | $4,500 | $5.00 | 19d | 1 | 1.34mi |
| 2530 W Coast Hwy Newport Beach, CA | 2.0 | 2.0 | 1015 | $4,800 | $4.73 | 7d | 1 | 1.36mi |
| 1338 W Balboa Blvd Unit 4 Newport Beach, CA | 1.0 | 1.0 | 615 | $2,595 | $4.22 | 43d | 1 | 1.36mi |
| 313 W 17th St Costa Mesa, CA | 1.0–2.0 | 1.0 | 750 | $4,225 | $5.63 | 6d | 7 | 1.37mi |
| 326 Rochester St Unit 326B Costa Mesa, CA | 3.0 | 2.0 | 900 | $3,945 | $4.38 | 44d | 1 | 1.37mi |
| 1411 W Bay Ave Newport Beach, CA | 2.0 | 1.0 | 815 | $4,250 | $5.21 | 13d | 1 | 1.38mi |
Listing history 20 events
-
2026-06-18days on market $420,000 Active 30 DOM
-
2026-06-17days on market $420,000 Active 29 DOM
-
2026-06-16days on market $420,000 Active 28 DOM
-
2026-06-15days on market $420,000 Active 27 DOM
-
2026-06-13days on market $420,000 Active 25 DOM
-
2026-06-13days on market $420,000 Active 24 DOM
-
2026-06-09days on market $420,000 Active 21 DOM
-
2026-06-08days on market $420,000 Active 20 DOM
-
2026-06-07days on market $420,000 Active 19 DOM
-
2026-06-04days on market $420,000 Active 16 DOM
-
2026-06-03days on market $420,000 Active 15 DOM
-
2026-06-02days on market $420,000 Active 14 DOM
-
2026-06-01days on market $420,000 Active 13 DOM
-
2026-05-31days on market $420,000 Active 12 DOM
-
2026-05-21price $420,000
-
2026-05-19$475,000 Active
-
2025-07-18historical
-
2025-06-08price $425,000
-
2025-04-30price $449,000
-
2025-01-25$475,000 Active
ⓘ Source: listings_history table (triggers on properties + properties_extension) + one-shot
backfill from property_details.listing_events for pre-trigger history.
Climate risk First Street
- Flood 1/10 Low FEMA zone X (unshaded) · 0% chance over 30 yrs
- Wildfire 1/10 Low
- Heat 5/10 Major 7 d/yr ≥82°F today · 23 d/yr by 30 yrs out
- Wind 1/10 Low
- Air quality 4/10 Moderate 6 unhealthy d/yr today · 6 by 30 yrs out
Nearby sold comps map
Loading sold comps map…
Walkable amenities ~0.75 mi
Loading nearby amenities…
Taxation est. · year 1
- Rental income
- $54,795
- − Mortgage interest
- −$23,527
- − Property taxes
- −$6,300
- − Insurance
- −$2,100
- − Repairs & maintenance
- −$4,384
- − Management
- −$4,384
- − Depreciation
- −$12,218
- Taxable income
- $1,883
- Est. tax owed @ 24.0%
- −$452
- After-tax cash flow
- $8,006/yr
For passive investors: Depreciation is non-cash, so a rental often shows a tax loss while cash-flowing — sheltering income. Rental losses are passive: they offset passive income freely, and up to $25,000/yr can offset ordinary (W-2) income if you actively participate and your MAGI is under $100k (phasing out to $0 by $150k); unused losses carry forward. On sale, claimed depreciation is recaptured at up to 25%, and gains may owe capital-gains tax (a 1031 exchange can defer both). Figures are a year-1 estimate at your 24.0% rate — not tax advice; consult a CPA.
Schools (NCES district)
- District
- Newport-Mesa Unified
- NCES district ID
- 0627240
- Math proficiency
- 46% ▼ -6.00%
- Reading proficiency
- 58% ▼ -5.00%
- Median HH income
- $83,922
- Composite
- 47.64/100
- National rank
- #2248
- State rank
- #106 of 517 in CA
Livability — Newport Beach
- Score
- 76/100
- State rank
- #101
- US rank
- #3645
Category grades
Schools grade is shown separately in the Schools card above.
Census & demographics
- Census place
- Newport Beach, CA
- County
- Orange County · 3,096,323 people
- City population
- 83,845
- Metro
- Los Angeles-Long Beach-Anaheim, CA
- Population (ZIP)
- 34,890
- Household income
- $159,564
- Rent vs Own
- Severe rent burden
- 2633.0
Population outlook (Orange County) Hauer SSP2
- Today (2025)
- 3,477,456 people
- By 2030
- 3,613,117 · +3.9%
- By 2040
- 3,835,945 · +10.3%
- By 2050
- 3,968,736 · +14.1%
- By 2075
- 4,097,053 · +17.8%
- By 2100
- 3,903,633 · +12.3%
Race, ethnicity, and origin ACS 2023
- Neighborhood character
- Predominantly White (74%)
- Race & ethnicity
- White 74% Two or more races 10% Hispanic / Latino 10% Asian 9% Black 1%
- Hispanic origin (detail)
- Mexican 6%
- Common ancestry
- Italian 4% Lithuanian 3% Slovak 3%
- Foreign-born
- 16% · Canada, China, South Korea
- Languages at home
- 81% English-only · Spanish 5% Other Indo-European 5% Chinese 2%
Political lean MEDSL · Orange
- 2024 margin
- Toss-up / Even · D 49.7% · R 47.1% · Other 3.2%
- 2008→2024 swing
- +5.2pp toward D · 2008: -2.6pp · 2024: 2.6pp
- All cycles
- 2024: D+2.6 2020: D+9.0 2016: D+7.7 2012: R+8.3 2008: R+2.6
Not yet ingested
- Civics
- —
Market trends
- HPI YoY
- ▲ 17.65%
- Current HPI
- 537.8751
- Rent YoY
- ▲ 4.11%
- Metro
- Los Angeles-Long Beach-Anaheim, CA
- State GDP YoY
- ▲ 3.21%
- F500 in state
- 116
Industry mix (Fortune 500 HQ in CA)
| Industry | F500 HQs | Revenue |
|---|---|---|
| Technology | 27 | $1,492B |
|
||
| Financial Services | 3 | $174B |
|
||
| Retail | 3 | $44B |
|
||
| Insurance | 3 | $26B |
|
||
| Media / Entertainment | 2 | $115B |
|
||
| Pharmaceuticals / Biotech | 2 | $62B |
|
||
Price history
-11.6% since first listed6 events — show timeline
- 2026-05-21 Price Changed $420,000 CRMLS
- 2026-05-19 Listed $475,000 CRMLS
- 2025-07-18 Listing Removed — CRMLS
- 2025-06-08 Price Changed $425,000 CRMLS
- 2025-04-30 Price Changed $449,000 CRMLS
- 2025-01-25 Listed $475,000 CRMLS
Property tax history
-0.2%/yrLatest (2025): $58 · -0.4% YoY. Source: county tax records.
Cash-flow waterfall
monthlySold comps — $/sqft
last 12 mo · ≤1 miLoading sold comps…