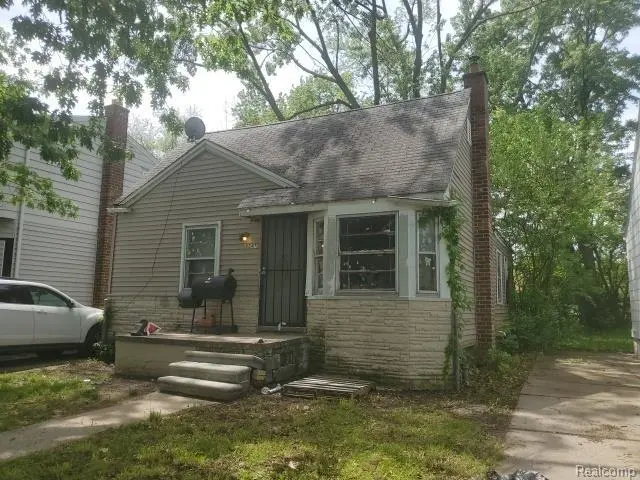
8247 Auburn St · Detroit, MI
Flood risk 1/10 · Minimal
- FEMA flood zone
- X (unshaded)
- Chance of flooding over 30 yrs
- 0.0%
- Est. flood insurance / yr
- $473 – $860
Fire risk 1/10 · Minimal
- Est. fire insurance / yr
- $784 – $1,456
Heat risk 3/10 · Minor
- Hot days now (above 99°F)
- 7 days/yr
- Hot days in 30 yrs
- 14 days/yr
Wind risk 2/10 · Minimal
- Chance of severe wind over 30 yrs
- —
Air-quality risk 3/10 · Minor
- Unhealthy air days now
- 2 days/yr
- Unhealthy air days in 30 yrs
- 5 days/yr
Risk factors via First Street. Map © Google.
Why this score? — see what drove the B- grade
The composite is a weighted blend of 9 inputs, each scored 0–100. Each bar is that input's sub-score; the figure is the points it added to the 100-point composite (weight × sub-score).
- Cash flow +30.0/30.0
- 1% rule +10.0/10.0
- DSCR +10.0/10.0
- ARV discount +5.9/15.0
- Livability +3.7/5.0
- Condition / age +2.5/5.0
- Rent growth +1.9/5.0
- Schools +1.3/10.0
- Appreciation +0.0/10.0
$48,500
🖨 Deal sheet 📄 Offer letter ✓ Due diligence
Listing remarks MLS
INVESTOR SPECIAL | FHA 203(k) OPPORTUNITY | VALUE-ADD DETROIT RANCH Attention investors, rehabbers, and savvy homebuyers! Welcome to 8247 Auburn, a spacious 3-bedroom ranch packed with potential and positioned for significant upside. Whether you're looking for your next fix-and-flip, BRRRR investment, rental property, or a home to renovate with FHA 203(k) financing, this is an opportunity you won't want to miss. The major systems have already been addressed, with the electrical, plumbing, and HVAC systems reported to be in solid condition, allowing the next owner to focus primarily on cosmetic improvements and value-enhancing updates. The home features a functional layout, generous room sizes, a large backyard, basement space for storage or future finishing possibilities, and plenty of room to build equity. With some vision and renovations, this property has the potential to become a beautiful owner-occupied residence or a strong cash-flowing investment. Located near schools, shopping, restaurants, major roadways, and everyday conveniences, the location adds even more appeal. Property Highlights: 3 Bedrooms Functional Ranch Floor Plan Electrical, Plumbing & HVAC Systems in Place Basement for Storage & Additional Potential Large Backyard Strong Rental & Resale Potential Ideal for FHA 203(k) Financing Perfect for Fix & Flip, BRRRR, Rental, or Owner-Occupant Renovation Properties with solid mechanical systems and this much upside are becoming increasingly difficult to find. Bring your contractor, your vision, and your creativity - this is your chance to transform a diamond in the rough into something special. Sold As-Is. Buyer to verify all information. Schedule your showing today and explore the possibilities! ADDITIONAL PHOTOS AVAILABLE UPON REQUEST.
Key facts
- Large backyard
- Resale potential
- Basement for storage
Tags
Property features AI
Finance
- Other: Lot approximately 0.11 acres (35 x 129)
- Financial info: No investor or income/expense details provided
- HOA & community: No HOA information provided
Exterior
- Parking: No garage
- Security: No security features listed
- Utilities: Public sewer; Water available; Electrical service with circuit breakers and 220 volts
- Home design: Single-family residence; One level; Ground-level entry with steps
- Construction: Brick veneer and vinyl siding exterior; Block foundation; Built with traditional construction (year not provided)
- Exterior features: Front porch; Asphalt roof; Paved road access
Interior
- Kitchen: No specific kitchen appliance list provided
- Bedrooms: 5 total rooms (includes bedrooms and living areas)
- Flooring: No flooring details provided
- Bathrooms: 1 full bathroom
- Heating & cooling: Forced air heating; Natural gas heating; No cooling
- Interior features: Gas water heater; Full unfinished basement
- Laundry & utility: No specific laundry appliances listed
Neighborhood map
What this means for you Summary
Snapshot
- This is a 2-bed/1.0-bath single-family listed at $48k.
Deal economics
- At list price, monthly cash flow is $581 ($7k/yr) — positive.
- The deal already cash-flows at list — no discount required.
- Meets the 1% rule at list price ($1k rent vs $48k).
- Cap rate 20.7% vs local median 10.2% in Detroit — top-decile yield for the area; either an underpriced asset or a hidden risk that comps aren't pricing in. Stress-test before assuming the spread holds.
Location & tenants
- Location reads 73/100 on livability (#218 in MI) — a middle-class / working-renter tenant base. Strengths: amenities A+, commute A+, cost of living A+; Watch: schools F, crime F, employment F.
- Detroit Public Schools Community District (urban): math 10% / reading 24% proficiency, ranked #499 of 540 in MI (top 92%) — low school quality limits family demand, transient renter base, plan for 1-2y turnover; 90% free/reduced lunch — lower-income household profile, screen leases tightly.
- Market conditions: Rents soft (-2.3%/yr); 363 active listings in the ZIP; 38 comparable units currently listed for rent nearby; rentals lingering (median 44d on market — plan ~5-8 weeks vacancy on turnover, expect pricing pressure); 68% of comp listings sitting > 30 days — soft ceiling on asking rent; lower-income renter base — watch delinquency; 2,639 units permitted in Wayne County in 2024 (1,216 in 5+ unit buildings).
- At $1,160/mo this rent would consume 45% of the median local household income ($31k/yr) (locally 4144% of renters already pay >50% of income on rent) — very limited rent-growth headroom before tenants either downsize or default.
Forward outlook
- Local home prices are declining (-3.0%/yr); year-one equity from $335 of loan paydown is wiped out by about $1k of value loss. Plan a longer hold.
- Wayne County population projected at -17% by 2050 — secular population decline; favor cash flow + early exit over multi-decade hold.
- At projected returns (-3.0% appreciation + 0.0% rent growth), your $14k cash investment doubles in ~3 years — after that, you're playing with house money.
Negotiation context
- Only 7 days on market — expect competitive offers; lowballing is unlikely to land.
- 8 sale attempts since 30y ago with the ask held roughly flat each time — persistent listings suggest the price (not the market) is what's stuck; bring a comps-based counter.
Risks & watch-outs
- Watch-outs: built in 1948 — expect roof / HVAC / electrical / plumbing capex.
Questions for the listing agent
- Built in 1948 — when were the roof, HVAC, electrical panel, plumbing, and water heater last replaced?
- Is there a deadline driving the sale (1031 exchange, divorce, estate, relocation)? That informs how much negotiation room exists.
- Schools are F-rated, which usually means shorter tenancies and higher turnover. Who's the typical renter profile here, and what's been the actual vacancy rate?
- Crime grade is F in this area — have there been break-ins, vandalism, or insurance claims at this property in the last 3 years? What carrier currently insures it and at what premium?
- What's the average days-on-market for RENTAL listings here right now (not sales)? A rising rental-DOM trend means longer vacancies and softer asking-rent achievability than the comps imply.
- What's the recent tenant-quality profile in this submarket — average credit score on applications, eviction rate, late-payment / NSF rate, and stable-employment percentage? A property-management company in the area should have these aggregated.
- How much new for-sale + rental construction is in the pipeline within 1–3 miles? Heavy new supply typically softens prices + rents 12–24 months out; constrained supply supports both.
Investment metrics
- 1% rule
- 2.39% ✓
- Cap rate
- 20.67%
- Cash-on-cash
- 51.36%
- DSCR
- 3.29
- GRM
- 3.5
CMA / ARV
- ARV (on-the-fly)
- $46,818
- Comps found
- 12
Show comp detail 12 sales within ~0.75 mi
| Address | Dist | Beds/Ba | Sqft | Sold | Price | $/sf | Match |
|---|---|---|---|---|---|---|---|
| 8225 Grandville Ave | 0.19mi | 2/1.0 | 906 (-1%) | 2mo | $36,500 | $40 | 88 |
| 8277 Stout St | 0.31mi | 3/1.0 (+1) | 879 (-4%) | 0mo | $45,000 | $51 | 73 |
| 7756 Westwood St | 0.30mi | 3/1.0 (+1) | 871 (-5%) | 2mo | $90,000 | $103 | 71 |
| 8686 Artesian St | 0.49mi | 3/1.0 (+1) | 864 (-6%) | 2mo | $35,000 | $41 | 61 |
| 9012 Pierson St | 0.71mi | 3/1.0 (+1) | 910 (-1%) | 0mo | $60,000 | $66 | 60 |
| 8309 Brace St | 0.50mi | 3/1.5 (+1) | 864 (-6%) | 1mo | $28,500 | $33 | 59 |
| 7690 Heyden St | 0.39mi | 3/1.0 (+1) | 1,019 (+11%) | 1mo | $73,000 | $72 | 58 |
| 8234 Patton St | 0.41mi | 3/1.0 (+1) | 1,010 (+10%) | 2mo | $60,000 | $59 | 58 |
| 7296 Auburn St | 0.57mi | 3/1.0 (+1) | 968 (+5%) | 2mo | $38,000 | $39 | 58 |
| 9244 Heyden | 0.67mi | 2/1.0 | 801 (-13%) | 0mo | $35,000 | $44 | 47 |
| 8449 Penrod St | 0.70mi | 3/1.0 (+1) | 1,011 (+10%) | 0mo | $95,000 | $94 | 45 |
| 9116 Patton St | 0.69mi | 3/1.0 (+1) | 1,029 (+12%) | 1mo | $45,000 | $44 | 42 |
Match score weights: distance 35% · size 25% · config 20% · recency 20%. Top-matched comps best support the ARV.
Projected returns pro-forma
-3.0% appreciation · 0.0% rent growth · sell at horizon
- IRR
- 45.8%
- Equity multiple
- 2.90×
- Total profit
- $25,775
- Equity at exit
- $7,232
- IRR
- 50.3%
- Equity multiple
- 5.20×
- Total profit
- $57,043
- Equity at exit
- $4,193
Cash invested: $13,580 (down + closing). Projections, not guarantees.
Landlord ↔ Tenant lean methodology
- Overall (STATE)
- 62 Landlord-Friendly
- State Michigan
- 62 Landlord-Friendly · EVEN
- County
- — inherits STATE
- City
- — inherits STATE
ZIP-level market 48228
- Rents YoY
- -2.3%
- Active inventory
- 363
- Price-to-rent
- 3.5×
Monthly cashflow live
- Estimated rent
- $1,160 high interval (Pro) →
- Mortgage (P&I)
- −$254
- Tax est. 1.5%
- −$61 /mo · $728/yr
- Insurance
- −$20
- HOA
- −$0
- Vacancy / Maint / Mgmt
- −$244
- Net cashflow
- $581
Break-even live
UW: 25.0% down · 7.5% · 30yr · 1.5% tax · 5.0% vac · 8.0% maint · 8.0% mgmt
Financing live
Cash to close
- Down payment
- $12,125
- Closing costs
- $1,455
- Reserves months
- —
- Total cash needed
- —
Loan-product check · same deal, 3 products live
Conventional
25% down · 7.5% · 30yr
- Down + closing
- —
- Monthly P&I
- —
- Monthly cashflow
- —
- DSCR
- —
- Eligible?
- —
Personal DTI + credit; lowest rate.
DSCR
20% down · 8.5% · 30yr
- Down + closing
- —
- Monthly P&I
- —
- Monthly cashflow
- —
- DSCR
- —
- Eligible?
- —
No personal income docs; deal must DSCR.
Hard money
10% down · 12.0% · 12mo
- Down + closing
- —
- Monthly P&I
- —
- Monthly cashflow
- —
- DSCR
- —
- Eligible?
- —
Short-term bridge; refi at stabilization.
Rent comps 38 comps
| Address | Beds | Baths | Sqft | Rent | $/sqft | DOM | Units | Dist |
|---|---|---|---|---|---|---|---|---|
| 8283 Vaughan St Detroit, MI | 3.0 | 1.0 | 1058 | $1,294 | $1.22 | 5d | 1 | 0.17mi |
| 7794 Vaughan St Detroit, MI | 3.0 | 1.0 | 1000 | $1,450 | $1.45 | 17d | 1 | 0.27mi |
| 20431 Tireman St Detroit, MI | 3.0 | 1.0 | 1020 | $1,350 | $1.32 | 17d | 1 | 0.36mi |
| 19301 Joy Rd Apt 1 Detroit, MI | 2.0 | 1.0 | 750 | $1,100 | $1.47 | 44d | 1 | 0.36mi |
| 7635 Evergreen Ave Detroit, MI | 3.0 | 1.0 | 690 | $1,350 | $1.96 | 44d | 1 | 0.40mi |
| 7411 Stout St Detroit, MI | 3.0 | 1.0 | 888 | $1,428 | $1.61 | 12d | 1 | 0.55mi |
| 8270 Trinity St Detroit, MI | 3.0 | 1.0 | 806 | $1,528 | $1.90 | 44d | 1 | 0.63mi |
| 9090 Stahelin Ave Detroit, MI | 2.0 | 1.0 | 787 | $1,250 | $1.59 | 44d | 1 | 0.72mi |
| 18401 Joy Rd Unit 8 Detroit, MI | 1.0 | 1.0 | 600 | $875 | $1.46 | 44d | 1 | 0.76mi |
| 8451 Rosemont Ave Detroit, MI | 3.0 | 1.0 | 867 | $1,150 | $1.33 | 44d | 1 | 0.78mi |
| 9059 Burt Rd Detroit, MI | 3.0 | 1.0 | 980 | $1,400 | $1.43 | 44d | 1 | 0.78mi |
| 8262 Rosemont Ave Detroit, MI | 3.0 | 1.0 | 836 | $1,200 | $1.44 | 5d | 1 | 0.79mi |
| 19449 W Chicago St Detroit, MI | 3.0 | 1.5 | 950 | $1,500 | $1.58 | 44d | 1 | 0.80mi |
| 20237 W Chicago Detroit, MI | 1.0 | 1.0 | 650 | $850 | $1.31 | 44d | 1 | 0.84mi |
| 9401 Fielding St Detroit, MI | 2.0 | 1.0 | 1000 | $900 | $0.90 | 44d | 1 | 0.87mi |
| 8850 Rosemont Ave Detroit, MI | 3.0 | 1.0 | 933 | $1,100 | $1.18 | 18d | 1 | 0.88mi |
| 9410 Patton St Detroit, MI | 2.0 | 1.0 | 1000 | $900 | $0.90 | 44d | 1 | 0.88mi |
| 20529 W Chicago Detroit, MI | 2.0 | 1.0 | 1000 | $900 | $0.90 | 44d | 1 | 0.88mi |
| 9404 Patton St Detroit, MI | 2.0 | 1.0 | 1000 | $900 | $0.90 | 44d | 1 | 0.88mi |
| 20541 W Chicago Detroit, MI | 2.0 | 1.0 | 1000 | $900 | $0.90 | 44d | 1 | 0.88mi |
| 20545 W Chicago Detroit, MI | 2.0 | 1.0 | 1000 | $900 | $0.90 | 44d | 1 | 0.88mi |
| 20547 W Chicago Detroit, MI | 2.0 | 1.0 | 1000 | $900 | $0.90 | 44d | 1 | 0.89mi |
| 20619 W Chicago Detroit, MI | 2.0 | 1.0 | 950 | $1,200 | $1.26 | 44d | 1 | 0.90mi |
| 20522 W Chicago Detroit, MI | 2.0 | 1.0 | 1000 | $950 | $0.95 | 44d | 1 | 0.90mi |
| 20550 W Chicago Detroit, MI | 2.0 | 1.0 | 1000 | $900 | $0.90 | 44d | 1 | 0.91mi |
| 6980 Town Ln Dearborn Heights, MI | 1.0 | 1.0 | 600 | $895 | $1.49 | 17d | 1 | 0.93mi |
| 20921 W Chicago Detroit, MI | 2.0 | 1.0 | 1000 | $950 | $0.95 | 44d | 1 | 1.01mi |
| 20935 W Chicago Detroit, MI | 2.0 | 1.0 | 1000 | $900 | $0.90 | 44d | 1 | 1.02mi |
| 20937 W Chicago Detroit, MI | 2.0 | 1.0 | 1000 | $950 | $0.95 | 44d | 1 | 1.02mi |
| 9416 Trinity St Detroit, MI | 2.0 | 1.0 | 1000 | $950 | $0.95 | 44d | 1 | 1.02mi |
| 20945 W Chicago Detroit, MI | 2.0 | 1.0 | 1000 | $950 | $0.95 | 44d | 1 | 1.03mi |
| 18450 W Chicago Detroit, MI | 1.0–2.0 | 1.0 | 687 | $1,117 | $1.62 | 2d | 15 | 1.06mi |
| 6490 Stahelin Ave Detroit, MI | 3.0 | 1.0 | 960 | $1,299 | $1.35 | 17d | 1 | 1.11mi |
| 9108 Archdale St Detroit, MI | 3.0 | 1.0 | 1000 | $1,300 | $1.30 | 5d | 1 | 1.12mi |
| 11652 Fielding St Detroit, MI | 3.0 | 1.0 | 1000 | $1,386 | $1.39 | 44d | 1 | 1.41mi |
| 22330 W Warren Ave Redford Charter Twp, MI | 2.0 | 1.0 | 750 | $1,200 | $1.60 | 44d | 1 | 1.44mi |
| 6761 Memorial Ave Detroit, MI | 3.0 | 1.0 | 1060 | $1,100 | $1.04 | 24d | 1 | 1.44mi |
| 5965 Evergreen Rd Dearborn Heights, MI | 1.0–2.0 | 1.0 | 825 | $1,350 | $1.64 | 5d | 1 | 1.45mi |
Listing history 7 events
-
2026-06-18days on market $48,500 Active 7 DOM
-
2026-06-17days on market $48,500 Active 6 DOM
-
2026-06-16days on market $48,500 Active 5 DOM
-
2026-06-15days on market $48,500 Active 4 DOM
-
2026-06-13days on market $48,500 Active 2 DOM
-
2026-06-13remarks 699-char remark
-
2026-06-13$48,500 Active 1 DOM
ⓘ Source: listings_history table (triggers on properties + properties_extension) + one-shot
backfill from property_details.listing_events for pre-trigger history.
Climate risk First Street
- Flood 1/10 Low FEMA zone X (unshaded) · 0% chance over 30 yrs
- Wildfire 1/10 Low
- Heat 3/10 Moderate 7 d/yr ≥99°F today · 14 d/yr by 30 yrs out
- Wind 2/10 Low
- Air quality 3/10 Moderate 2 unhealthy d/yr today · 5 by 30 yrs out
Nearby sold comps map
Loading sold comps map…
Walkable amenities ~0.75 mi
Loading nearby amenities…
Taxation est. · year 1
- Rental income
- $13,919
- − Mortgage interest
- −$2,717
- − Property taxes
- −$728
- − Insurance
- −$242
- − Repairs & maintenance
- −$1,114
- − Management
- −$1,114
- − Depreciation
- −$1,411
- Taxable income
- $6,595
- Est. tax owed @ 24.0%
- −$1,583
- After-tax cash flow
- $5,392/yr
For passive investors: Depreciation is non-cash, so a rental often shows a tax loss while cash-flowing — sheltering income. Rental losses are passive: they offset passive income freely, and up to $25,000/yr can offset ordinary (W-2) income if you actively participate and your MAGI is under $100k (phasing out to $0 by $150k); unused losses carry forward. On sale, claimed depreciation is recaptured at up to 25%, and gains may owe capital-gains tax (a 1031 exchange can defer both). Figures are a year-1 estimate at your 24.0% rate — not tax advice; consult a CPA.
Schools (NCES district)
- District
- Detroit Public Schools Community District
- NCES district ID
- 2601103
- Math proficiency
- 10% ▼ -2.00%
- Reading proficiency
- 24% ▲ 6.00%
- Median HH income
- $25,815
- Composite
- 13.06/100
- National rank
- #9564
- State rank
- #499 of 540 in MI
Livability — Detroit
- Score
- 73/100
- State rank
- #218
- US rank
- #5427
Category grades
Schools grade is shown separately in the Schools card above.
Census & demographics
- Census place
- Detroit, MI
- County
- Wayne County · 1,562,939 people
- City population
- 572,865
- Metro
- Detroit-Warren-Dearborn, MI
- Population (ZIP)
- 50,117
- Household income
- $30,680
- Rent vs Own
- Severe rent burden
- 4144.0
Population outlook (Wayne County) Hauer SSP2
- Today (2025)
- 1,675,273 people
- By 2030
- 1,620,300 · -3.3%
- By 2040
- 1,502,341 · -10.3%
- By 2050
- 1,384,039 · -17.4%
- By 2075
- 1,124,592 · -32.9%
- By 2100
- 881,193 · -47.4%
Race, ethnicity, and origin ACS 2023
- Neighborhood character
- Predominantly Black (71%)
- Race & ethnicity
- Black 71% White 16% Two or more races 7% Hispanic / Latino 6%
- Hispanic origin (detail)
- Mexican 3% Puerto Rican 2%
- Common ancestry
- Arab 2% Romanian 2% Lithuanian 1%
- Foreign-born
- 11% · Canada
- Languages at home
- 82% English-only · Arabic 11% Spanish 5%
Political lean MEDSL · Wayne
- 2024 margin
- Strong D (+29.0) · D 62.7% · R 33.7% · Other 3.6%
- 2008→2024 swing
- -20.5pp toward R · 2008: 49.5pp · 2024: 29.0pp
- All cycles
- 2024: D+29.0 2020: D+38.1 2016: D+37.3 2012: D+46.9 2008: D+49.5
Not yet ingested
- Civics
- —
Market trends
- HPI YoY
- ▼ -160.81%
- Current HPI
- 168.6843
- Rent YoY
- ▼ -2.30%
- Metro
- Detroit-Warren-Dearborn, MI
- State GDP YoY
- ▲ 1.37%
- F500 in state
- 28
Industry mix (Fortune 500 HQ in MI)
| Industry | F500 HQs | Revenue |
|---|---|---|
| Automotive Parts | 3 | $48B |
|
||
| Automotive | 2 | $372B |
|
||
| Chemicals | 1 | $45B |
|
||
| Automotive Retail | 1 | $29B |
|
||
| Healthcare / Medical Devices | 1 | $23B |
|
||
| Automotive Technology | 1 | $20B |
|
||
Price history
+52.0% since first listed17 events — show timeline
- 2026-06-11 Listed $48,500 REALCOMP
- 2026-06-10 Listed $48,500 MiRealSource-MiMLS
- 2007-10-11 Sold (Public Records) $84,000 Public Records
- 2007-09-17 Listing Removed — REALCOMP
- 2007-04-26 Listing Removed — REALCOMP
- 2007-04-26 Listed $12,900 REALCOMP
- 2007-01-25 Listed $31,900 REALCOMP
- 2006-07-28 Sold (Public Records) $84,000 Public Records
- 2006-01-04 Listing Removed — REALCOMP
- 2005-12-27 Listed $99,000 REALCOMP
- 2005-08-02 Listing Removed — MiRealSource-MiMLS
- 2005-08-02 Listing Removed — REALCOMP
- 2005-04-13 Listed $90,000 MiRealSource-MiMLS
- 2005-04-13 Listed $90,000 REALCOMP
- 1997-02-25 Sold (Public Records) $33,000 Public Records
- 1996-11-18 Sold (MLS) $33,000 REALCOMP
- 1996-09-21 Listed $31,900 REALCOMP
Property tax history
+8.2%/yrLatest (2025): $2,564 · -0.8% YoY. Source: county tax records.
Cash-flow waterfall
monthlySold comps — $/sqft
last 12 mo · ≤1 miLoading sold comps…