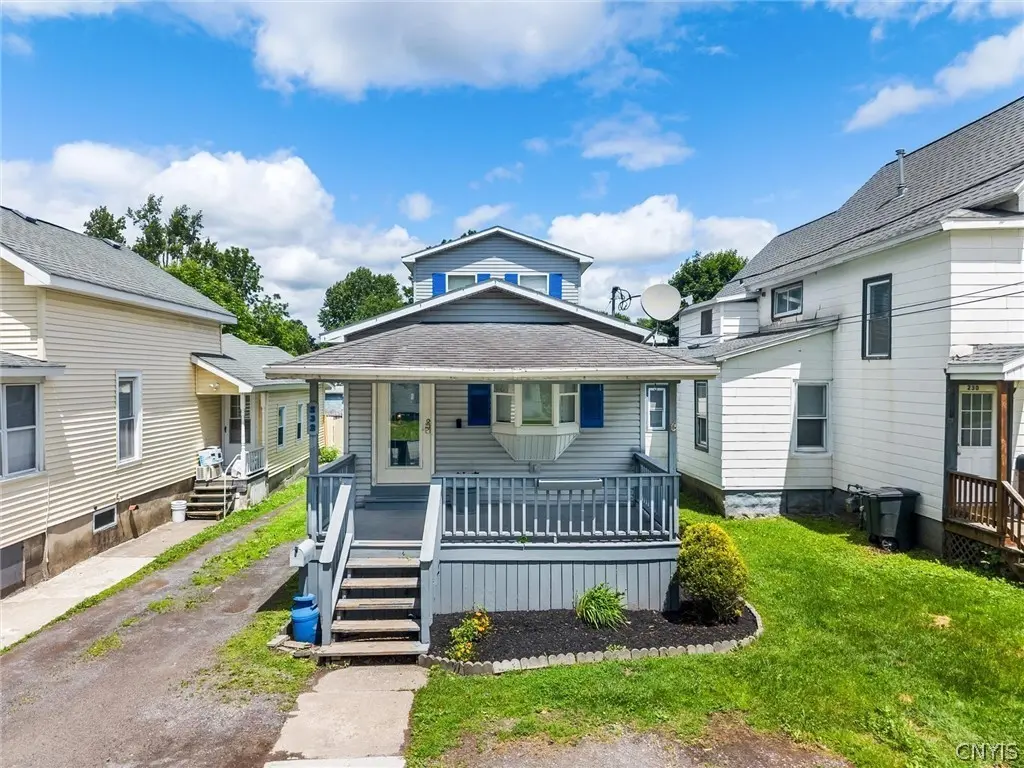
232 N Main St · Oneida, NY
Flood risk 1/10 · Minimal
- FEMA flood zone
- X (unshaded)
- Chance of flooding over 30 yrs
- 0.0%
- Est. flood insurance / yr
- $473 – $860
Fire risk 3/10 · Minor
- Est. fire insurance / yr
- $691 – $1,283
Heat risk 3/10 · Minor
- Hot days now (above 94°F)
- 7 days/yr
- Hot days in 30 yrs
- 17 days/yr
Wind risk 1/10 · Minimal
- Chance of severe wind over 30 yrs
- 0.0%
Air-quality risk 2/10 · Minimal
- Unhealthy air days now
- 0 days/yr
- Unhealthy air days in 30 yrs
- 1 days/yr
Risk factors via First Street. Map © Google.
Why this score? — see what drove the D+ grade
The composite is a weighted blend of 9 inputs, each scored 0–100. Each bar is that input's sub-score; the figure is the points it added to the 100-point composite (weight × sub-score).
- ARV discount +14.3/15.0
- Cash flow +12.5/30.0
- Schools +4.1/10.0
- 1% rule +3.9/10.0
- DSCR +3.7/10.0
- Livability +3.1/5.0
- Rent growth +2.5/5.0
- Condition / age +2.5/5.0
- Appreciation +0.0/10.0
$169,900
🖨 Deal sheet 📄 Offer letter ✓ Due diligence
Listing remarks
Don't let the shotgun-style design fool you, this home is shockingly spacious inside! Offering 3 bedrooms, 2 full bathrooms and multiple levels of living space, this unique Oneida property delivers far more room than you'd expect from the curb at a fantastic price. The main level features an open-concept living, dining and kitchen with vaulted ceiling. Upstairs you'll find the private primary suite complete with walk in closet. Need even more space? The basement is almost completely finished! Charming open front porch plus rear deck overlooking the backyard. Unique, spacious and conveniently located just walking distance to downtown Oneida's shops and restaurants .
Key facts
- Open concept living
- Finished basement
- Open front porch
Tags
Property features AI
Exterior
- Parking: No garage
- Utilities: Public water connected; Sewer connected
- Home design: 2-story property; Resale condition; Vinyl siding
- Construction: Block foundation; Vinyl siding construction
- Exterior features: Gravel driveway; Rectangular residential lot, approximately 0.12 acres (21 x 240); City street frontage
Interior
- Kitchen: Electric oven and electric range; Microwave; Refrigerator
- Bedrooms: 2 bedrooms on the main level
- Flooring: Tile; Varies
- Bathrooms: 2 full bathrooms total; 1 bathroom on the main level
- Heating & cooling: Gas forced-air heating
- Interior features: Breakfast bar; Bedroom on main level; Full, partially finished basement
- Laundry & utility: Water heater
Neighborhood map
What this means for you Summary
Snapshot
- This is a 3-bed/2.5-bath single-family listed at $170k.
Deal economics
- At list price, monthly cash flow is $-23 ($-280/yr) — negative.
- To cash-flow at today's rent, offer at most $166k (2.4% below list).
- To meet the 1% rule (rent ≥ 1% of price), the offer needs to be $151k (11.2% below list).
- Recommended offer: $151k (11.2% below list) — sets the bar for 1% rule.
- Cap rate 6.1% vs local median 4.0% in Oneida — top-decile yield for the area; either an underpriced asset or a hidden risk that comps aren't pricing in. Stress-test before assuming the spread holds.
Location & tenants
- Location reads 61/100 on livability (#924 in NY) — a middle-class / working-renter tenant base. Strengths: cost of living A+, housing A+; Watch: schools C-, employment C-, health & safety C-.
- Oneida City School District (town): math 43% / reading 54% proficiency, ranked #421 of 590 in NY (top 71%) — families likely to look elsewhere, expect single-tenant / working-renter base with shorter leases.
- Market conditions: 65 active listings in the ZIP; 137 units permitted in Madison County in 2024 (46 in 5+ unit buildings).
Forward outlook
- Local home prices are declining (-3.0%/yr); year-one equity from $1k of loan paydown is wiped out by about $5k of value loss. Plan a longer hold.
- Madison County population projected at -24% by 2050 — secular population decline; favor cash flow + early exit over multi-decade hold.
Negotiation context
- Only 2 days on market — expect competitive offers; lowballing is unlikely to land.
- Current owner paid $11k; list at $170k implies a 1445% gain — meaningful room to come down on a strong offer.
Questions for the listing agent
- What do current leases actually rent for vs. the listed asking? Can we see a recent rent roll and the last 12 months of T-12 income?
- Is there a deadline driving the sale (1031 exchange, divorce, estate, relocation)? That informs how much negotiation room exists.
- Crime grade is F in this area — have there been break-ins, vandalism, or insurance claims at this property in the last 3 years? What carrier currently insures it and at what premium?
- The area grade is low — what's the realistic commute time and amenity access for the typical tenant pool here? Any planned neighborhood developments (good or bad) we should know about?
- What's the average days-on-market for RENTAL listings here right now (not sales)? A rising rental-DOM trend means longer vacancies and softer asking-rent achievability than the comps imply.
- What's the recent tenant-quality profile in this submarket — average credit score on applications, eviction rate, late-payment / NSF rate, and stable-employment percentage? A property-management company in the area should have these aggregated.
- How much new for-sale + rental construction is in the pipeline within 1–3 miles? Heavy new supply typically softens prices + rents 12–24 months out; constrained supply supports both.
Investment metrics
- 1% rule
- 0.89% ✗
- Cap rate
- 6.13%
- Cash-on-cash
- -0.59%
- DSCR
- 0.97
- GRM
- 9.4
CMA / ARV
- ARV (on-the-fly)
- $200,160
- Comps found
- 12
Show comp detail 12 sales within ~0.75 mi
| Address | Dist | Beds/Ba | Sqft | Sold | Price | $/sf | Match |
|---|---|---|---|---|---|---|---|
| 231 N Main St | 0.03mi | 3/1.5 | 1,435 (-0%) | 5mo | $50,000 | $35 | 90 |
| 215 North St | 0.21mi | 3/1.0 | 1,440 (0%) | 2mo | $200,000 | $139 | 82 |
| 308 Chappell St | 0.19mi | 3/2.0 | 1,500 (+4%) | 3mo | $225,000 | $150 | 80 |
| 229 Boston St | 0.25mi | 4/1.5 (+1) | 1,449 (+1%) | 6mo | $164,900 | $114 | 74 |
| 212 N Broad St | 0.09mi | 3/2.0 | 1,314 (-9%) | 8mo | $190,000 | $145 | 72 |
| 309 Williams St | 0.20mi | 2/2.0 (-1) | 1,368 (-5%) | 6mo | $162,000 | $118 | 70 |
| 207 N Lake St | 0.21mi | 3/2.0 | 1,632 (+13%) | 7mo | $55,000 | $34 | 60 |
| 410 W Elm St | 0.30mi | 2/1.5 (-1) | 1,296 (-10%) | 10mo | $180,000 | $139 | 52 |
| 510 Fitch St | 0.57mi | 2/1.0 (-1) | 1,344 (-7%) | 3mo | $111,000 | $83 | 49 |
| 318 Earl Ave | 0.68mi | 4/2.0 (+1) | 1,575 (+9%) | 1mo | $232,000 | $147 | 45 |
| 522 Fitch St | 0.62mi | 2/1.0 (-1) | 1,360 (-6%) | 10mo | $85,000 | $63 | 43 |
| 330 Seneca St | 0.66mi | 3/2.0 | 1,236 (-14%) | 6mo | $180,000 | $146 | 39 |
Match score weights: distance 35% · size 25% · config 20% · recency 20%. Top-matched comps best support the ARV.
Projected returns pro-forma
-3.0% appreciation · 3.0% rent growth · sell at horizon
- IRR
- -17.2%
- Equity multiple
- 0.39×
- Total profit
- $-28,970
- Equity at exit
- $25,333
- IRR
- -9.1%
- Equity multiple
- 0.43×
- Total profit
- $-26,946
- Equity at exit
- $14,690
Cash invested: $47,572 (down + closing). Projections, not guarantees.
Landlord ↔ Tenant lean methodology
- Overall (STATE)
- 15 Strongly Tenant-Friendly
- State New York
- 15 Strongly Tenant-Friendly · D+10
- County
- — inherits STATE
- City
- — inherits STATE
ZIP-level market 13421
- Home prices YoY
- -5.1%
- Active inventory
- 65
- Price-to-rent
- 9.4×
Monthly cashflow live
- Estimated rent
- $1,508 medium interval (Pro) →
- Mortgage (P&I)
- −$891
- Tax from tax record
- −$253 /mo · $3,039/yr
- Insurance
- −$71
- HOA
- −$0
- Vacancy / Maint / Mgmt
- −$317
- Net cashflow
- $-23
Break-even live
UW: 25.0% down · 7.5% · 30yr · 1.5% tax · 5.0% vac · 8.0% maint · 8.0% mgmt
Financing live
Cash to close
- Down payment
- $42,475
- Closing costs
- $5,097
- Reserves months
- —
- Total cash needed
- —
Loan-product check · same deal, 3 products live
Conventional
25% down · 7.5% · 30yr
- Down + closing
- —
- Monthly P&I
- —
- Monthly cashflow
- —
- DSCR
- —
- Eligible?
- —
Personal DTI + credit; lowest rate.
DSCR
20% down · 8.5% · 30yr
- Down + closing
- —
- Monthly P&I
- —
- Monthly cashflow
- —
- DSCR
- —
- Eligible?
- —
No personal income docs; deal must DSCR.
Hard money
10% down · 12.0% · 12mo
- Down + closing
- —
- Monthly P&I
- —
- Monthly cashflow
- —
- DSCR
- —
- Eligible?
- —
Short-term bridge; refi at stabilization.
Listing history 3 events
-
2026-06-18days on market $169,900 Active 2 DOM
-
2026-06-17remarks 675-char remark
-
2026-06-17$169,900 Active 1 DOM
ⓘ Source: listings_history table (triggers on properties + properties_extension) + one-shot
backfill from property_details.listing_events for pre-trigger history.
Tax reassessment forecast NY · Partial reset (capped growth)
- Current annual tax
- $3,039 · $253/mo
- Projected year-2 tax
- $3,039 · $253/mo
- Expected delta
- $0/yr ($0/mo · 0.0%)
ⓘ Screening estimate from a state-policy table — verify with the county assessor before closing.
Climate risk First Street
- Flood 1/10 Low FEMA zone X (unshaded) · 0% chance over 30 yrs
- Wildfire 3/10 Moderate
- Heat 3/10 Moderate 7 d/yr ≥94°F today · 17 d/yr by 30 yrs out
- Wind 1/10 Low 0% chance of damaging wind over 30 yrs
- Air quality 2/10 Low 0 unhealthy d/yr today · 1 by 30 yrs out
Nearby sold comps map
Loading sold comps map…
Walkable amenities ~0.75 mi
Loading nearby amenities…
Taxation est. · year 1
- Rental income
- $18,101
- − Mortgage interest
- −$9,517
- − Property taxes
- −$3,039
- − Insurance
- −$850
- − Repairs & maintenance
- −$1,448
- − Management
- −$1,448
- − Depreciation
- −$4,943
- Taxable loss
- −$3,143
- Est. tax savings @ 24.0%
- +$754
- After-tax cash flow
- $474/yr
For passive investors: Depreciation is non-cash, so a rental often shows a tax loss while cash-flowing — sheltering income. Rental losses are passive: they offset passive income freely, and up to $25,000/yr can offset ordinary (W-2) income if you actively participate and your MAGI is under $100k (phasing out to $0 by $150k); unused losses carry forward. On sale, claimed depreciation is recaptured at up to 25%, and gains may owe capital-gains tax (a 1031 exchange can defer both). Figures are a year-1 estimate at your 24.0% rate — not tax advice; consult a CPA.
Schools (NCES district)
- District
- Oneida City School District
- NCES district ID
- 3600013
- Math proficiency
- 43% ▼ -11.00%
- Reading proficiency
- 54% ▲ 12.00%
- Median HH income
- $45,791
- Composite
- 41.1/100
- National rank
- #3568
- State rank
- #421 of 590 in NY
Livability — Oneida
- Score
- 61/100
- State rank
- #924
- US rank
- #18033
Category grades
Schools grade is shown separately in the Schools card above.
Census & demographics
- Census place
- Oneida, NY
- City population
- 12,742
- Population (ZIP)
- 12,742
Population outlook (Madison County) Hauer SSP2
- Today (2025)
- 69,528 people
- By 2030
- 66,599 · -4.2%
- By 2040
- 59,814 · -14.0%
- By 2050
- 52,842 · -24.0%
- By 2075
- 39,167 · -43.7%
- By 2100
- 28,442 · -59.1%
Race, ethnicity, and origin ACS 2023
- Neighborhood character
- Predominantly White (92%)
- Race & ethnicity
- White 92% Two or more races 4% Hispanic / Latino 3%
- Common ancestry
- Lithuanian 5% Romanian 4% Iranian 2%
- Foreign-born
- 1% · Canada, China
- Languages at home
- 97% English-only · Spanish 1% Other Indo-European 1%
Political lean MEDSL · Madison
- 2024 margin
- R (+13.1) · D 43.5% · R 56.5%
- 2008→2024 swing
- -13.9pp toward R · 2008: 0.9pp · 2024: -13.1pp
- All cycles
- 2024: R+13.1 2020: R+10.6 2016: R+15.9 2012: D+0.3 2008: D+0.9
Not yet ingested
- Civics
- —
Market trends
- HPI YoY
- ▼ -13.30%
- Current HPI
- 248.3909
- Rent YoY
- —
- Metro
- —
- State GDP YoY
- ▲ 2.60%
- F500 in state
- 92
Industry mix (Fortune 500 HQ in NY)
| Industry | F500 HQs | Revenue |
|---|---|---|
| Financial Services | 10 | $950B |
|
||
| Consumer Goods | 9 | $162B |
|
||
| Insurance | 4 | $225B |
|
||
| Telecommunications | 2 | $144B |
|
||
| Pharmaceuticals | 2 | $112B |
|
||
| Media / Entertainment | 2 | $69B |
|
||
Price history
+1444.5% since first listed2 events — show timeline
- 2026-06-16 Listed $169,900 CNYIS
- 1995-02-07 Sold (Public Records) $11,000 Public Records
Property tax history
+4.3%/yrLatest (2025): $3,039 · -1.3% YoY. Source: county tax records.
Cash-flow waterfall
monthlySold comps — $/sqft
last 12 mo · ≤1 miLoading sold comps…