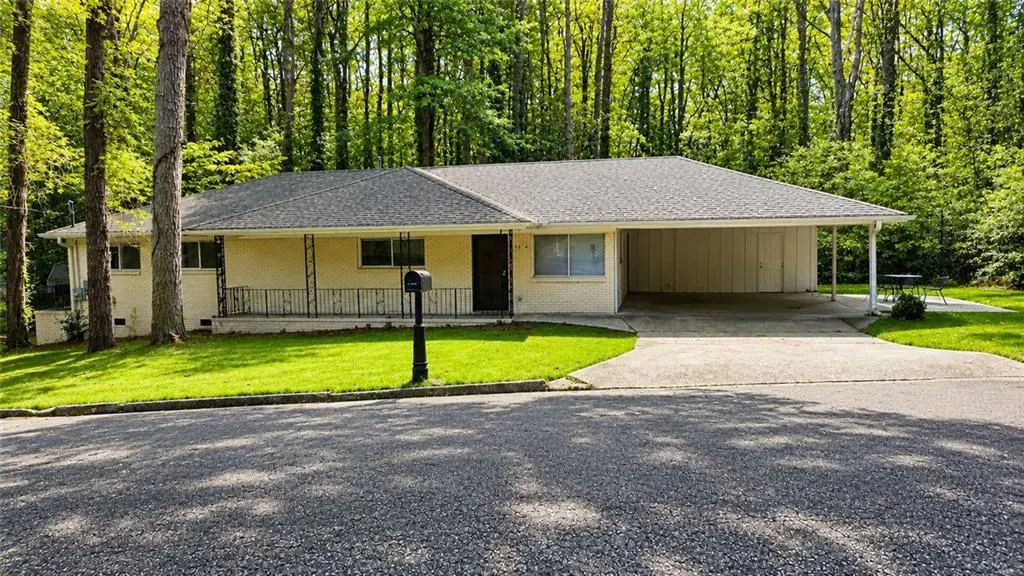
3226 Cloverhurst Dr · East Point, GA
Flood risk 4/10 · Minor
- FEMA flood zone
- X (unshaded)
- Chance of flooding over 30 yrs
- 0.2%
- Est. flood insurance / yr
- $473 – $860
Fire risk 1/10 · Minimal
- Est. fire insurance / yr
- $963 – $1,789
Heat risk 5/10 · Moderate
- Hot days now (above 103°F)
- 6 days/yr
- Hot days in 30 yrs
- 15 days/yr
Wind risk 6/10 · Moderate
- Chance of severe wind over 30 yrs
- 27.0%
Air-quality risk 3/10 · Minor
- Unhealthy air days now
- 3 days/yr
- Unhealthy air days in 30 yrs
- 3 days/yr
Risk factors via First Street. Map © Google.
Why this score? — see what drove the D- grade
The composite is a weighted blend of 9 inputs, each scored 0–100. Each bar is that input's sub-score; the figure is the points it added to the 100-point composite (weight × sub-score).
- ARV discount +15.0/15.0
- Cash flow +7.7/30.0
- Schools +4.5/10.0
- Livability +3.6/5.0
- Rent growth +2.8/5.0
- Condition / age +2.5/5.0
- DSCR +1.8/10.0
- 1% rule +1.7/10.0
- Appreciation +0.0/10.0
$310,000
🖨 Deal sheet 📄 Offer letter ✓ Due diligence
Listing remarks MLS
Great Investor Opportunity in East Point! Don't miss this "diamond in the rough" tucked away on a quiet, dead-end street in the heart of East Point. This full-brick home was originally built as a duplex and has been converted into a single-family residence featuring four bedrooms and three full baths. Inside, you'll find a large primary bedroom with its own private bath and separate entry, offering flexibility for guests, tenants, or multi-generational living. Another bedroom also includes its own en-suite bathroom, adding comfort and privacy for all. The home sits on a level lot with plenty of potential, surrounded by convenience, privacy, and the vibrant energy of South Atlanta's growing East Point community. Home is being sold as-is. Schedule your showing today!
Key facts
- Full-brick home
- Private bath
- Level lot
Tags
Property features AI
Finance
- HOA & community: Community has street lights
Exterior
- Parking: 2 total parking spaces; 2-car carport; Kitchen-level parking access
- Utilities: Public water; Public sewer; Electric service (110 volts); Cable available; Electricity available; Water and sewer available
- Home design: One level; Brick construction (brick 4 sides); Composition roof; Above-grade finished living area listed (value available)
- Construction: Brick exterior (brick 4 sides); Composition roof
- Exterior features: Front porch; Street lights in the community; City street with asphalt road frontage
Interior
- Kitchen: White cabinets; Solid surface countertops; Refrigerator included
- Bedrooms: 4 main-level bedrooms
- Flooring: Hardwood; Laminate; Tile
- Bathrooms: 3 full bathrooms (all on the main level); Master bathroom: none specified
- Heating & cooling: Central air (electric); Electric heat pump
- Interior features: Updated/remodeled interior; Double-pane windows; No common walls
- Laundry & utility: No specific laundry appliances listed
Neighborhood map
What this means for you Summary
Snapshot
- This is a 3-bed/2.0-bath single-family listed at $310k.
Deal economics
- At list price, monthly cash flow is $-359 ($-4k/yr) — negative.
- To cash-flow at today's rent, offer at most $247k (20.4% below list).
- To meet the 1% rule (rent ≥ 1% of price), the offer needs to be $209k (32.6% below list).
- Recommended offer: $209k (32.6% below list) — sets the bar for 1% rule.
Location & tenants
- Location reads 72/100 on livability (#72 in GA) — a middle-class / working-renter tenant base. Strengths: commute A+, cost of living A+, housing A+; Watch: employment D+, crime F, amenities F.
- Fulton County (suburban): math 49% / reading 53% proficiency, ranked #12 of 174 in GA (top 7%) — acceptable for families but not a draw, mixed tenant base, ~2y average lease.
- Zoned schools: Paul D. West Middle School (math 17% / reading 17%, grade F, #381 of 470 statewide, top 82%, 803 students, 100% FRL); Tri-Cities High School (math 5% / reading 30%, grade F, #264 of 424 statewide, top 63%, 1,483 students, 100% FRL) — zoned schools average 100% FRL vs 41% district-wide (59 pts higher); higher-poverty schools than district average — tighter screening recommended.
- Zoned-school proficiency averages 17% at this address vs 51% district-wide (-34 pts) — the specific schools serving this property underperform the Fulton County average; the district grade overstates school quality for this exact location.
- Market conditions: Rents rising (+1.4%/yr); 283 active listings in the ZIP; 36 comparable units currently listed for rent nearby; rentals lingering (median 44d on market — plan ~5-8 weeks vacancy on turnover, expect pricing pressure); 56% of comp listings sitting > 30 days — soft ceiling on asking rent; 11,565 units permitted in Fulton County in 2024 (8,159 in 5+ unit buildings).
- This rent runs 37% of the median local income ($68k/yr) — at the standard rent-burdened threshold; future hikes will face affordability resistance.
Forward outlook
- Local home prices are declining (-3.0%/yr); year-one equity from $2k of loan paydown is wiped out by about $9k of value loss. Plan a longer hold.
- Fulton County population projected at +38% by 2050 — long-run rental-demand tailwind backs the buy-and-hold thesis.
Negotiation context
- It's been on market 41 days — a 3% lower offer ($301k) is reasonable based on typical stale-listing flexibility.
- 7 sale attempts since 6y ago with the ask held roughly flat each time — persistent listings suggest the price (not the market) is what's stuck; bring a comps-based counter.
- Current owner paid $137k; list at $310k implies a 126% gain — meaningful room to come down on a strong offer.
Risks & watch-outs
- Watch-outs: built in 1958 — expect roof / HVAC / electrical / plumbing capex.
- Climate carrying-cost: major wind risk, 27% chance of damaging wind over 30y; extreme-heat days projected 6→15/yr by 2055 (HVAC capex compounding) — expect insurance premiums to compound above CPI over the hold.
Questions for the listing agent
- What do current leases actually rent for vs. the listed asking? Can we see a recent rent roll and the last 12 months of T-12 income?
- It's been on market 41 days. Have you received any prior offers? Is the seller open to a 33% concession, seller financing, or rate buy-down credit?
- Built in 1958 — when were the roof, HVAC, electrical panel, plumbing, and water heater last replaced?
- Is there a deadline driving the sale (1031 exchange, divorce, estate, relocation)? That informs how much negotiation room exists.
- Schools are F-rated, which usually means shorter tenancies and higher turnover. Who's the typical renter profile here, and what's been the actual vacancy rate?
- Crime grade is F in this area — have there been break-ins, vandalism, or insurance claims at this property in the last 3 years? What carrier currently insures it and at what premium?
- The area grade is low — what's the realistic commute time and amenity access for the typical tenant pool here? Any planned neighborhood developments (good or bad) we should know about?
- What's the average days-on-market for RENTAL listings here right now (not sales)? A rising rental-DOM trend means longer vacancies and softer asking-rent achievability than the comps imply.
- What's the recent tenant-quality profile in this submarket — average credit score on applications, eviction rate, late-payment / NSF rate, and stable-employment percentage? A property-management company in the area should have these aggregated.
- How much new for-sale + rental construction is in the pipeline within 1–3 miles? Heavy new supply typically softens prices + rents 12–24 months out; constrained supply supports both.
Investment metrics
- 1% rule
- 0.67% ✗
- Cap rate
- 4.91%
- Cash-on-cash
- -4.96%
- DSCR
- 0.78
- GRM
- 12.4
CMA / ARV
- ARV (median comp)
- $372,940
- List price
- $310,000
- Delta
- -16.88%
- Verdict
- UNDERPRICED
- Comps
- 20 within 1.0 mi
Show comp detail 12 sales within ~0.75 mi
| Address | Dist | Beds/Ba | Sqft | Sold | Price | $/sf | Match |
|---|---|---|---|---|---|---|---|
| 3200 Lowndes St | 0.37mi | 3/2.0 | 1,661 (-8%) | 4mo | $275,000 | $166 | 67 |
| 1948 Mercer Ave | 0.34mi | 3/2.0 | 1,958 (+9%) | 5mo | $257,500 | $132 | 66 |
| 2058 Lyle Ave | 0.12mi | 4/2.0 (+1) | 2,010 (+12%) | 6mo | $450,000 | $224 | 65 |
| 1871 E Farris Ave E | 0.47mi | 4/2.0 (+1) | 1,624 (-10%) | 0mo | $230,000 | $142 | 57 |
| 2907 Cloverhurst Dr | 0.61mi | 3/2.0 | 1,703 (-5%) | 8mo | $186,000 | $109 | 56 |
| 3081 Semmes St | 0.63mi | 3/2.5 | 1,690 (-6%) | 6mo | $155,000 | $92 | 53 |
| 1845 Vesta Ave | 0.49mi | 3/2.0 | 1,581 (-12%) | 6mo | $289,000 | $183 | 52 |
| 7318 Tolar Rd Lot 10 | 0.46mi | 4/2.5 (+1) | 1,919 (+7%) | 17mo | $380,490 | $198 | 46 |
| 3197 Church St | 0.58mi | 4/2.0 (+1) | 1,604 (-11%) | 5mo | $285,000 | $178 | 46 |
| 3449 Parkview Dr | 0.68mi | 4/2.0 (+1) | 1,975 (+10%) | 11mo | $475,000 | $241 | 38 |
| 3105 Jones St | 0.55mi | 4/3.0 (+1) | 2,068 (+15%) | 5mo | $371,000 | $179 | 36 |
| 3095 Meadow Lark Ln | 0.71mi | 3/2.5 | 1,562 (-13%) | 12mo | $350,000 | $224 | 33 |
Match score weights: distance 35% · size 25% · config 20% · recency 20%. Top-matched comps best support the ARV.
Projected returns pro-forma
-3.0% appreciation · 1.35% rent growth · sell at horizon
- IRR
- -26.5%
- Equity multiple
- 0.12×
- Total profit
- $-76,528
- Equity at exit
- $46,222
- IRR
- -29.7%
- Equity multiple
- -0.26×
- Total profit
- $-109,788
- Equity at exit
- $26,803
Cash invested: $86,800 (down + closing). Projections, not guarantees.
Landlord ↔ Tenant lean methodology
- Overall (STATE)
- 90 Strongly Landlord-Friendly
- State Georgia
- 90 Strongly Landlord-Friendly · R+3
- County
- — inherits STATE
- City
- — inherits STATE
ZIP-level market 30344
- Home prices YoY
- -31.0%
- Rents YoY
- 1.4%
- Active inventory
- 283
- Price-to-rent
- 12.4×
Monthly cashflow live
- Estimated rent
- $2,088 high interval (Pro) →
- Mortgage (P&I)
- −$1,626
- Tax from tax record
- −$253 /mo · $3,041/yr
- Insurance
- −$129
- HOA
- −$0
- Vacancy / Maint / Mgmt
- −$439
- Net cashflow
- $-359
Break-even live
UW: 25.0% down · 7.5% · 30yr · 1.5% tax · 5.0% vac · 8.0% maint · 8.0% mgmt
Financing live
Cash to close
- Down payment
- $77,500
- Closing costs
- $9,300
- Reserves months
- —
- Total cash needed
- —
Loan-product check · same deal, 3 products live
Conventional
25% down · 7.5% · 30yr
- Down + closing
- —
- Monthly P&I
- —
- Monthly cashflow
- —
- DSCR
- —
- Eligible?
- —
Personal DTI + credit; lowest rate.
DSCR
20% down · 8.5% · 30yr
- Down + closing
- —
- Monthly P&I
- —
- Monthly cashflow
- —
- DSCR
- —
- Eligible?
- —
No personal income docs; deal must DSCR.
Hard money
10% down · 12.0% · 12mo
- Down + closing
- —
- Monthly P&I
- —
- Monthly cashflow
- —
- DSCR
- —
- Eligible?
- —
Short-term bridge; refi at stabilization.
Rent comps 36 comps
| Address | Beds | Baths | Sqft | Rent | $/sqft | DOM | Units | Dist |
|---|---|---|---|---|---|---|---|---|
| 3184 Pollard St Atlanta, GA | 3.0 | 2.0 | 1400 | $1,800 | $1.29 | 43d | 1 | 0.14mi |
| 3447 Pierce St Atlanta, GA | 2.0 | 1.0 | 1560 | $1,345 | $0.86 | 43d | 1 | 0.38mi |
| 2145 Park Ter Atlanta, GA | 4.0 | 4.0 | 2500 | $3,100 | $1.24 | 5d | 1 | 0.41mi |
| 3437 Harris Dr Atlanta, GA | 3.0 | 1.0 | 1556 | $1,650 | $1.06 | 43d | 1 | 0.41mi |
| 3483 Napoleon St Atlanta, GA | 3.0 | 2.0 | 1749 | $2,589 | $1.48 | 43d | 1 | 0.45mi |
| 1861 Lyle Ave Unit 2 Atlanta, GA | 2.0 | 2.0 | 1250 | $1,600 | $1.28 | 43d | 1 | 0.47mi |
| 1875 Dunlap Ave Atlanta, GA | 2.0 | 1.0 | 1650 | $1,875 | $1.14 | 43d | 1 | 0.47mi |
| 1845 Vesta Ave Atlanta, GA | 3.0 | 2.0 | 1581 | $2,128 | $1.35 | 24d | 1 | 0.52mi |
| 1863 Phillips Ave Atlanta, GA | 3.0 | 2.5 | 1470 | $2,115 | $1.44 | 10d | 1 | 0.52mi |
| 1988 Virginia Ave Atlanta, GA | 4.0 | 2.0 | 1450 | $2,325 | $1.60 | 5d | 1 | 0.55mi |
| 3031 Remington St Atlanta, GA | 3.0 | 2.0 | 1369 | $1,200 | $0.88 | 18d | 1 | 0.56mi |
| 1827 Dunlap Ave Atlanta, GA | 3.0 | 2.0 | 1250 | $3,200 | $2.56 | 43d | 1 | 0.56mi |
| 1962 Washington Rd Atlanta, GA | 4.0 | 2.0 | 2114 | $2,100 | $0.99 | 43d | 1 | 0.57mi |
| 2420 Heaton Dr Atlanta, GA | 1.0–3.0 | 1.5–2.0 | 1103 | $1,750 | $1.59 | 43d | 1 | 0.58mi |
| 1809 Vesta Ave Atlanta, GA | 2.0 | 1.0 | 1768 | $2,900 | $1.64 | 43d | 1 | 0.59mi |
| 2933 Cloverhurst Dr Atlanta, GA | 4.0 | 3.0 | 1550 | $2,500 | $1.61 | 20d | 1 | 0.60mi |
| 1804 Mercer Ave Atlanta, GA | 3.0 | 2.0 | 2250 | $2,600 | $1.16 | 43d | 1 | 0.60mi |
| 3168 Beech Dr Atlanta, GA | 3.0 | 2.0 | 1402 | $1,500 | $1.07 | 43d | 1 | 0.62mi |
| 3181 Church St Unit A Atlanta, GA | 2.0 | 2.0 | 1646 | $1,750 | $1.06 | 21d | 1 | 0.62mi |
| 1755 Lyle Ave Atlanta, GA | 3.0 | 2.5 | 1973 | $2,600 | $1.32 | 18d | 1 | 0.67mi |
| 3544 College St Atlanta, GA | 3.0 | 2.5 | 2000 | $2,650 | $1.32 | 1d | 1 | 0.70mi |
| 1717 W Taylor Ave Atlanta, GA | 3.0 | 2.5 | 2100 | $1,791 | $0.85 | 12d | 1 | 0.87mi |
| 1777 Temple Ave Atlanta, GA | 4.0 | 3.5 | 1901 | $3,400 | $1.79 | 43d | 2 | 0.97mi |
| 3296 Myrtle St Atlanta, GA | 4.0 | 2.0 | 1452 | $2,275 | $1.57 | 43d | 1 | 1.02mi |
| 1678 Dorsey Ave Atlanta, GA | 4.0 | 3.0 | 2615 | $2,650 | $1.01 | 24d | 1 | 1.08mi |
| 1698 Temple Ave Atlanta, GA | 3.0 | 3.0 | 1608 | $2,500 | $1.55 | 24d | 1 | 1.11mi |
| 2658 Rolling Brook Trl Atlanta, GA | 3.0 | 2.0 | 1754 | $1,850 | $1.05 | 43d | 1 | 1.13mi |
| 3465 Madison St Atlanta, GA | 4.0 | 3.0 | 1821 | $2,695 | $1.48 | 43d | 1 | 1.14mi |
| 1658 Temple Ave Atlanta, GA | 3.0 | 2.5 | 1692 | $2,295 | $1.36 | 24d | 1 | 1.16mi |
| 3276 Elm St Atlanta, GA | 3.0 | 1.0 | 1250 | $1,685 | $1.35 | 1d | 1 | 1.19mi |
| 2523 Ben Hill Rd Atlanta, GA | 3.0 | 1.5 | 1412 | $3,000 | $2.12 | 21d | 1 | 1.22mi |
| 3211 Flamingo Dr Atlanta, GA | 3.0 | 2.0 | 1485 | $1,900 | $1.28 | 43d | 1 | 1.23mi |
| 1656 Ware Ave Atlanta, GA | 3.0 | 2.0 | 1866 | $2,150 | $1.15 | 43d | 1 | 1.36mi |
| 3625 Hawthorne Ter Atlanta, GA | 3.0 | 3.5 | 2000 | $2,500 | $1.25 | 17d | 1 | 1.44mi |
| 2514 Riggs Dr Atlanta, GA | 4.0 | 2.0 | 1274 | $2,000 | $1.57 | 43d | 1 | 1.44mi |
| 1493 Ashley Way Atlanta, GA | 3.0 | 2.5 | 1646 | $1,900 | $1.15 | 43d | 1 | 1.46mi |
Listing history 32 events
-
2026-06-18days on market $310,000 Active 41 DOM
-
2026-06-17days on market $310,000 Active 40 DOM
-
2026-06-16days on market $310,000 Active 39 DOM
-
2026-06-15days on market $310,000 Active 38 DOM
-
2026-06-13days on market $310,000 Active 36 DOM
-
2026-06-09days on market $310,000 Active 32 DOM
-
2026-06-08days on market $310,000 Active 31 DOM
-
2026-06-07days on market $310,000 Active 30 DOM
-
2026-06-04days on market $310,000 Active 27 DOM
-
2026-06-03days on market $310,000 Active 26 DOM
-
2026-06-01days on market $310,000 Active 24 DOM
-
2026-05-31days on market $310,000 Active 23 DOM
-
2026-05-07$310,000 Active 803-char remark
Show marketing remark (785 chars)
Great Investor Opportunity in East Point! Don't miss this "diamond in the rough" tucked away on a quiet, dead-end street in the heart of East Point. This full-brick home was originally built as a duplex and has been converted into a single-family residence featuring four bedrooms and three full baths. Inside, you'll find a large primary bedroom with its own private bath and separate entry, offering flexibility for guests, tenants, or multi-generational living. Another bedroom also includes its own en-suite bathroom, adding comfort and privacy for all. The home sits on a level lot with plenty of potential, surrounded by convenience, privacy, and the vibrant energy of South Atlanta's growing East Point community. Home is being sold as-is. Schedule your showing today!
-
2026-05-07$310,000 New 785-char remark
Show marketing remark (785 chars)
Great Investor Opportunity in East Point! Don't miss this "diamond in the rough" tucked away on a quiet, dead-end street in the heart of East Point. This full-brick home was originally built as a duplex and has been converted into a single-family residence featuring four bedrooms and three full baths. Inside, you'll find a large primary bedroom with its own private bath and separate entry, offering flexibility for guests, tenants, or multi-generational living. Another bedroom also includes its own en-suite bathroom, adding comfort and privacy for all. The home sits on a level lot with plenty of potential, surrounded by convenience, privacy, and the vibrant energy of South Atlanta's growing East Point community. Home is being sold as-is. Schedule your showing today!
-
2026-04-24historical
-
2026-04-24historical
-
2026-03-17price $328,000
-
2026-03-17price $328,000
-
2025-10-29$330,000 New
-
2025-10-29$330,000 Active
-
2020-10-15soldstatus $137,000
-
2020-10-13soldstatus $137,000 Closed
-
2020-10-13soldstatus $137,000 Sold
-
2020-09-11status Under Contract
-
2020-09-11status Pending
-
2020-09-04status Active
-
2020-08-14$142,500 Active
-
2020-08-14$142,500 New
-
2018-08-22soldstatus $19,754,800
-
2013-05-02soldstatus $22,775,000
-
2000-04-04soldstatus $102,000
-
1986-09-16soldstatus $65,000
ⓘ Source: listings_history table (triggers on properties + properties_extension) + one-shot
backfill from property_details.listing_events for pre-trigger history.
Tax reassessment forecast GA · Resets to sale price
- Current annual tax
- $3,041 · $253/mo
- Projected year-2 tax
- $3,041 · $253/mo
- Expected delta
- $0/yr ($0/mo · 0.0%)
ⓘ Screening estimate from a state-policy table — verify with the county assessor before closing.
Climate risk First Street
- Flood 4/10 Moderate FEMA zone X (unshaded) · 20% chance over 30 yrs
- Wildfire 1/10 Low
- Heat 5/10 Major 6 d/yr ≥103°F today · 15 d/yr by 30 yrs out
- Wind 6/10 Major 27% chance of damaging wind over 30 yrs
- Air quality 3/10 Moderate 3 unhealthy d/yr today · 3 by 30 yrs out
Nearby sold comps map
Loading sold comps map…
Walkable amenities ~0.75 mi
Loading nearby amenities…
Taxation est. · year 1
- Rental income
- $25,060
- − Mortgage interest
- −$17,365
- − Property taxes
- −$3,041
- − Insurance
- −$1,550
- − Repairs & maintenance
- −$2,005
- − Management
- −$2,005
- − Depreciation
- −$9,018
- Taxable loss
- −$9,924
- Est. tax savings @ 24.0%
- +$2,382
- After-tax cash flow
- $-1,920/yr
For passive investors: Depreciation is non-cash, so a rental often shows a tax loss while cash-flowing — sheltering income. Rental losses are passive: they offset passive income freely, and up to $25,000/yr can offset ordinary (W-2) income if you actively participate and your MAGI is under $100k (phasing out to $0 by $150k); unused losses carry forward. On sale, claimed depreciation is recaptured at up to 25%, and gains may owe capital-gains tax (a 1031 exchange can defer both). Figures are a year-1 estimate at your 24.0% rate — not tax advice; consult a CPA.
Schools (NCES district)
- District
- Fulton County
- NCES district ID
- 1302280
- Math proficiency
- 49% ▼ -2.00%
- Reading proficiency
- 53% ▬ 0.00%
- Median HH income
- $68,035
- Composite
- 45.33/100
- National rank
- #2640
- State rank
- #12 of 174 in GA
Livability — East Point
- Score
- 72/100
- State rank
- #72
- US rank
- #6314
Category grades
Schools grade is shown separately in the Schools card above.
Census & demographics
- Census place
- East Point, GA
- County
- Fulton County · 1,094,430 people
- City population
- 35,456
- Metro
- Atlanta-Sandy Springs-Alpharetta, GA
- Population (ZIP)
- 35,456
- Household income
- $68,380
- Rent vs Own
- Severe rent burden
- 2226.0
Population outlook (Fulton County) Hauer SSP2
- Today (2025)
- 1,203,707 people
- By 2030
- 1,299,706 · +8.0%
- By 2040
- 1,488,256 · +23.6%
- By 2050
- 1,664,580 · +38.3%
- By 2075
- 2,036,072 · +69.2%
- By 2100
- 2,222,402 · +84.6%
Race, ethnicity, and origin ACS 2023
- Neighborhood character
- Predominantly Black (74%)
- Race & ethnicity
- Black 74% White 11% Hispanic / Latino 11% Two or more races 6%
- Hispanic origin (detail)
- Mexican 7% Puerto Rican 1%
- Common ancestry
- Italian 1% Swiss 1% Russian 1%
- Foreign-born
- 6% · Canada, Jamaica
- Languages at home
- 87% English-only · Spanish 9% Other Indo-European 1% German/W. Germanic 1%
Political lean MEDSL · Fulton
- 2024 margin
- Solid D (+44.9) · D 71.9% · R 27.0% · Other 1.1%
- 2008→2024 swing
- +9.8pp toward D · 2008: 35.0pp · 2024: 44.9pp
- All cycles
- 2024: D+44.9 2020: D+46.4 2016: D+42.1 2012: D+29.6 2008: D+35.0
Not yet ingested
- Civics
- —
Market trends
- HPI YoY
- ▼ -113.15%
- Current HPI
- 251.7916
- Rent YoY
- ▲ 1.35%
- Metro
- Atlanta-Sandy Springs-Alpharetta, GA
- State GDP YoY
- ▲ 2.66%
- F500 in state
- 28
Industry mix (Fortune 500 HQ in GA)
| Industry | F500 HQs | Revenue |
|---|---|---|
| Paper / Packaging | 2 | $29B |
|
||
| Retail | 1 | $160B |
|
||
| Transportation / Logistics | 1 | $91B |
|
||
| Airlines | 1 | $62B |
|
||
| Consumer Goods | 1 | $47B |
|
||
| Utilities | 1 | $25B |
|
||
Price history
+376.9% since first listed20 events — show timeline
- 2026-05-07 Listed $310,000 FMLS
- 2026-05-07 Listed $310,000 GAMLS
- 2026-04-24 Listing Removed — FMLS
- 2026-04-24 Listing Removed — GAMLS
- 2026-03-17 Price Changed $328,000 GAMLS
- 2026-03-17 Price Changed $328,000 FMLS
- 2025-10-29 Listed $330,000 FMLS
- 2025-10-29 Listed $330,000 GAMLS
- 2020-10-15 Sold (Public Records) $137,000 Public Records
- 2020-10-13 Sold (MLS) $137,000 GAMLS
- 2020-10-13 Sold (MLS) $137,000 FMLS
- 2020-09-11 Pending — GAMLS
- 2020-09-11 Pending — FMLS
- 2020-09-04 Relisted — FMLS
- 2020-08-14 Listed $142,500 GAMLS
- 2020-08-14 Listed $142,500 FMLS
- 2018-08-22 Sold (Public Records) $19,754,800 Public Records
- 2013-05-02 Sold (Public Records) $22,775,000 Public Records
- 2000-04-04 Sold (Public Records) $102,000 Public Records
- 1986-09-16 Sold (Public Records) $65,000 Public Records
Property tax history
+3.0%/yrLatest (2025): $3,041 · -12.4% YoY. Source: county tax records.
Cash-flow waterfall
monthlySold comps — $/sqft
last 12 mo · ≤1 miLoading sold comps…