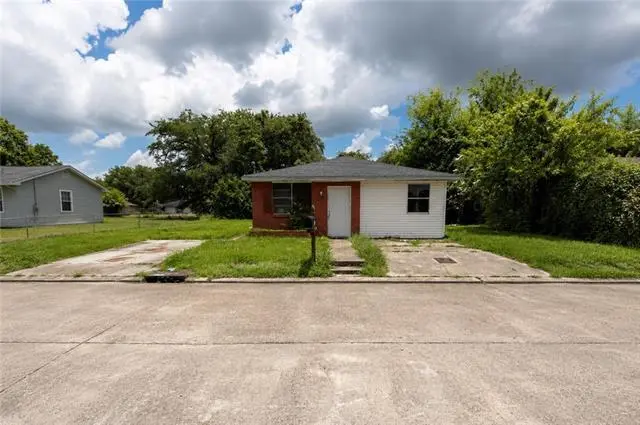
411 Louise St · Houma, LA
Flood risk 9/10 · Severe
- FEMA flood zone
- AE
- Chance of flooding over 30 yrs
- 0.99%
- Est. flood insurance / yr
- $1,737 – $8,500
Fire risk 1/10 · Minimal
- Est. fire insurance / yr
- $1,269 – $2,357
Heat risk 9/10 · Severe
- Hot days now (above 107°F)
- 7 days/yr
- Hot days in 30 yrs
- 21 days/yr
Wind risk 9/10 · Severe
- Chance of severe wind over 30 yrs
- 99.0%
Air-quality risk 1/10 · Minimal
- Unhealthy air days now
- 0 days/yr
- Unhealthy air days in 30 yrs
- 0 days/yr
Risk factors via First Street. Map © Google.
Why this score? — see what drove the B- grade
The composite is a weighted blend of 9 inputs, each scored 0–100. Each bar is that input's sub-score; the figure is the points it added to the 100-point composite (weight × sub-score).
- Cash flow +30.0/30.0
- 1% rule +10.0/10.0
- DSCR +10.0/10.0
- ARV discount +7.5/15.0
- Schools +3.3/10.0
- Livability +3.2/5.0
- Rent growth +2.5/5.0
- Condition / age +2.5/5.0
- Appreciation +0.0/10.0
$58,000
🖨 Deal sheet 📄 Offer letter ✓ Due diligence
Listing remarks MLS
Located in the heart of Houma, this property is a blank canvas ready for transformation. Fully gutted and cleared out, it's primed for an investor, flipper, or buyer with vision to bring it back to life. With endless potential to customize and renovate to your liking, this is a great opportunity to create something special. Conveniently located with easy access to local shopping, dining, and amenities. Bring your ideas and unlock the possibilities at 411 Louise Street!
Key facts
- Fully gutted
- Easy access
- Blank canvas
Tags
Property features AI
Exterior
- Utilities: Public water; Public sewer
- Home design: Single-story; Entry level: 1
- Construction: Brick construction; Shingle roof; Slab foundation; Built in an earlier year (year not provided)
- Exterior features: City lot; Rectangular lot; Lot dimensions approximately 60 x 120
Interior
- Bathrooms: 1 full bathroom; 1 half bathroom
- Heating & cooling: Central air conditioning
- Interior features: Total of 8 rooms; Poor condition
Neighborhood map
What this means for you Summary
Snapshot
- This is a 3-bed/1.5-bath other listed at $58k.
Deal economics
- At list price, monthly cash flow is $139 ($2k/yr) — positive.
- The deal already cash-flows at list — no discount required.
- Meets the 1% rule at list price ($1k rent vs $58k).
- Recommended offer: $57k (1.5% below list) — sets the bar for market timing.
- Cap rate 18.0% vs local median 4.0% in Houma — top-decile yield for the area; either an underpriced asset or a hidden risk that comps aren't pricing in. Stress-test before assuming the spread holds.
Location & tenants
- Location reads 64/100 on livability (#165 in LA) — a middle-class / working-renter tenant base. Strengths: cost of living A+, housing A; Watch: employment D, crime D-, amenities F.
- Terrebonne Parish (other): math 32% / reading 46% proficiency, ranked #23 of 98 in LA (top 24%) — families likely to look elsewhere, expect single-tenant / working-renter base with shorter leases; 62% free/reduced lunch — lower-income household profile, screen leases tightly.
- Market conditions: 206 active listings in the ZIP; 7 comparable units currently listed for rent nearby; rentals lingering (median 44d on market — plan ~5-8 weeks vacancy on turnover, expect pricing pressure); 100% of comp listings sitting > 30 days — soft ceiling on asking rent; 300 units permitted in Terrebonne Parish in 2024 (0 in 5+ unit buildings).
Forward outlook
- Local home prices are declining (-3.0%/yr); year-one equity from $401 of loan paydown is wiped out by about $2k of value loss. Plan a longer hold.
- At projected returns (-3.0% appreciation + 3.0% rent growth), your $16k cash investment doubles in ~10 years — after that, you're playing with house money.
Negotiation context
- It's been on market 19 days — a 2% lower offer ($57k) is reasonable based on typical stale-listing flexibility.
- 2 sale attempts with the ask held roughly flat each time — persistent listings suggest the price (not the market) is what's stuck; bring a comps-based counter.
- Current owner paid $8k; list at $58k implies a 673% gain — meaningful room to come down on a strong offer.
Risks & watch-outs
- Watch-outs: flood insurance adds $427/mo.
- Climate carrying-cost: in FEMA flood zone AE (mandatory federal flood insurance); severe wind risk, 99% chance of damaging wind over 30y; extreme-heat days projected 7→21/yr by 2055 (HVAC capex compounding) — expect insurance premiums to compound above CPI over the hold.
Questions for the listing agent
- What's the actual annual flood-insurance premium (NFIP or private), and is the property in a SFHA with mandatory coverage?
- Is there a deadline driving the sale (1031 exchange, divorce, estate, relocation)? That informs how much negotiation room exists.
- Schools are B-rated — typically a magnet for longer-tenancy family renters. What's the average tenant stay here, and is there a school-zone premium baked into asking?
- Crime grade is D in this area — have there been break-ins, vandalism, or insurance claims at this property in the last 3 years? What carrier currently insures it and at what premium?
- What's the average days-on-market for RENTAL listings here right now (not sales)? A rising rental-DOM trend means longer vacancies and softer asking-rent achievability than the comps imply.
- What's the recent tenant-quality profile in this submarket — average credit score on applications, eviction rate, late-payment / NSF rate, and stable-employment percentage? A property-management company in the area should have these aggregated.
- How much new for-sale + rental construction is in the pipeline within 1–3 miles? Heavy new supply typically softens prices + rents 12–24 months out; constrained supply supports both.
Investment metrics
- 1% rule
- 2.06% ✓
- Cap rate
- 18.00%
- Cash-on-cash
- 41.80%
- DSCR
- 2.86
- GRM
- 4.0
CMA / ARV
No comps found within radius.
Projected returns pro-forma
-3.0% appreciation · 3.0% rent growth · sell at horizon
- IRR
- -0.4%
- Equity multiple
- 0.98×
- Total profit
- $-269
- Equity at exit
- $8,648
- IRR
- 9.6%
- Equity multiple
- 1.76×
- Total profit
- $12,262
- Equity at exit
- $5,015
Cash invested: $16,240 (down + closing). Projections, not guarantees.
Landlord ↔ Tenant lean methodology
- Overall (STATE)
- 90 Strongly Landlord-Friendly
- State Louisiana
- 90 Strongly Landlord-Friendly · R+12
- County
- — inherits STATE
- City
- — inherits STATE
ZIP-level market 70363
- Active inventory
- 206
- Price-to-rent
- 4.0×
Monthly cashflow live
- Estimated rent
- $1,196 high interval (Pro) →
- Mortgage (P&I)
- −$304
- Tax from tax record
- −$51 /mo · $612/yr
- Insurance
- −$24
- Flood insurance flood zone
- −$427 /mo · $5,118/yr
- HOA
- −$0
- Vacancy / Maint / Mgmt
- −$251
- Net cashflow
- $139
Break-even live
UW: 25.0% down · 7.5% · 30yr · 1.5% tax · 5.0% vac · 8.0% maint · 8.0% mgmt
Financing live
Cash to close
- Down payment
- $14,500
- Closing costs
- $1,740
- Reserves months
- —
- Total cash needed
- —
Loan-product check · same deal, 3 products live
Conventional
25% down · 7.5% · 30yr
- Down + closing
- —
- Monthly P&I
- —
- Monthly cashflow
- —
- DSCR
- —
- Eligible?
- —
Personal DTI + credit; lowest rate.
DSCR
20% down · 8.5% · 30yr
- Down + closing
- —
- Monthly P&I
- —
- Monthly cashflow
- —
- DSCR
- —
- Eligible?
- —
No personal income docs; deal must DSCR.
Hard money
10% down · 12.0% · 12mo
- Down + closing
- —
- Monthly P&I
- —
- Monthly cashflow
- —
- DSCR
- —
- Eligible?
- —
Short-term bridge; refi at stabilization.
Rent comps 7 comps
| Address | Beds | Baths | Sqft | Rent | $/sqft | DOM | Units | Dist |
|---|---|---|---|---|---|---|---|---|
| 211 Saint Malo St Houma, LA | 3.0 | 1.0 | 951 | $1,050 | $1.10 | 43d | 1 | 0.60mi |
| 885 High St Houma, LA | 2.0 | 1.0 | 801 | $1,100 | $1.37 | 43d | 1 | 0.62mi |
| 810 Saadi St Houma, LA | 2.0 | 1.0 | 754 | $1,300 | $1.72 | 43d | 3 | 0.62mi |
| 100 Chateau Ct Houma, LA | 2.0 | 2.5 | 988 | $1,262 | $1.28 | 43d | 5 | 0.64mi |
| 179 Garnet St Unit B Houma, LA | 3.0 | 1.0 | 1100 | $1,200 | $1.09 | 43d | 1 | 0.68mi |
| 1300 Laban Ave Houma, LA | 1.0–3.0 | 1.0–1.5 | 896 | $1,347 | $1.50 | 43d | 41 | 0.89mi |
| 1140 Church St Unit B Houma, LA | 2.0 | 1.0 | 1000 | $1,150 | $1.15 | 43d | 1 | 1.20mi |
Listing history 16 events
-
2026-06-19days on market $58,000 Active 19 DOM
-
2026-06-18days on market $58,000 Active 18 DOM
-
2026-06-17days on market $58,000 Active 17 DOM
-
2026-06-16days on market $58,000 Active 16 DOM
-
2026-06-15days on market $58,000 Active 15 DOM
-
2026-06-14days on market $58,000 Active 13 DOM
-
2026-06-13days on market $58,000 Active 12 DOM
-
2026-06-10days on market $58,000 Active 10 DOM
-
2026-06-09days on market $58,000 Active 9 DOM
-
2026-06-08days on market $58,000 Active 8 DOM
-
2026-06-07days on market $58,000 Active 7 DOM
-
2026-06-05days on market $58,000 Active 4 DOM
-
2026-06-03days on market $58,000 Active 3 DOM
-
2026-06-02days on market $58,000 Active 2 DOM
-
2026-06-01remarks 473-char remark
-
2026-06-01$58,000 Active 1 DOM
ⓘ Source: listings_history table (triggers on properties + properties_extension) + one-shot
backfill from property_details.listing_events for pre-trigger history.
Tax reassessment forecast LA · Resets to sale price
- Current annual tax
- $612 · $51/mo
- Projected year-2 tax
- $612 · $51/mo
- Expected delta
- $0/yr ($0/mo · 0.0%)
ⓘ Screening estimate from a state-policy table — verify with the county assessor before closing.
Climate risk First Street
- Flood 9/10 Extreme FEMA zone AE · 99% chance over 30 yrs
- Wildfire 1/10 Low
- Heat 9/10 Extreme 7 d/yr ≥107°F today · 21 d/yr by 30 yrs out
- Wind 9/10 Extreme 99% chance of damaging wind over 30 yrs
- Air quality 1/10 Low 0 unhealthy d/yr today · 0 by 30 yrs out
Nearby sold comps map
Loading sold comps map…
Walkable amenities ~0.75 mi
Loading nearby amenities…
Taxation est. · year 1
- Rental income
- $14,355
- − Mortgage interest
- −$3,249
- − Property taxes
- −$612
- − Insurance
- −$5,408
- − Repairs & maintenance
- −$1,148
- − Management
- −$1,148
- − Depreciation
- −$1,687
- Taxable income
- $1,101
- Est. tax owed @ 24.0%
- −$264
- After-tax cash flow
- $1,405/yr
For passive investors: Depreciation is non-cash, so a rental often shows a tax loss while cash-flowing — sheltering income. Rental losses are passive: they offset passive income freely, and up to $25,000/yr can offset ordinary (W-2) income if you actively participate and your MAGI is under $100k (phasing out to $0 by $150k); unused losses carry forward. On sale, claimed depreciation is recaptured at up to 25%, and gains may owe capital-gains tax (a 1031 exchange can defer both). Figures are a year-1 estimate at your 24.0% rate — not tax advice; consult a CPA.
Schools (NCES district)
- District
- Terrebonne Parish
- NCES district ID
- 2201740
- Math proficiency
- 32% ▼ -36.00%
- Reading proficiency
- 46% ▼ -30.00%
- Median HH income
- $47,612
- Composite
- 33.38/100
- National rank
- #5480
- State rank
- #23 of 98 in LA
Livability — Houma
- Score
- 64/100
- State rank
- #165
- US rank
- #13966
Category grades
Schools grade is shown separately in the Schools card above.
Census & demographics
- Census place
- Houma, LA
- City population
- 57,290
- Population (ZIP)
- 24,668
Population outlook (Terrebonne County) Hauer SSP2
- Today (2025)
- 118,724 people
- By 2030
- 120,321 · +1.3%
- By 2040
- 121,894 · +2.7%
- By 2050
- 121,119 · +2.0%
- By 2075
- 117,270 · -1.2%
- By 2100
- 107,544 · -9.4%
Race, ethnicity, and origin ACS 2023
- Neighborhood character
- Diverse neighborhood (Simpson 0.62)
- Race & ethnicity
- White 57% Black 22% Hispanic / Latino 9% Two or more races 8% Native American 8%
- Hispanic origin (detail)
- Mexican 2%
- Common ancestry
- Lithuanian 16% Italian 1%
- Foreign-born
- 5% · Canada
- Languages at home
- 88% English-only · Spanish 7% French/Haitian/Cajun 4%
Political lean MEDSL · Terrebonne
- 2024 margin
- Solid R (+51.8) · D 23.5% · R 75.3% · Other 1.2%
- 2008→2024 swing
- -11.0pp toward R · 2008: -40.9pp · 2024: -51.8pp
- All cycles
- 2024: R+51.8 2020: R+50.0 2016: R+48.4 2012: R+41.2 2008: R+40.9
Not yet ingested
- Civics
- —
Market trends
- HPI YoY
- ▼ -99.27%
- Current HPI
- 91.3914
- Rent YoY
- —
- Metro
- —
- State GDP YoY
- ▲ 3.29%
- F500 in state
- 10
Industry mix (Fortune 500 HQ in LA)
| Industry | F500 HQs | Revenue |
|---|---|---|
| Telecommunications | 2 | $23B |
|
||
| Utilities | 1 | $12B |
|
||
| Wholesale / Distribution | 1 | $5B |
|
||
| Advertising | 1 | $2B |
|
||
Price history
+673.3% since first listed3 events — show timeline
- 2026-05-31 Listed $58,000 AcadianaMLS
- 2026-05-31 Listed $58,000 GSREIN
- 1983-04-29 Sold (Public Records) $7,500 Public Records
Property tax history
+1.1%/yrLatest (2025): $612 · -2.3% YoY. Source: county tax records.
Cash-flow waterfall
monthlySold comps — $/sqft
last 12 mo · ≤1 miLoading sold comps…