 5-Plex
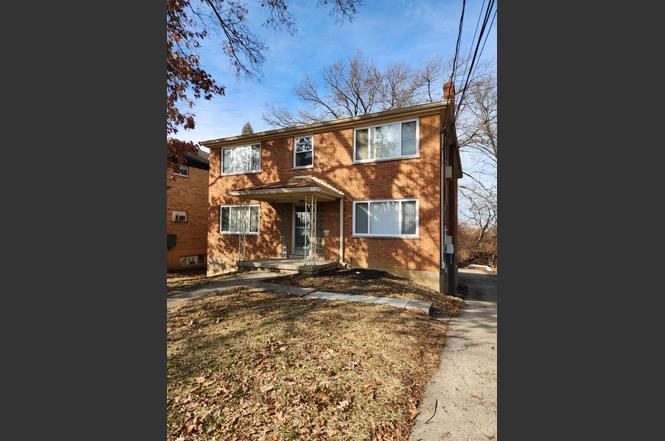
3194 Harry Lee Ln · White Oak, OH
Flood risk 1/10 · Minimal
- FEMA flood zone
- X (unshaded)
- Chance of flooding over 30 yrs
- 0.0%
- Est. flood insurance / yr
- $507 – $1,088
Fire risk 1/10 · Minimal
- Est. fire insurance / yr
- $713 – $1,323
Heat risk 4/10 · Minor
- Hot days now (above 103°F)
- 7 days/yr
- Hot days in 30 yrs
- 19 days/yr
Wind risk 2/10 · Minimal
- Chance of severe wind over 30 yrs
- 1.0%
Air-quality risk 2/10 · Minimal
- Unhealthy air days now
- 1 days/yr
- Unhealthy air days in 30 yrs
- 1 days/yr
Risk factors via First Street. Map © Google.
Why this score? — see what drove the C- grade
The composite is a weighted blend of 9 inputs, each scored 0–100. Each bar is that input's sub-score; the figure is the points it added to the 100-point composite (weight × sub-score).
- Cash flow +20.0/30.0
- ARV discount +7.5/15.0
- DSCR +6.3/10.0
- 1% rule +5.6/10.0
- Rent growth +4.0/5.0
- Schools +3.7/10.0
- Livability +3.5/5.0
- Condition / age +2.5/5.0
- Appreciation +0.0/10.0
$445,000
🖨 Deal sheet 📄 Offer letter ✓ Due diligence
Multi-family units
County records classify this as Multi-Family (5+ Unit). Listing-text estimate: 5 units. confirmed
5+ unit building — per-unit beds/baths from public records are typically unavailable; the breakdown below (if shown) is an estimate from the listing text.
Listing remarks
Opportunity to own a solid cash-flowing 5-unit building in Colerain! 4- 1 bed/bath units and 1- 2 bed/1.5 bath unit. 2 units updated recently, other 3 have long term stable residents. Coin laundry machines in basememt are owner owned, providing additional income. Great location and room to increase rents with minimal work, and immediate cashflow! 24 hr notice to show. Property also being marketed as a package deal with 3078, 3096, and 3108 Harry Lee Lane a few doors down. Same type of buildings. Owner/Agent
Key facts
- Updated units
- 4 garage spots
- Built 1960
Tags
Property features AI
Finance
- Other: Zoned for multi-family; Location: Groesbeck; directions — Colerain Ave to Harry Lee Lane
- Financial info: Reported maintenance expense: $4,000; Separate gas/electric metering (individual utilities); Unit rents reported: 1-bed units $860, 2-bed unit $995
- HOA & community: Maintenance expense reported
Exterior
- Parking: 4 garage spaces; 5 open parking spaces; Concrete driveway, off-street and private parking
- Utilities: Public water; Public sewer; Natural gas; Owner pays water; Separate furnace not provided
- Home design: Multi-family property; Two levels; One building
- Construction: Brick construction; Shingle roof; Poured foundation; Vinyl windows; Built with multiple units (5 total)
- Exterior features: Porch
Interior
- Bedrooms: Four 1-bedroom units; One 2-bedroom unit
- Heating & cooling: Hot water heat (owner pays); Wall A/C units; Natural gas available; Separate gas/electric utilities for units
- Interior features: Full basement; Coin laundry; Smoke alarm
- Laundry & utility: On-site coin laundry
Neighborhood map
What this means for you Summary
Snapshot
- This is a 4×1.0bd/1.5ba + 1×2.0bd/1.5ba units multifamily listed at $445k.
Deal economics
- At list price, monthly cash flow is $543 ($7k/yr) — positive. Per door: $109/mo.
- The deal already cash-flows at list — no discount required.
- Meets the 1% rule at list price ($5k rent vs $445k).
- Recommended offer: $405k (9.0% below list) — sets the bar for market timing.
Location & tenants
- Location reads 69/100 on livability (#499 in OH) — a middle-class / working-renter tenant base. Strengths: cost of living A+, housing A+, employment A-; Watch: health & safety C-, schools D-, amenities F.
- Northwest Local (suburban): math 38% / reading 46% proficiency, ranked #508 of 656 in OH (top 77%) — families likely to look elsewhere, expect single-tenant / working-renter base with shorter leases.
- Market conditions: Rents rising fast (+6.0%/yr); 57 active listings in the ZIP; 801 units permitted in Hamilton County in 2024 (190 in 5+ unit buildings).
- At $4,714/mo this rent would consume 94% of the median local household income ($60k/yr) (locally 1566% of renters already pay >50% of income on rent) — very limited rent-growth headroom before tenants either downsize or default.
Forward outlook
- Local home prices are declining (-3.0%/yr); year-one equity from $3k of loan paydown is wiped out by about $13k of value loss. Plan a longer hold.
Negotiation context
- It's been on market 92 days — a 9% lower offer ($405k) is reasonable based on typical stale-listing flexibility.
- 5 sale attempts since 2y ago with the ask held roughly flat each time — persistent listings suggest the price (not the market) is what's stuck; bring a comps-based counter.
Questions for the listing agent
- It's been on market 92 days. Have you received any prior offers? Is the seller open to a 9% concession, seller financing, or rate buy-down credit?
- Can we see the unit-by-unit rent roll, current vacancy, and any below-market leases? What's the average tenancy length?
- What capital expenditures (roof, boiler, parking lot, exteriors) have been made in the last 5 years, and what's planned in the next 2?
- Built in 1960 — when were the roof, HVAC, electrical panel, plumbing, and water heater last replaced?
- Why hasn't it sold? Are there any deal-killer items the seller is aware of (foundation, flood, title, zoning, code violations)?
- Is there a deadline driving the sale (1031 exchange, divorce, estate, relocation)? That informs how much negotiation room exists.
- Schools are D-rated, which usually means shorter tenancies and higher turnover. Who's the typical renter profile here, and what's been the actual vacancy rate?
- What's the average days-on-market for RENTAL listings here right now (not sales)? A rising rental-DOM trend means longer vacancies and softer asking-rent achievability than the comps imply.
- What's the recent tenant-quality profile in this submarket — average credit score on applications, eviction rate, late-payment / NSF rate, and stable-employment percentage? A property-management company in the area should have these aggregated.
- How much new apartment / multifamily construction is in the pipeline within 1–3 miles? Heavy new supply (>2% of stock underway) typically softens rents 12–24 months out; light construction supports rent growth.
Investment metrics
- 1% rule
- 1.06% ✓
- Cap rate
- 7.76%
- Cash-on-cash
- 5.23%
- DSCR
- 1.23
- GRM
- 7.9
CMA / ARV
No comps found within radius.
Projected returns pro-forma
-3.0% appreciation · 6.0% rent growth · sell at horizon
- IRR
- -4.7%
- Equity multiple
- 0.82×
- Total profit
- $-22,741
- Equity at exit
- $66,351
- IRR
- 8.2%
- Equity multiple
- 1.72×
- Total profit
- $89,237
- Equity at exit
- $38,475
Cash invested: $124,600 (down + closing). Projections, not guarantees.
Landlord ↔ Tenant lean methodology
- Overall (STATE)
- 73 Landlord-Friendly
- State Ohio
- 73 Landlord-Friendly · R+6
- County
- — inherits STATE
- City
- — inherits STATE
ZIP-level market 45239
- Home prices YoY
- -32.8%
- Rents YoY
- 6.0%
- Active inventory
- 57
- Price-to-rent
- 40.0×
Monthly cashflow live
- Estimated rent
- $4,714 medium interval (Pro) →
- Mortgage (P&I)
- −$2,334
- Tax from tax record
- −$662 /mo · $7,946/yr
- Insurance
- −$185
- HOA
- −$0
- Vacancy / Maint / Mgmt
- −$990
- Net cashflow
- $543
Break-even live
5-unit breakdown (identical units grouped — click to expand)
| Units | Beds | Baths | Est. rent |
|---|---|---|---|
| 4× units | 1.0 | 1.5 | $3,712 |
| #1 | 1.0 | 1.5 | $928 |
| #2 | 1.0 | 1.5 | $928 |
| #3 | 1.0 | 1.5 | $928 |
| #4 | 1.0 | 1.5 | $928 |
| 1× unit | 2.0 | 1.5 | $1,002 |
| Total (5 units) | $4,714 | ||
UW: 25.0% down · 7.5% · 30yr · 1.5% tax · 5.0% vac · 8.0% maint · 8.0% mgmt
Financing live
Cash to close
- Down payment
- $111,250
- Closing costs
- $13,350
- Reserves months
- —
- Total cash needed
- —
Loan-product check · same deal, 3 products live
Conventional
25% down · 7.5% · 30yr
- Down + closing
- —
- Monthly P&I
- —
- Monthly cashflow
- —
- DSCR
- —
- Eligible?
- —
Personal DTI + credit; lowest rate.
DSCR
20% down · 8.5% · 30yr
- Down + closing
- —
- Monthly P&I
- —
- Monthly cashflow
- —
- DSCR
- —
- Eligible?
- —
No personal income docs; deal must DSCR.
Hard money
10% down · 12.0% · 12mo
- Down + closing
- —
- Monthly P&I
- —
- Monthly cashflow
- —
- DSCR
- —
- Eligible?
- —
Short-term bridge; refi at stabilization.
Listing history 25 events
-
2026-06-18days on market $445,000 Active 92 DOM
-
2026-06-18status $445,000 Active 91 DOM
-
2026-06-17days on market $445,000 Contingency Pending 91 DOM
-
2026-06-16days on market $445,000 Contingency Pending 90 DOM
-
2026-06-15days on market $445,000 Contingency Pending 89 DOM
-
2026-06-13days on market $445,000 Contingency Pending 87 DOM
-
2026-06-12days on market $445,000 Contingency Pending 86 DOM
-
2026-06-09days on market $445,000 Contingency Pending 83 DOM
-
2026-06-08days on market $445,000 Contingency Pending 82 DOM
-
2026-06-08days on market $445,000 Contingency Pending 81 DOM
-
2026-06-07days on market $445,000 Contingency Pending 80 DOM
-
2026-06-04days on market $445,000 Contingency Pending 77 DOM
-
2026-06-02days on market $445,000 Contingency Pending 76 DOM
-
2026-06-01days on market $445,000 Contingency Pending 75 DOM
-
2026-05-31days on market $445,000 Contingency Pending 74 DOM
-
2026-04-23historical Contingency Pending
-
2026-03-18$445,000 Active
-
2025-11-03historical $900
-
2025-08-24$900
-
2025-07-19historical $875
-
2025-07-14$875
-
2025-05-30historical $875
-
2025-05-30$875
-
2024-08-23historical $875
-
2024-08-23$875
ⓘ Source: listings_history table (triggers on properties + properties_extension) + one-shot
backfill from property_details.listing_events for pre-trigger history.
Tax reassessment forecast OH · Partial reset (capped growth)
- Current annual tax
- $7,946 · $662/mo
- Projected year-2 tax
- $7,946 · $662/mo
- Expected delta
- $0/yr ($0/mo · 0.0%)
ⓘ Screening estimate from a state-policy table — verify with the county assessor before closing.
Climate risk First Street
- Flood 1/10 Low FEMA zone X (unshaded) · 0% chance over 30 yrs
- Wildfire 1/10 Low
- Heat 4/10 Moderate 7 d/yr ≥103°F today · 19 d/yr by 30 yrs out
- Wind 2/10 Low 100% chance of damaging wind over 30 yrs
- Air quality 2/10 Low 1 unhealthy d/yr today · 1 by 30 yrs out
Nearby sold comps map
Loading sold comps map…
Walkable amenities ~0.75 mi
Loading nearby amenities…
Taxation est. · year 1
- Rental income
- $56,568
- − Mortgage interest
- −$24,927
- − Property taxes
- −$7,946
- − Insurance
- −$2,225
- − Repairs & maintenance
- −$4,525
- − Management
- −$4,525
- − Depreciation
- −$12,945
- Taxable loss
- −$526
- Est. tax savings @ 24.0%
- +$126
- After-tax cash flow
- $6,641/yr
For passive investors: Depreciation is non-cash, so a rental often shows a tax loss while cash-flowing — sheltering income. Rental losses are passive: they offset passive income freely, and up to $25,000/yr can offset ordinary (W-2) income if you actively participate and your MAGI is under $100k (phasing out to $0 by $150k); unused losses carry forward. On sale, claimed depreciation is recaptured at up to 25%, and gains may owe capital-gains tax (a 1031 exchange can defer both). Figures are a year-1 estimate at your 24.0% rate — not tax advice; consult a CPA.
Schools (NCES district)
- District
- Northwest Local
- NCES district ID
- 3904736
- Math proficiency
- 38% ▼ -18.00%
- Reading proficiency
- 46% ▼ -10.00%
- Median HH income
- $58,765
- Composite
- 36.97/100
- National rank
- #4528
- State rank
- #508 of 656 in OH
Livability — White Oak
- Score
- 69/100
- State rank
- #499
- US rank
- #8343
Category grades
Schools grade is shown separately in the Schools card above.
Census & demographics
- Census place
- White Oak, OH
- County
- Hamilton County · 701,295 people
- City population
- 29,035
- Metro
- Cincinnati, OH-KY-IN
- Population (ZIP)
- 29,607
- Household income
- $60,324
- Rent vs Own
- Severe rent burden
- 1566.0
Population outlook (Hamilton County) Hauer SSP2
- Today (2025)
- 826,054 people
- By 2030
- 830,947 · +0.6%
- By 2040
- 832,319 · +0.8%
- By 2050
- 822,428 · -0.4%
- By 2075
- 788,688 · -4.5%
- By 2100
- 710,674 · -14.0%
Race, ethnicity, and origin ACS 2023
- Neighborhood character
- Diverse neighborhood (Simpson 0.63)
- Race & ethnicity
- White 50% Black 35% Two or more races 8% Hispanic / Latino 4% Asian 4%
- Common ancestry
- Lithuanian 2% Slovak 1% Italian 1%
- Foreign-born
- 4% · India, Canada
- Languages at home
- 93% English-only · Other Indo-European 3% Spanish 2%
Political lean MEDSL · Hamilton
- 2024 margin
- D (+14.9) · D 57.0% · R 42.1%
- 2008→2024 swing
- +7.9pp toward D · 2008: 7.0pp · 2024: 14.9pp
- All cycles
- 2024: D+14.9 2020: D+15.9 2016: D+9.5 2012: D+4.9 2008: D+7.0
Not yet ingested
- Civics
- —
Market trends
- HPI YoY
- ▼ -114.46%
- Current HPI
- 234.6033
- Rent YoY
- ▲ 6.00%
- Metro
- Cincinnati, OH-KY-IN
- State GDP YoY
- ▲ 1.98%
- F500 in state
- 48
Industry mix (Fortune 500 HQ in OH)
| Industry | F500 HQs | Revenue |
|---|---|---|
| Insurance | 3 | $145B |
|
||
| Industrial Machinery | 3 | $49B |
|
||
| Financial Services | 3 | $24B |
|
||
| Consumer Goods | 2 | $93B |
|
||
| Aerospace / Defense | 2 | $47B |
|
||
| Utilities | 2 | $33B |
|
||
Price history
10 events — show timeline
- 2026-04-23 Contingent — Cincy MLS
- 2026-03-18 Listed $445,000 Cincy MLS
- 2025-11-03 Rental Removed $900 RENTALBEAST
- 2025-08-24 Listed for Rent $900 RENTALBEAST
- 2025-07-19 Rental Removed $875 RENTALBEAST
- 2025-07-14 Listed for Rent $875 RENTALBEAST
- 2025-05-30 Rental Removed $875 LEASESTAR
- 2025-05-30 Listed for Rent $875 LEASESTAR
- 2024-08-23 Rental Removed $875 LEASESTAR
- 2024-08-23 Listed for Rent $875 LEASESTAR
Property tax history
+6.5%/yrLatest (2025): $7,946 · +4.1% YoY. Source: county tax records.
Cash-flow waterfall
monthlySold comps — $/sqft
last 12 mo · ≤1 miLoading sold comps…