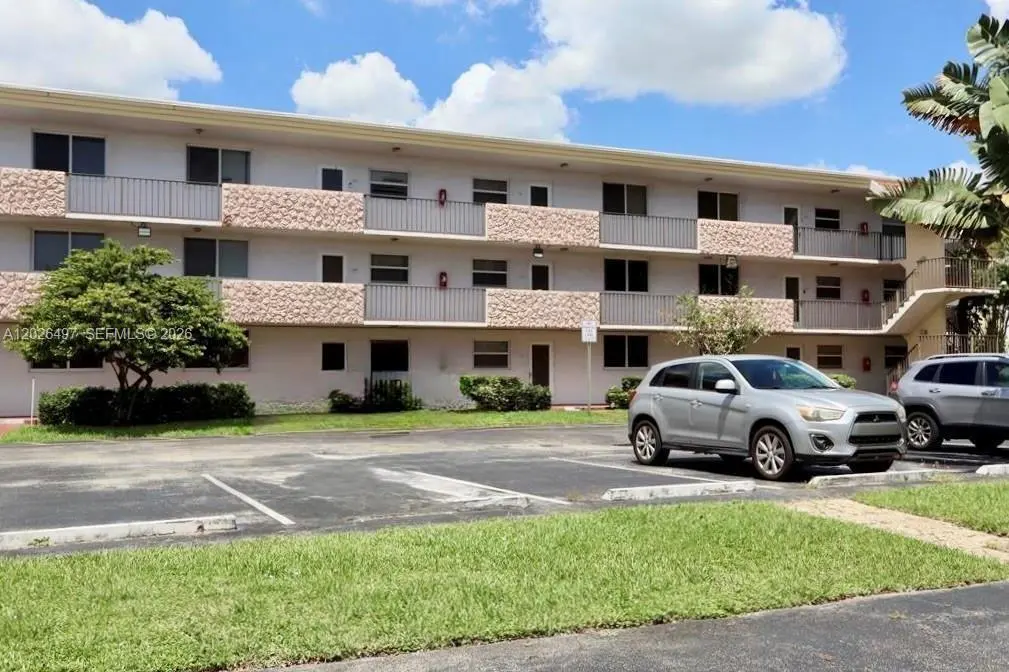
5985 Del Lago Cir #215 · Sunrise, FL
Flood risk 1/10 · Minimal
- FEMA flood zone
- AH
- Chance of flooding over 30 yrs
- 0.0%
- Est. flood insurance / yr
- $1,142 – $2,507
Fire risk 1/10 · Minimal
- Est. fire insurance / yr
- $947 – $1,759
Heat risk 10/10 · Severe
- Hot days now (above 105°F)
- 7 days/yr
- Hot days in 30 yrs
- 27 days/yr
Wind risk 10/10 · Severe
- Chance of severe wind over 30 yrs
- 99.0%
Air-quality risk 2/10 · Minimal
- Unhealthy air days now
- 2 days/yr
- Unhealthy air days in 30 yrs
- 2 days/yr
Risk factors via First Street. Map © Google.
Why this score? — see what drove the D+ grade
The composite is a weighted blend of 9 inputs, each scored 0–100. Each bar is that input's sub-score; the figure is the points it added to the 100-point composite (weight × sub-score).
- Cash flow +14.3/30.0
- 1% rule +7.9/10.0
- ARV discount +7.5/15.0
- DSCR +4.3/10.0
- Livability +4.2/5.0
- Schools +4.1/10.0
- Rent growth +2.6/5.0
- Condition / age +2.5/5.0
- Appreciation +0.0/10.0
$160,000
🖨 Deal sheet 📄 Offer letter ✓ Due diligence
Listing remarks
Beautiful 2BR/2BA condo located on the second floor in the desirable 55+ Waterbridge community. This unit features hurricane-impact windows and doors, a bright layout, and an enclosed balcony—perfect for morning coffee. Laundry facilities available in the building and assigned parking included. Prime location close to shopping, dining, and major highways. Being sold AS IS. Seller will not make any repairs—no post-contract repairs or credits. Buyer is responsible for conducting their own due diligence and independently verifying all HOA restrictions and all other relevant information. 55+ community with buyer approval required. Seller requires 30 days of post-occupancy after clos
Key facts
- Enclosed balcony
- Assigned parking
- Prime location
Tags
Property features AI
Finance
- Other: Monthly association fee of $501
- Financial info: Lease considered; Pets not allowed
- HOA & community: Monthly association fee; Association amenities include clubhouse, fitness center, barbecue/picnic area, pool, and elevators; Senior community
Exterior
- Parking: Guest parking; One assigned space
- Security: Security/high-impact doors
- Home design: 3-story property; Entry on level 2; Attached property
- Construction: Block construction; Resale property
- Exterior features: Barbecue; Security/high-impact doors; Association pool
Interior
- Kitchen: Microwave; Refrigerator
- Bedrooms: Bedroom located on the main level
- Bathrooms: 2 full bathrooms
- Heating & cooling: Central heating; Central air conditioning
- Interior features: Impact glass windows; Bedroom on main level; Second-floor entry; Unfurnished
- Laundry & utility: Electric water heater
Neighborhood map
What this means for you Summary
Snapshot
- This is a 2-bed/2.0-bath condo listed at $160k.
Deal economics
- At list price, monthly cash flow is $-123 ($-1k/yr) — negative.
- To cash-flow at today's rent, offer at most $142k (11.1% below list).
- Meets the 1% rule at list price ($2k rent vs $160k).
- Recommended offer: $142k (11.1% below list) — sets the bar for cash-flow.
- Cap rate 6.5% vs local median 4.9% in Sunrise — top-decile yield for the area; either an underpriced asset or a hidden risk that comps aren't pricing in. Stress-test before assuming the spread holds.
Location & tenants
- Location reads 83/100 on livability (#56 in FL, #986 nationally) — a professional / high-income tenant draw. Strengths: commute A+, housing A+, health & safety A+; Watch: employment C-, amenities F.
- Broward (suburban): math 42% / reading 53% proficiency, ranked #46 of 73 in FL (top 63%) — families likely to look elsewhere, expect single-tenant / working-renter base with shorter leases.
- Market conditions: Rents flat; 656 active listings in the ZIP; 40 comparable units currently listed for rent nearby; rentals at typical pace (median 25d on market — plan ~3-4 weeks tenant-placement turnaround); 2,111 units permitted in Broward County in 2024 (1,265 in 5+ unit buildings).
- At $2,071/mo this rent would consume 54% of the median local household income ($46k/yr) (locally 5692% of renters already pay >50% of income on rent) — very limited rent-growth headroom before tenants either downsize or default.
Forward outlook
- Local home prices are declining (-3.0%/yr); year-one equity from $1k of loan paydown is wiped out by about $5k of value loss. Plan a longer hold.
- Broward County population projected at +34% by 2050 — long-run rental-demand tailwind backs the buy-and-hold thesis.
Negotiation context
- It's been on market 17 days — a 2% lower offer ($158k) is reasonable based on typical stale-listing flexibility.
- 3 sale attempts since 2y ago with the ask held roughly flat each time — persistent listings suggest the price (not the market) is what's stuck; bring a comps-based counter.
Risks & watch-outs
- Watch-outs: flood insurance adds $152/mo; HOA is 24% of rent.
- Climate carrying-cost: in FEMA flood zone AH (mandatory federal flood insurance); severe wind risk, 99% chance of damaging wind over 30y; extreme-heat days projected 7→27/yr by 2055 (HVAC capex compounding) — expect insurance premiums to compound above CPI over the hold.
Questions for the listing agent
- What do current leases actually rent for vs. the listed asking? Can we see a recent rent roll and the last 12 months of T-12 income?
- Built in 1979 — when were the roof, HVAC, electrical panel, plumbing, and water heater last replaced?
- What's the actual annual flood-insurance premium (NFIP or private), and is the property in a SFHA with mandatory coverage?
- What does the HOA fee cover, when was the last increase, and are there any pending special assessments or reserve-fund shortfalls?
- Any open or pending special assessments — roof, HVAC, plumbing, elevator, façade? What's the per-unit balance and payoff schedule, and is the seller paying it off at close or rolling it to the buyer?
- Is there a deadline driving the sale (1031 exchange, divorce, estate, relocation)? That informs how much negotiation room exists.
- The area grade is low — what's the realistic commute time and amenity access for the typical tenant pool here? Any planned neighborhood developments (good or bad) we should know about?
- What's the average days-on-market for RENTAL listings here right now (not sales)? A rising rental-DOM trend means longer vacancies and softer asking-rent achievability than the comps imply.
- What's the recent tenant-quality profile in this submarket — average credit score on applications, eviction rate, late-payment / NSF rate, and stable-employment percentage? A property-management company in the area should have these aggregated.
- How much new apartment / multifamily construction is in the pipeline within 1–3 miles? Heavy new supply (>2% of stock underway) typically softens rents 12–24 months out; light construction supports rent growth.
Investment metrics
- 1% rule
- 1.29% ✓
- Cap rate
- 6.51%
- Cash-on-cash
- 0.78%
- DSCR
- 1.03
- GRM
- 6.4
CMA / ARV
No comps found within radius.
Projected returns pro-forma
-3.0% appreciation · 0.26% rent growth · sell at horizon
- IRR
- -26.7%
- Equity multiple
- 0.13×
- Total profit
- $-38,872
- Equity at exit
- $23,857
- IRR
- -52.0%
- Equity multiple
- -0.42×
- Total profit
- $-63,749
- Equity at exit
- $13,834
Cash invested: $44,800 (down + closing). Projections, not guarantees.
Landlord ↔ Tenant lean methodology
- Overall (STATE)
- 87 Strongly Landlord-Friendly
- State Florida
- 87 Strongly Landlord-Friendly · R+3
- County
- — inherits STATE
- City
- — inherits STATE
ZIP-level market 33313
- Rents YoY
- 0.3%
- Active inventory
- 656
- Price-to-rent
- 6.4×
Monthly cashflow live
- Estimated rent
- $2,071 high interval (Pro) →
- Mortgage (P&I)
- −$839
- Tax est. 1.5%
- −$200 /mo · $2,400/yr
- Insurance
- −$67
- Flood insurance flood zone
- −$152 /mo · $1,824/yr
- HOA
- −$501
- Vacancy / Maint / Mgmt
- −$435
- Net cashflow
- $-123
Break-even live
UW: 25.0% down · 7.5% · 30yr · 1.5% tax · 5.0% vac · 8.0% maint · 8.0% mgmt
Financing live
Cash to close
- Down payment
- $40,000
- Closing costs
- $4,800
- Reserves months
- —
- Total cash needed
- —
Loan-product check · same deal, 3 products live
Conventional
25% down · 7.5% · 30yr
- Down + closing
- —
- Monthly P&I
- —
- Monthly cashflow
- —
- DSCR
- —
- Eligible?
- —
Personal DTI + credit; lowest rate.
DSCR
20% down · 8.5% · 30yr
- Down + closing
- —
- Monthly P&I
- —
- Monthly cashflow
- —
- DSCR
- —
- Eligible?
- —
No personal income docs; deal must DSCR.
Hard money
10% down · 12.0% · 12mo
- Down + closing
- —
- Monthly P&I
- —
- Monthly cashflow
- —
- DSCR
- —
- Eligible?
- —
Short-term bridge; refi at stabilization.
Rent comps 40 comps
| Address | Beds | Baths | Sqft | Rent | $/sqft | DOM | Units | Dist |
|---|---|---|---|---|---|---|---|---|
| 6121 NW 11th St Sunrise, FL | 2.0 | 1.0 | 800 | $1,800 | $2.25 | 24d | 1 | 0.16mi |
| 6290 NW 14th St Unit 6290 Sunrise, FL | 2.0 | 1.0 | 900 | $2,350 | $2.61 | 24d | 1 | 0.32mi |
| 5615 NW 14th St Lauderhill, FL | 2.0 | 1.0 | 800 | $1,750 | $2.19 | 24d | 1 | 0.41mi |
| 5495 NW 10th Ct #104 Plantation, FL | 1.0 | 1.0 | 790 | $1,550 | $1.96 | 24d | 1 | 0.47mi |
| 5420 NW 11th St #307 Lauderhill, FL | 2.0 | 2.0 | 899 | $1,790 | $1.99 | 24d | 1 | 0.51mi |
| 5980 NW 16th Pl Sunrise, FL | 1.0–2.0 | 1.0–2.0 | 797 | $1,700 | $2.13 | 24d | 1 | 0.54mi |
| 5960 NW 16th Pl Sunrise, FL | 1.0–2.0 | 1.0–2.0 | 797 | $1,700 | $2.13 | 24d | 1 | 0.54mi |
| 5990 NW 16th Pl Sunrise, FL | 1.0–2.0 | 1.0–2.0 | 801 | $1,700 | $2.12 | 24d | 1 | 0.54mi |
| 1611 NW 63rd Ave Unit 2 Sunrise, FL | 1.0 | 1.0 | 750 | $1,350 | $1.80 | 24d | 1 | 0.55mi |
| 5971 NW 16th Pl Sunrise, FL | 1.0–2.0 | 1.0 | 715 | $1,700 | $2.38 | 24d | 1 | 0.58mi |
| 5335 NW 10th Ct #307 Plantation, FL | 2.0 | 1.0 | 870 | $1,725 | $1.98 | 7d | 1 | 0.58mi |
| 5335 NW 10th Ct #307 Plantation, FL | 2.0 | 1.0 | 870 | $1,725 | $1.98 | 17d | 1 | 0.58mi |
| 5941 NW 16th Pl Sunrise, FL | 1.0–2.0 | 1.0–1.5 | 772 | $1,700 | $2.20 | 24d | 1 | 0.58mi |
| 5861 NW 16th Pl #307 Sunrise, FL | 3.0 | 2.0 | 1321 | $2,500 | $1.89 | 20d | 1 | 0.60mi |
| 5861 NW 16th Pl #307 Sunrise, FL | 3.0 | 2.0 | 1321 | $2,500 | $1.89 | 7d | 1 | 0.60mi |
| 5421-5425 NW 15th Ct Unit 5425 Lauderhill, FL | 2.0 | 1.0 | 890 | $1,950 | $2.19 | 12d | 1 | 0.62mi |
| 5260 NW 11th St #201 Lauderhill, FL | 2.0 | 2.0 | 1060 | $2,100 | $1.98 | 24d | 1 | 0.62mi |
| 6821-6825 NW 11th Pl Unit 6825 Plantation, FL | 3.0 | 2.0 | 1481 | $2,900 | $1.96 | 11d | 1 | 0.63mi |
| 1700 NW 58th Ter Sunrise, FL | 2.0 | 2.0 | 1020 | $1,950 | $1.91 | 11d | 2 | 0.69mi |
| 6815 NW 14th St Unit 6815 Plantation, FL | 1.0 | 1.0 | 1470 | $1,350 | $0.92 | 14d | 1 | 0.70mi |
| 5224 NW 16th St Unit 3 Lauderhill, FL | 2.0 | 2.0 | 900 | $2,200 | $2.44 | 12d | 1 | 0.70mi |
| 5971 NW 17th Pl Sunrise, FL | 1.0–3.0 | 1.0–2.0 | 1325 | $2,200 | $1.66 | 14d | 10 | 0.71mi |
| 1788 NW 55th Ave Lauderhill, FL | 3.0 | 2.5 | 1413 | $2,500 | $1.77 | 24d | 1 | 0.79mi |
| 1788 NW 55th Ave #203 Lauderhill, FL | 3.0 | 2.5 | 1413 | $2,200 | $1.56 | 24d | 1 | 0.79mi |
| 1788 NW 55th Ave #204 Lauderhill, FL | 3.0 | 2.5 | 1249 | $2,400 | $1.92 | 24d | 1 | 0.79mi |
| 1752 NW 55th Ave #203 Lauderhill, FL | 3.0 | 2.5 | 1249 | $2,750 | $2.20 | 24d | 1 | 0.80mi |
| 1752 NW 55th Ave #203 Lauderhill, FL | 3.0 | 2.5 | 1249 | $2,700 | $2.16 | 7d | 1 | 0.80mi |
| 5436 NW 18th St Lauderhill, FL | 2.0 | 1.0 | 1150 | $1,750 | $1.52 | 24d | 1 | 0.80mi |
| 5972 NW 19th St Unit 3 Lauderhill, FL | 1.0 | 1.0 | 700 | $1,450 | $2.07 | 14d | 1 | 0.82mi |
| 5400 NW 18th St Unit 3N Lauderhill, FL | 3.0 | 2.0 | 1350 | $2,475 | $1.83 | 24d | 1 | 0.83mi |
| 1801 NW 54th Ter Lauderhill, FL | 3.0 | 2.0 | 1300 | $2,450 | $1.88 | 24d | 1 | 0.83mi |
| 5332 NW 18th St Unit 3-X Lauderhill, FL | 3.0 | 2.0 | 1350 | $2,495 | $1.85 | 24d | 1 | 0.83mi |
| 1848 NW 55th Ave Unit 4X Lauderhill, FL | 3.0 | 2.0 | 1350 | $2,495 | $1.85 | 24d | 1 | 0.86mi |
| 5880 NW 19th Ct Unit 5888 Lauderhill, FL | 2.0 | 1.0 | 750 | $1,775 | $2.37 | 3d | 1 | 0.88mi |
| 5300 NW 18th Ct Unit 4I Lauderhill, FL | 3.0 | 2.0 | 1350 | $2,200 | $1.63 | 22d | 1 | 0.90mi |
| 510 E Acre Dr Plantation, FL | 3.0 | 2.0 | 1450 | $3,950 | $2.72 | 10d | 1 | 0.90mi |
| 510 E Acre Dr Plantation, FL | 3.0 | 2.0 | 1450 | $4,600 | $3.17 | 14d | 1 | 0.90mi |
| 406 NW 68th Ave Plantation, FL | 1.0–2.0 | 1.5–2.0 | 1100 | $2,000 | $1.82 | 24d | 3 | 0.90mi |
| 406 NW 68th Ave Plantation, FL | 1.0–2.0 | 1.5–2.0 | 1100 | $2,000 | $1.82 | 3d | 3 | 0.90mi |
| 5317 NW 18th Ct Unit 5317 Lauderhill, FL | 3.0 | 2.0 | 1000 | $2,300 | $2.30 | 4d | 1 | 0.91mi |
HOA detail condo
- Monthly dues
- $501 · $6,012/yr
- Likely covers
- waterparking
- Assessments
- None detected in remarks — confirm with the listing agent.
Listing history 12 events
-
2026-06-18days on market $160,000 Active 17 DOM
-
2026-06-17days on market $160,000 Active 16 DOM
-
2026-06-16days on market $160,000 Active 15 DOM
-
2026-06-15days on market $160,000 Active 14 DOM
-
2026-06-13days on market $160,000 Active 12 DOM
-
2026-06-09days on market $160,000 Active 8 DOM
-
2026-06-08days on market $160,000 Active 7 DOM
-
2026-06-07days on market $160,000 Active 6 DOM
-
2026-06-04days on market $160,000 Active 3 DOM
-
2026-06-03days on market $160,000 Active 2 DOM
-
2026-06-02remarks 687-char remark
-
2026-06-02$160,000 Active 1 DOM
ⓘ Source: listings_history table (triggers on properties + properties_extension) + one-shot
backfill from property_details.listing_events for pre-trigger history.
Climate risk First Street
- Flood 1/10 Low FEMA zone AH · 0% chance over 30 yrs
- Wildfire 1/10 Low
- Heat 10/10 Extreme 7 d/yr ≥105°F today · 27 d/yr by 30 yrs out
- Wind 10/10 Extreme 99% chance of damaging wind over 30 yrs
- Air quality 2/10 Low 2 unhealthy d/yr today · 2 by 30 yrs out
Nearby sold comps map
Loading sold comps map…
Walkable amenities ~0.75 mi
Loading nearby amenities…
Taxation est. · year 1
- Rental income
- $24,850
- − Mortgage interest
- −$8,962
- − Property taxes
- −$2,400
- − Insurance
- −$2,624
- − Repairs & maintenance
- −$1,988
- − Management
- −$1,988
- − HOA
- −$6,012
- − Depreciation
- −$4,655
- Taxable loss
- −$3,779
- Est. tax savings @ 24.0%
- +$907
- After-tax cash flow
- $-566/yr
For passive investors: Depreciation is non-cash, so a rental often shows a tax loss while cash-flowing — sheltering income. Rental losses are passive: they offset passive income freely, and up to $25,000/yr can offset ordinary (W-2) income if you actively participate and your MAGI is under $100k (phasing out to $0 by $150k); unused losses carry forward. On sale, claimed depreciation is recaptured at up to 25%, and gains may owe capital-gains tax (a 1031 exchange can defer both). Figures are a year-1 estimate at your 24.0% rate — not tax advice; consult a CPA.
Schools (NCES district)
- District
- Broward
- NCES district ID
- 1200180
- Math proficiency
- 42% ▼ -18.00%
- Reading proficiency
- 53% ▼ -5.00%
- Median HH income
- $52,139
- Composite
- 40.88/100
- National rank
- #3621
- State rank
- #46 of 73 in FL
Livability — Sunrise
- Score
- 83/100
- State rank
- #56
- US rank
- #986
Category grades
Schools grade is shown separately in the Schools card above.
Census & demographics
- Census place
- Sunrise, FL
- County
- Broward County · 1,963,430 people
- City population
- 77,492
- Metro
- Miami-Fort Lauderdale-Pompano Beach, FL
- Population (ZIP)
- 62,807
- Household income
- $46,305
- Rent vs Own
- Severe rent burden
- 5692.0
Population outlook (Broward County) Hauer SSP2
- Today (2025)
- 2,207,033 people
- By 2030
- 2,360,704 · +7.0%
- By 2040
- 2,661,208 · +20.6%
- By 2050
- 2,946,698 · +33.5%
- By 2075
- 3,602,273 · +63.2%
- By 2100
- 3,970,984 · +79.9%
Race, ethnicity, and origin ACS 2023
- Neighborhood character
- Predominantly Black (77%)
- Race & ethnicity
- Black 77% Hispanic / Latino 12% Two or more races 8% White 7% Asian 2%
- Hispanic origin (detail)
- Puerto Rican 2% Cuban 3% Dominican 1%
- Common ancestry
- Hispanic 20%
- Foreign-born
- 39% · Canada, Jamaica, Dominican Republic
- Languages at home
- 66% English-only · French/Haitian/Cajun 22% Spanish 10%
Political lean MEDSL · Broward
- 2024 margin
- D (+17.0) · D 58.0% · R 41.0%
- 2008→2024 swing
- -17.8pp toward R · 2008: 34.7pp · 2024: 17.0pp
- All cycles
- 2024: D+17.0 2020: D+29.8 2016: D+35.0 2012: D+34.9 2008: D+34.7
Not yet ingested
- Civics
- —
Market trends
- HPI YoY
- ▼ -338.15%
- Current HPI
- 288.9345
- Rent YoY
- ▲ 0.26%
- Metro
- Miami-Fort Lauderdale-Pompano Beach, FL
- State GDP YoY
- ▲ 3.28%
- F500 in state
- 36
Industry mix (Fortune 500 HQ in FL)
| Industry | F500 HQs | Revenue |
|---|---|---|
| Industrial Technology | 2 | $29B |
|
||
| Insurance | 2 | $17B |
|
||
| Retail | 1 | $60B |
|
||
| Technology Distribution | 1 | $58B |
|
||
| Homebuilding | 1 | $35B |
|
||
| Technology Manufacturing | 1 | $35B |
|
||
Price history
+300.0% since first listed10 events — show timeline
- 2026-05-26 Listed $160,000 MARMLS
- 2025-06-23 Listing Removed — MARMLS
- 2025-06-21 Listed $144,900 MARMLS
- 2024-08-23 Listing Removed — MARMLS
- 2024-08-13 Price Changed $143,700 MARMLS
- 2024-06-27 Listed $170,000 MARMLS
- 2023-09-15 Sold (Public Records) $165,000 Public Records
- 2017-06-22 Sold (Public Records) $52,500 Public Records
- 1996-06-03 Sold (Public Records) $31,000 Public Records
- 1990-11-14 Sold (Public Records) $40,000 Public Records
Property tax history
+5.9%/yrLatest (2025): $310 · +10.7% YoY. Source: county tax records.
Cash-flow waterfall
monthlySold comps — $/sqft
last 12 mo · ≤1 miLoading sold comps…