623 Park St #3 · Stevensville, MT
Flood risk 4/10 · Minor
- FEMA flood zone
- X (unshaded)
- Chance of flooding over 30 yrs
- 0.2%
- Est. flood insurance / yr
- $507 – $1,088
Fire risk 7/10 · Major
- Est. fire insurance / yr
- $918 – $1,706
Heat risk 3/10 · Minor
- Hot days now (above 93°F)
- 7 days/yr
- Hot days in 30 yrs
- 17 days/yr
Wind risk 1/10 · Minimal
- Chance of severe wind over 30 yrs
- —
Air-quality risk 10/10 · Severe
- Unhealthy air days now
- 34 days/yr
- Unhealthy air days in 30 yrs
- 36 days/yr
Risk factors via First Street. Map © Google.
Why this score? — see what drove the B- grade
The composite is a weighted blend of 9 inputs, each scored 0–100. Each bar is that input's sub-score; the figure is the points it added to the 100-point composite (weight × sub-score).
- Cash flow +30.0/30.0
- 1% rule +10.0/10.0
- DSCR +10.0/10.0
- ARV discount +7.5/15.0
- Schools +3.6/10.0
- Livability +3.5/5.0
- Rent growth +2.5/5.0
- Condition / age +2.5/5.0
- Appreciation +0.0/10.0
$82,900
🖨 Deal sheet (PDF) 📄 Offer letter ✓ Due diligence
Key facts
- New flooring
- 2x6 walls
- Excellent location
Tags
Property features AI
Finance
- Financial info: Land is leased; Annual tax listed
Exterior
- Utilities: Public water; Public sewer; Electricity connected; Natural gas connected; Natural gas available
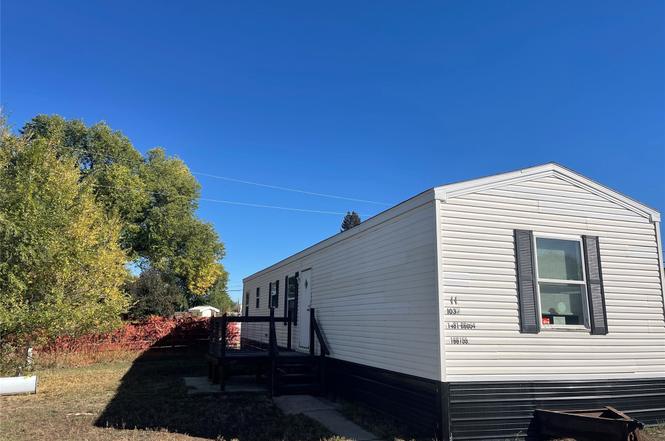
- Home design: Manufactured home (Single Wide); Residential property; Updated/Remodeled condition
- Construction: Other foundation
- Exterior features: Gravel road access; Private maintained road; Private road frontage
Interior
- Kitchen: Range; Refrigerator
- Bathrooms: 1 full bathroom
- Heating & cooling: Has heating; Fireplace(s)
- Interior features: Fireplace(s); Range; Refrigerator
Neighborhood map
What this means for you Summary
Snapshot
- This is a 3-bed/1.0-bath manufactured listed at $83k.
Deal economics
- At list price, monthly cash flow is $854 ($10k/yr) — positive.
- The deal already cash-flows at list — no discount required.
- Meets the 1% rule at list price ($2k rent vs $83k).
- Recommended offer: $73k (12.0% below list) — sets the bar for market timing.
- Cap rate 18.7% vs local median 1.3% in Stevensville — top-decile yield for the area; either an underpriced asset or a hidden risk that comps aren't pricing in. Stress-test before assuming the spread holds.
Location & tenants
- Location reads 70/100 on livability (#71 in MT) — a middle-class / working-renter tenant base. Strengths: crime A+, cost of living A+, housing B+; Watch: amenities F, commute F, employment F.
- Stevensville H S (rural): math 35% / reading 45% proficiency, ranked #145 of 339 in MT (top 43%) — families likely to look elsewhere, expect single-tenant / working-renter base with shorter leases.
- Zoned schools: Stevensville K-6 (math 24% / reading 42%, grade F, #209 of 293 statewide, top 72%, 505 students, 0% FRL); Stevensville 7-8 (math 37% / reading 42%, grade F, #63 of 146 statewide, top 48%, 151 students, 0% FRL); Stevensville High School (math 32% / reading 52%, grade F, #37 of 132 statewide, top 29%, 349 students, 0% FRL).
- Market conditions: 148 active listings in the ZIP; 27 units permitted in Ravalli County in 2024 (0 in 5+ unit buildings).
Forward outlook
- Local home prices are declining (-3.0%/yr); year-one equity from $573 of loan paydown is wiped out by about $2k of value loss. Plan a longer hold.
- At projected returns (-3.0% appreciation + 3.0% rent growth), your $23k cash investment doubles in ~3 years — after that, you're playing with house money.
Negotiation context
- It's been on market 254 days — a 12% lower offer ($73k) is reasonable based on typical stale-listing flexibility.
- 2 sale attempts; this cycle's ask has dropped $12k (13%) from the opening price — seller is motivated, your offer sets the floor, not the list.
Risks & watch-outs
- Climate carrying-cost: major wildfire risk — expect insurance premiums to compound above CPI over the hold.
Questions for the listing agent
- It's been on market 254 days. Have you received any prior offers? Is the seller open to a 12% concession, seller financing, or rate buy-down credit?
- Why hasn't it sold? Are there any deal-killer items the seller is aware of (foundation, flood, title, zoning, code violations)?
- Is there a deadline driving the sale (1031 exchange, divorce, estate, relocation)? That informs how much negotiation room exists.
- What's the average days-on-market for RENTAL listings here right now (not sales)? A rising rental-DOM trend means longer vacancies and softer asking-rent achievability than the comps imply.
- What's the recent tenant-quality profile in this submarket — average credit score on applications, eviction rate, late-payment / NSF rate, and stable-employment percentage? A property-management company in the area should have these aggregated.
- How much new for-sale + rental construction is in the pipeline within 1–3 miles? Heavy new supply typically softens prices + rents 12–24 months out; constrained supply supports both.
Investment metrics
- 1% rule
- 2.18% ✓
- Cap rate
- 18.66%
- Cash-on-cash
- 44.16%
- DSCR
- 2.96
- GRM
- 3.8
CMA / ARV
- ARV (on-the-fly)
- $351,232
- Comps found
- 2
Show comp detail 2 sales within ~0.75 mi
| Address | Dist | Beds/Ba | Sqft | Sold | Price | $/sf | Match |
|---|---|---|---|---|---|---|---|
| 3588 Baldwin Rd | 0.18mi | 3/2.0 | 1,008 (+12%) | 16mo | $395,000 | $392 | 54 |
| 211 W 3rd St #10 | 0.62mi | 3/1.0 | 916 (+2%) | 22mo | $39,950 | $44 | 49 |
Match score weights: distance 35% · size 25% · config 20% · recency 20%. Top-matched comps best support the ARV.
Projected returns pro-forma
-3.0% appreciation · 3.0% rent growth · sell at horizon
- IRR
- 41.1%
- Equity multiple
- 2.77×
- Total profit
- $40,998
- Equity at exit
- $12,361
- IRR
- 47.4%
- Equity multiple
- 5.56×
- Total profit
- $105,865
- Equity at exit
- $7,168
Cash invested: $23,212 (down + closing). Projections, not guarantees.
Landlord ↔ Tenant lean methodology
- Overall (STATE)
- 82 Strongly Landlord-Friendly
- State Montana
- 82 Strongly Landlord-Friendly · R+11
- County
- — inherits STATE
- City
- — inherits STATE
ZIP-level market 59870
- Active inventory
- 148
- Price-to-rent
- 3.8×
Monthly cashflow live
- Estimated rent
- $1,806 medium interval (Pro) →
- Mortgage (P&I)
- −$435
- Tax est. 1.5%
- −$104 /mo · $1,244/yr
- Insurance
- −$35
- HOA
- −$0
- Vacancy / Maint / Mgmt
- −$379
- Net cashflow
- $854
Break-even live
Sensitivity live
| Price | -10% $911 | -5% $883 | +0% $854 | +5% $826 | +10% $797 |
|---|---|---|---|---|---|
| Rent | -10% $711 | -5% $783 | +0% $854 | +5% $926 | +10% $997 |
| Rate | -1.0pp $896 | -0.5pp $875 | base $854 | +0.5pp $833 | +1.0pp $811 |
UW: 25.0% down · 7.5% · 30yr · 1.5% tax · 5.0% vac · 8.0% maint · 8.0% mgmt
Financing live
Cash to close
- Down payment
- $20,725
- Closing costs
- $2,487
- Reserves months
- —
- Total cash needed
- —
Loan-product check · same deal, 3 products live
Conventional
25% down · 7.5% · 30yr
- Down + closing
- —
- Monthly P&I
- —
- Monthly cashflow
- —
- DSCR
- —
- Eligible?
- —
Personal DTI + credit; lowest rate.
DSCR
20% down · 8.5% · 30yr
- Down + closing
- —
- Monthly P&I
- —
- Monthly cashflow
- —
- DSCR
- —
- Eligible?
- —
No personal income docs; deal must DSCR.
Hard money
10% down · 12.0% · 12mo
- Down + closing
- —
- Monthly P&I
- —
- Monthly cashflow
- —
- DSCR
- —
- Eligible?
- —
Short-term bridge; refi at stabilization.
Listing history 21 events
-
2026-06-21days on market $82,900 Active 254 DOM
-
2026-06-21days on market $82,900 Active 253 DOM
-
2026-06-18days on market $82,900 Active 251 DOM
-
2026-06-17days on market $82,900 Active 250 DOM
-
2026-06-16days on market $82,900 Active 249 DOM
-
2026-06-15days on market $82,900 Active 248 DOM
-
2026-06-13days on market $82,900 Active 246 DOM
-
2026-06-12days on market $82,900 Active 245 DOM
-
2026-06-09days on market $82,900 Active 242 DOM
-
2026-06-08days on market $82,900 Active 241 DOM
-
2026-06-07days on market $82,900 Active 240 DOM
-
2026-06-05days on market $82,900 Active 238 DOM
-
2026-06-04days on market $82,900 Active 236 DOM
-
2026-06-02days on market $82,900 Active 235 DOM
-
2026-06-01days on market $82,900 Active 234 DOM
-
2026-05-31days on market $82,900 Active 233 DOM
-
2026-04-13price $82,900
-
2025-12-10status Active
-
2025-12-10price $89,900
-
2025-10-24historical Active Under Contract
-
2025-10-10$94,900 Active
ⓘ Source: listings_history table (triggers on properties + properties_extension) + one-shot
backfill from property_details.listing_events for pre-trigger history.
Climate risk First Street
- Flood 4/10 Moderate FEMA zone X (unshaded) · 20% chance over 30 yrs
- Wildfire 7/10 Severe
- Heat 3/10 Moderate 7 d/yr ≥93°F today · 17 d/yr by 30 yrs out
- Wind 1/10 Low
- Air quality 10/10 Extreme 34 unhealthy d/yr today · 36 by 30 yrs out
Nearby sold comps map
Loading sold comps map…
Walkable amenities ~0.75 mi
Loading nearby amenities…
Taxation est. · year 1
- Rental income
- $21,677
- − Mortgage interest
- −$4,644
- − Property taxes
- −$1,244
- − Insurance
- −$414
- − Repairs & maintenance
- −$1,734
- − Management
- −$1,734
- − Depreciation
- −$2,412
- Taxable income
- $9,496
- Est. tax owed @ 24.0%
- −$2,279
- After-tax cash flow
- $7,971/yr
For passive investors: Depreciation is non-cash, so a rental often shows a tax loss while cash-flowing — sheltering income. Rental losses are passive: they offset passive income freely, and up to $25,000/yr can offset ordinary (W-2) income if you actively participate and your MAGI is under $100k (phasing out to $0 by $150k); unused losses carry forward. On sale, claimed depreciation is recaptured at up to 25%, and gains may owe capital-gains tax (a 1031 exchange can defer both). Figures are a year-1 estimate at your 24.0% rate — not tax advice; consult a CPA.
Schools (NCES district)
- District
- Stevensville H S
- NCES district ID
- 3025050
- Math proficiency
- 35% ▲ 15.00%
- Reading proficiency
- 45% ▲ 5.00%
- Median HH income
- $44,518
- Composite
- 36.38/100
- National rank
- #9361
- State rank
- #145 of 339 in MT
Livability — Stevensville
- Score
- 70/100
- State rank
- #71
- US rank
- #7455
Category grades
Schools grade is shown separately in the Schools card above.
Census & demographics
- Population (ZIP)
- 12,247
Population outlook (Ravalli County) Hauer SSP2
- Today (2025)
- 43,584 people
- By 2030
- 44,336 · +1.7%
- By 2040
- 44,760 · +2.7%
- By 2050
- 44,193 · +1.4%
- By 2075
- 42,538 · -2.4%
- By 2100
- 39,079 · -10.3%
Race, ethnicity, and origin ACS 2023
- Neighborhood character
- Predominantly White (90%)
- Race & ethnicity
- White 90% Two or more races 5% Hispanic / Latino 3%
- Common ancestry
- Lithuanian 6% Portuguese 5% Italian 3%
- Foreign-born
- 2% · Canada
- Languages at home
- 97% English-only · Spanish 1% German/W. Germanic 1%
Political lean MEDSL · Ravalli
- 2024 margin
- Solid R (+40.6) · D 28.4% · R 68.9% · Other 2.7%
- 2008→2024 swing
- -19.7pp toward R · 2008: -20.8pp · 2024: -40.6pp
- All cycles
- 2024: R+40.6 2020: R+36.3 2016: R+38.6 2012: R+32.1 2008: R+20.8
Not yet ingested
- Civics
- —
Market trends
- HPI YoY
- ▼ -162.24%
- Current HPI
- 287.3688
- Rent YoY
- —
- Metro
- —
- State GDP YoY
- ▲ 3.41%
- F500 in state
- 2
Industry mix (Fortune 500 HQ in MT)
| Industry | F500 HQs | Revenue |
|---|---|---|
| Technology / Analytics | 1 | $2B |
|
||
Price history
-12.6% since first listed5 events — show timeline
- 2026-04-13 Price Changed $82,900 MRMLS
- 2025-12-10 Relisted — MRMLS
- 2025-12-10 Price Changed $89,900 MRMLS
- 2025-10-24 Contingent — MRMLS
- 2025-10-10 Listed $94,900 MRMLS
Cash-flow waterfall
monthlySold comps — $/sqft
last 12 mo · ≤1 miLoading sold comps…