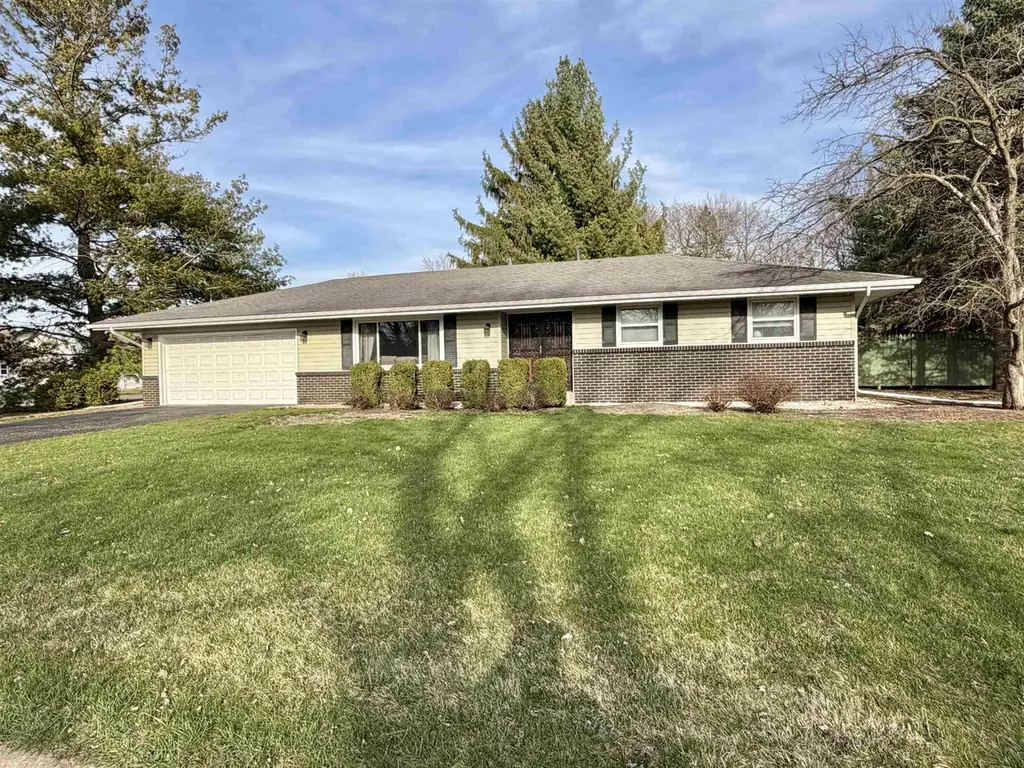
3231 Pepper Ct · Rockford, IL
Flood risk 1/10 · Minimal
- FEMA flood zone
- X (unshaded)
- Chance of flooding over 30 yrs
- 0.0%
- Est. flood insurance / yr
- $473 – $860
Fire risk 1/10 · Minimal
- Est. fire insurance / yr
- $804 – $1,492
Heat risk 2/10 · Minimal
- Hot days now (above 101°F)
- 7 days/yr
- Hot days in 30 yrs
- 15 days/yr
Wind risk 2/10 · Minimal
- Chance of severe wind over 30 yrs
- —
Air-quality risk 3/10 · Minor
- Unhealthy air days now
- 2 days/yr
- Unhealthy air days in 30 yrs
- 3 days/yr
Risk factors via First Street. Map © Google.
Why this score? — see what drove the B grade
The composite is a weighted blend of 9 inputs, each scored 0–100. Each bar is that input's sub-score; the figure is the points it added to the 100-point composite (weight × sub-score).
- Cash flow +29.2/30.0
- ARV discount +12.5/15.0
- DSCR +10.0/10.0
- 1% rule +9.1/10.0
- Livability +3.1/5.0
- Rent growth +2.5/5.0
- Condition / age +2.5/5.0
- Schools +1.2/10.0
- Appreciation +0.0/10.0
$219,900
🖨 Deal sheet 📄 Offer letter ✓ Due diligence
Listing remarks MLS
Beautiful Brick/Vinyl Ranch Home with Mature Trees located on a Private cul de sac street with Park Like professionally landscaped Yard! Slate Entry opens up to a Large Living Room with a Very Big Brand New Thermal Window. Large Open Kitchen with Newer Corian Countertops and Custom Leaded Glass Sliding Door. Oak Hardwoods under hallway and bedroom carpeting. Large Master Bedroom with Double Closets and Private Bath. Privacy Fenced Private Garden Retreat Backyard. Large Family Room with Gas Fireplace and Full Bath in Lower Level. In addition to a 2nd Kitchen, Storage Room and Big Laundry Room with Countertops! Lots of Fresh Paint! Newer furnace & AC in 2009. Newer Roof in 2000. Lots of Enjoyable Space Inside and Out! Won't Last Long!!!
Key facts
- Newer flooring
- Atrium door
- Private backyard
Tags
Neighborhood map
What this means for you Summary
Snapshot
- This is a 3-bed/2.5-bath single-family listed at $220k.
Deal economics
- At list price, monthly cash flow is $764 ($9k/yr) — positive.
- The deal already cash-flows at list — no discount required.
- Meets the 1% rule at list price ($3k rent vs $220k).
- Cap rate 10.5% vs local median 6.1% in Rockford — top-decile yield for the area; either an underpriced asset or a hidden risk that comps aren't pricing in. Stress-test before assuming the spread holds.
Location & tenants
- Location reads 62/100 on livability (#876 in IL) — a middle-class / working-renter tenant base. Strengths: cost of living A+, housing A+, health & safety A+; Watch: schools F, crime F, amenities F.
- Rockford SD 205 (urban): math 12% / reading 16% proficiency, ranked #533 of 620 in IL (top 86%) — low school quality limits family demand, transient renter base, plan for 1-2y turnover; 73% free/reduced lunch — lower-income household profile, screen leases tightly.
- Market conditions: 74 active listings in the ZIP; 3 comparable units currently listed for rent nearby; rentals leasing fast (median 13d on market — plan ~1-2 weeks tenant-placement turnaround); 285 units permitted in Winnebago County in 2024 (0 in 5+ unit buildings).
Forward outlook
- Local home prices are declining (-3.0%/yr); year-one equity from $2k of loan paydown is wiped out by about $7k of value loss. Plan a longer hold.
- Winnebago County population projected at -20% by 2050 — secular population decline; favor cash flow + early exit over multi-decade hold.
- At projected returns (-3.0% appreciation + 3.0% rent growth), your $62k cash investment doubles in ~8 years — after that, you're playing with house money.
Negotiation context
- Only 1 days on market — expect competitive offers; lowballing is unlikely to land.
- 4 sale attempts since 9y ago with the ask held roughly flat each time — persistent listings suggest the price (not the market) is what's stuck; bring a comps-based counter.
- Current owner paid $108k; list at $220k implies a 104% gain — meaningful room to come down on a strong offer.
Questions for the listing agent
- Built in 1967 — when were the roof, HVAC, electrical panel, plumbing, and water heater last replaced?
- Is there a deadline driving the sale (1031 exchange, divorce, estate, relocation)? That informs how much negotiation room exists.
- Schools are F-rated, which usually means shorter tenancies and higher turnover. Who's the typical renter profile here, and what's been the actual vacancy rate?
- Crime grade is F in this area — have there been break-ins, vandalism, or insurance claims at this property in the last 3 years? What carrier currently insures it and at what premium?
- What's the average days-on-market for RENTAL listings here right now (not sales)? A rising rental-DOM trend means longer vacancies and softer asking-rent achievability than the comps imply.
- What's the recent tenant-quality profile in this submarket — average credit score on applications, eviction rate, late-payment / NSF rate, and stable-employment percentage? A property-management company in the area should have these aggregated.
- How much new for-sale + rental construction is in the pipeline within 1–3 miles? Heavy new supply typically softens prices + rents 12–24 months out; constrained supply supports both.
Investment metrics
- 1% rule
- 1.41% ✓
- Cap rate
- 10.46%
- Cash-on-cash
- 14.90%
- DSCR
- 1.66
- GRM
- 5.9
CMA / ARV
- ARV (on-the-fly)
- $247,445
- Comps found
- 12
Show comp detail 12 sales within ~0.75 mi
| Address | Dist | Beds/Ba | Sqft | Sold | Price | $/sf | Match |
|---|---|---|---|---|---|---|---|
| 3231 Pepper Ct | 0.00mi | 3/2.5 | 2,045 (0%) | 1mo | $235,000 | $115 | 99 |
| 3429 Sage Dr | 0.47mi | 3/2.5 | 2,080 (+2%) | 11mo | $249,000 | $120 | 66 |
| 4935 Cardamon Ln | 0.38mi | 3/1.5 | 1,988 (-3%) | 11mo | $224,900 | $113 | 64 |
| 3087 Cheroakwood Ln | 0.34mi | 4/3.0 (+1) | 2,282 (+12%) | 2mo | $291,000 | $128 | 56 |
| 3970 Pepper Dr | 0.57mi | 4/2.5 (+1) | 2,208 (+8%) | 1mo | $293,000 | $133 | 54 |
| 3815 Cass Ct | 0.51mi | 3/2.0 | 1,856 (-9%) | 6mo | $200,000 | $108 | 54 |
| 3215 Pecan St | 0.36mi | 3/2.0 | 1,771 (-13%) | 6mo | $210,500 | $119 | 54 |
| 3309 Sage Dr | 0.43mi | 4/2.0 (+1) | 1,892 (-8%) | 9mo | $277,000 | $146 | 53 |
| 3833 Pepper Dr | 0.65mi | 4/3.0 (+1) | 1,918 (-6%) | 1mo | $294,000 | $153 | 52 |
| 3107 Sunnyside Dr | 0.73mi | 3/2.5 | 2,120 (+4%) | 11mo | $202,000 | $95 | 50 |
| 4113 Eaton Dr | 0.53mi | 3/2.5 | 2,309 (+13%) | 8mo | $280,000 | $121 | 48 |
| 5307 Gingeridge Ln | 0.75mi | 3/2.0 | 1,808 (-12%) | 10mo | $286,000 | $158 | 36 |
Match score weights: distance 35% · size 25% · config 20% · recency 20%. Top-matched comps best support the ARV.
Projected returns pro-forma
-3.0% appreciation · 3.0% rent growth · sell at horizon
- IRR
- 5.5%
- Equity multiple
- 1.21×
- Total profit
- $13,204
- Equity at exit
- $32,788
- IRR
- 15.0%
- Equity multiple
- 2.21×
- Total profit
- $74,807
- Equity at exit
- $19,013
Cash invested: $61,572 (down + closing). Projections, not guarantees.
Landlord ↔ Tenant lean methodology
- Overall (STATE)
- 43 Moderately Tenant-Leaning
- State Illinois
- 43 Moderately Tenant-Leaning · D+7
- County
- — inherits STATE
- City
- — inherits STATE
ZIP-level market 61114
- Home prices YoY
- -27.1%
- Active inventory
- 74
- Price-to-rent
- 5.9×
Monthly cashflow live
- Estimated rent
- $3,109 medium interval (Pro) →
- Mortgage (P&I)
- −$1,153
- Tax from tax record
- −$447 /mo · $5,362/yr
- Insurance
- −$92
- HOA
- −$0
- Vacancy / Maint / Mgmt
- −$653
- Net cashflow
- $764
Break-even live
UW: 25.0% down · 7.5% · 30yr · 1.5% tax · 5.0% vac · 8.0% maint · 8.0% mgmt
Financing live
Cash to close
- Down payment
- $54,975
- Closing costs
- $6,597
- Reserves months
- —
- Total cash needed
- —
Loan-product check · same deal, 3 products live
Conventional
25% down · 7.5% · 30yr
- Down + closing
- —
- Monthly P&I
- —
- Monthly cashflow
- —
- DSCR
- —
- Eligible?
- —
Personal DTI + credit; lowest rate.
DSCR
20% down · 8.5% · 30yr
- Down + closing
- —
- Monthly P&I
- —
- Monthly cashflow
- —
- DSCR
- —
- Eligible?
- —
No personal income docs; deal must DSCR.
Hard money
10% down · 12.0% · 12mo
- Down + closing
- —
- Monthly P&I
- —
- Monthly cashflow
- —
- DSCR
- —
- Eligible?
- —
Short-term bridge; refi at stabilization.
Rent comps 3 comps
| Address | Beds | Baths | Sqft | Rent | $/sqft | DOM | Units | Dist |
|---|---|---|---|---|---|---|---|---|
| 4016 Eaton Dr Unit 1232695P Rockford, IL | 3.0 | 3.0 | 1722 | $4,169 | $2.42 | 13d | 1 | 0.58mi |
| 3121 Carefree Dr Rockford, IL | 4.0 | 2.5 | 3000 | $2,800 | $0.93 | 43d | 1 | 0.66mi |
| 5548 Spring Brook Rd Unit 5548 Rockford, IL | 2.0 | 2.0 | 1730 | $1,650 | $0.95 | 13d | 1 | 1.00mi |
Listing history 14 events
-
2026-04-04status Pending
-
2026-04-02$219,900 Active
-
2026-04-02Active
-
2026-04-02historical
-
2017-07-10soldstatus $108,000
-
2017-07-07soldstatus $108,000 Closed Sale 756-char remark
Show marketing remark (756 chars)
Beautiful Brick/Vinyl Ranch Home with Mature Trees located on a Private cul de sac street with Park Like professionally landscaped Yard! Slate Entry opens up to a Large Living Room with a Very Big Brand New Thermal Window. Large Open Kitchen with Newer Corian Countertops and Custom Leaded Glass Sliding Door. Oak Hardwoods under hallway and bedroom carpeting. Large Master Bedroom with Double Closets and Private Bath. Privacy Fenced Private Garden Retreat Backyard. Large Family Room with Gas Fireplace and Full Bath in Lower Level. In addition to a 2nd Kitchen, Storage Room and Big Laundry Room with Countertops! Lots of Fresh Paint! Newer furnace & AC in 2009. Newer Roof in 2000. Lots of Enjoyable Space Inside and Out! Won't Last Long!!!
-
2017-07-07soldstatus $108,000
Show marketing remark (756 chars)
Beautiful Brick/Vinyl Ranch Home with Mature Trees located on a Private cul de sac street with Park Like professionally landscaped Yard! Slate Entry opens up to a Large Living Room with a Very Big Brand New Thermal Window. Large Open Kitchen with Newer Corian Countertops and Custom Leaded Glass Sliding Door. Oak Hardwoods under hallway and bedroom carpeting. Large Master Bedroom with Double Closets and Private Bath. Privacy Fenced Private Garden Retreat Backyard. Large Family Room with Gas Fireplace and Full Bath in Lower Level. In addition to a 2nd Kitchen, Storage Room and Big Laundry Room with Countertops! Lots of Fresh Paint! Newer furnace & AC in 2009. Newer Roof in 2000. Lots of Enjoyable Space Inside and Out! Won't Last Long!!!
-
2017-06-12status Pending 756-char remark
Show marketing remark (756 chars)
Beautiful Brick/Vinyl Ranch Home with Mature Trees located on a Private cul de sac street with Park Like professionally landscaped Yard! Slate Entry opens up to a Large Living Room with a Very Big Brand New Thermal Window. Large Open Kitchen with Newer Corian Countertops and Custom Leaded Glass Sliding Door. Oak Hardwoods under hallway and bedroom carpeting. Large Master Bedroom with Double Closets and Private Bath. Privacy Fenced Private Garden Retreat Backyard. Large Family Room with Gas Fireplace and Full Bath in Lower Level. In addition to a 2nd Kitchen, Storage Room and Big Laundry Room with Countertops! Lots of Fresh Paint! Newer furnace & AC in 2009. Newer Roof in 2000. Lots of Enjoyable Space Inside and Out! Won't Last Long!!!
-
2017-05-25historical Contingent 756-char remark
Show marketing remark (756 chars)
Beautiful Brick/Vinyl Ranch Home with Mature Trees located on a Private cul de sac street with Park Like professionally landscaped Yard! Slate Entry opens up to a Large Living Room with a Very Big Brand New Thermal Window. Large Open Kitchen with Newer Corian Countertops and Custom Leaded Glass Sliding Door. Oak Hardwoods under hallway and bedroom carpeting. Large Master Bedroom with Double Closets and Private Bath. Privacy Fenced Private Garden Retreat Backyard. Large Family Room with Gas Fireplace and Full Bath in Lower Level. In addition to a 2nd Kitchen, Storage Room and Big Laundry Room with Countertops! Lots of Fresh Paint! Newer furnace & AC in 2009. Newer Roof in 2000. Lots of Enjoyable Space Inside and Out! Won't Last Long!!!
-
2017-05-13$114,900 New 756-char remark
Show marketing remark (756 chars)
Beautiful Brick/Vinyl Ranch Home with Mature Trees located on a Private cul de sac street with Park Like professionally landscaped Yard! Slate Entry opens up to a Large Living Room with a Very Big Brand New Thermal Window. Large Open Kitchen with Newer Corian Countertops and Custom Leaded Glass Sliding Door. Oak Hardwoods under hallway and bedroom carpeting. Large Master Bedroom with Double Closets and Private Bath. Privacy Fenced Private Garden Retreat Backyard. Large Family Room with Gas Fireplace and Full Bath in Lower Level. In addition to a 2nd Kitchen, Storage Room and Big Laundry Room with Countertops! Lots of Fresh Paint! Newer furnace & AC in 2009. Newer Roof in 2000. Lots of Enjoyable Space Inside and Out! Won't Last Long!!!
-
2017-05-12$114,900
-
2010-09-15soldstatus $99,900
-
1990-05-22soldstatus $71,000
-
1990-05-22soldstatus $71,000
ⓘ Source: listings_history table (triggers on properties + properties_extension) + one-shot
backfill from property_details.listing_events for pre-trigger history.
Tax reassessment forecast IL · Partial reset (capped growth)
- Current annual tax
- $5,362 · $447/mo
- Projected year-2 tax
- $5,362 · $447/mo
- Expected delta
- $0/yr ($0/mo · 0.0%)
ⓘ Screening estimate from a state-policy table — verify with the county assessor before closing.
Climate risk First Street
- Flood 1/10 Low FEMA zone X (unshaded) · 0% chance over 30 yrs
- Wildfire 1/10 Low
- Heat 2/10 Low 7 d/yr ≥101°F today · 15 d/yr by 30 yrs out
- Wind 2/10 Low
- Air quality 3/10 Moderate 2 unhealthy d/yr today · 3 by 30 yrs out
Nearby sold comps map
Loading sold comps map…
Walkable amenities ~0.75 mi
Loading nearby amenities…
Taxation est. · year 1
- Rental income
- $37,307
- − Mortgage interest
- −$12,318
- − Property taxes
- −$5,362
- − Insurance
- −$1,100
- − Repairs & maintenance
- −$2,985
- − Management
- −$2,985
- − Depreciation
- −$6,397
- Taxable income
- $6,161
- Est. tax owed @ 24.0%
- −$1,479
- After-tax cash flow
- $7,694/yr
For passive investors: Depreciation is non-cash, so a rental often shows a tax loss while cash-flowing — sheltering income. Rental losses are passive: they offset passive income freely, and up to $25,000/yr can offset ordinary (W-2) income if you actively participate and your MAGI is under $100k (phasing out to $0 by $150k); unused losses carry forward. On sale, claimed depreciation is recaptured at up to 25%, and gains may owe capital-gains tax (a 1031 exchange can defer both). Figures are a year-1 estimate at your 24.0% rate — not tax advice; consult a CPA.
Schools (NCES district)
- District
- Rockford SD 205
- NCES district ID
- 1734510
- Math proficiency
- 12% ▼ -2.00%
- Reading proficiency
- 16% ▼ -3.00%
- Median HH income
- $42,533
- Composite
- 12.21/100
- National rank
- #9649
- State rank
- #533 of 620 in IL
Livability — Rockford
- Score
- 62/100
- State rank
- #876
- US rank
- #17035
Category grades
Schools grade is shown separately in the Schools card above.
Census & demographics
- Census place
- Rockford, IL
- City population
- 147,297
- Population (ZIP)
- 15,026
Population outlook (Winnebago County) Hauer SSP2
- Today (2025)
- 271,080 people
- By 2030
- 260,684 · -3.8%
- By 2040
- 238,405 · -12.1%
- By 2050
- 216,129 · -20.3%
- By 2075
- 172,882 · -36.2%
- By 2100
- 135,336 · -50.1%
Race, ethnicity, and origin ACS 2023
- Neighborhood character
- Predominantly White (72%)
- Race & ethnicity
- White 72% Hispanic / Latino 11% Black 10% Two or more races 6% Asian 4%
- Hispanic origin (detail)
- Mexican 10%
- Common ancestry
- Romanian 5% Portuguese 3% Lithuanian 2%
- Foreign-born
- 10% · Canada, Vietnam
- Languages at home
- 85% English-only · Spanish 7% Russian/Polish/Slavic 2% Other Indo-European 2%
Political lean MEDSL · Winnebago
- 2024 margin
- Toss-up / Even · D 49.5% · R 49.0% · Other 1.5%
- 2008→2024 swing
- -12.2pp toward R · 2008: 12.8pp · 2024: 0.6pp
- All cycles
- 2024: D+0.6 2020: D+2.5 2016: R+1.2 2012: D+5.7 2008: D+12.8
Not yet ingested
- Civics
- —
Market trends
- HPI YoY
- ▼ -84.00%
- Current HPI
- 225.8485
- Rent YoY
- —
- Metro
- —
- State GDP YoY
- ▲ 1.59%
- F500 in state
- 60
Industry mix (Fortune 500 HQ in IL)
| Industry | F500 HQs | Revenue |
|---|---|---|
| Insurance | 4 | $201B |
|
||
| Consumer Goods | 4 | $87B |
|
||
| Industrial Machinery | 3 | $64B |
|
||
| Healthcare | 2 | $55B |
|
||
| Retail / Pharmacy | 1 | $148B |
|
||
| Agriculture / Food | 1 | $86B |
|
||
Price history
+209.7% since first listed14 events — show timeline
- 2026-04-04 Pending — NWIAR
- 2026-04-02 Listing Removed — MRED as Distributed by MLS Grid
- 2026-04-02 Listed — MRED as Distributed by MLS Grid
- 2026-04-02 Listed $219,900 NWIAR
- 2017-07-10 Sold (Public Records) $108,000 Public Records
- 2017-07-07 Sold (MLS) $108,000 MRED as Distributed by MLS Grid
- 2017-07-07 Sold (MLS) $108,000 NWIAR
- 2017-06-12 Pending — MRED as Distributed by MLS Grid
- 2017-05-25 Contingent — MRED as Distributed by MLS Grid
- 2017-05-13 Listed $114,900 MRED as Distributed by MLS Grid
- 2017-05-12 Listed $114,900 NWIAR
- 2010-09-15 Sold (Public Records) $99,900 Public Records
- 1990-05-22 Sold (Public Records) $71,000 Public Records
- 1990-05-22 Sold (Public Records) $71,000 Public Records
Property tax history
+3.0%/yrLatest (2024): $5,362 · +3.5% YoY. Source: county tax records.
Cash-flow waterfall
monthlySold comps — $/sqft
last 12 mo · ≤1 miLoading sold comps…