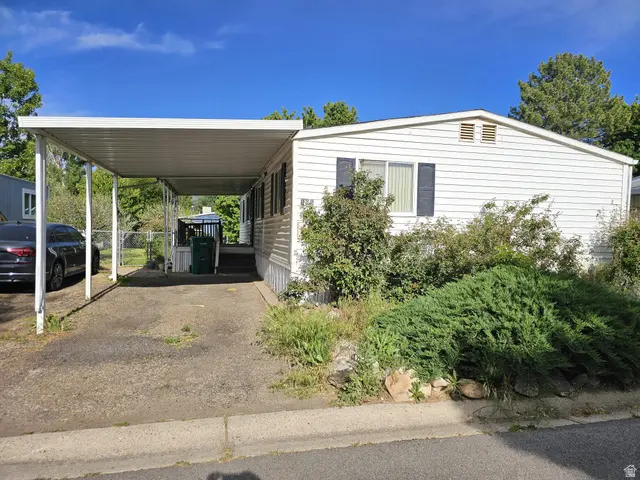
2875 N Hill Field Rd #195 · Layton, UT
Flood risk No data
- FEMA flood zone
- —
- Chance of flooding over 30 yrs
- —
- Est. flood insurance / yr
- —
Fire risk No data
- Est. fire insurance / yr
- —
Heat risk No data
- Hot days now (above threshold)
- —
- Hot days in 30 yrs
- —
Wind risk No data
- Chance of severe wind over 30 yrs
- —
Air-quality risk No data
- Unhealthy air days now
- —
- Unhealthy air days in 30 yrs
- —
Risk factors via First Street. Map © Google.
Why this score? — see what drove the B- grade
The composite is a weighted blend of 9 inputs, each scored 0–100. Each bar is that input's sub-score; the figure is the points it added to the 100-point composite (weight × sub-score).
- Cash flow +26.4/30.0
- 1% rule +10.0/10.0
- DSCR +9.0/10.0
- ARV discount +7.5/15.0
- Livability +4.3/5.0
- Schools +4.1/10.0
- Rent growth +2.8/5.0
- Condition / age +2.5/5.0
- Appreciation +0.0/10.0
$59,900
🖨 Deal sheet 📄 Offer letter ✓ Due diligence
Listing remarks
This Beautiful 3 bed 2 bath home is located in a wonderful park just minutes from HAFB. It features a covered deck with a great fenced in yard. This move in ready home has been mostly updated Square footage figures are provided as a courtesy estimate only and were obtained from Davis County Assessors Office. Buyer is advised to obtain an independent measurement. All buyers must be approved with the park.
Key facts
- Covered deck
- Move in ready
- Fenced in yard
Tags
Property features AI
Finance
- Other: Lot includes fruit trees and mature trees; Zoning: R1; Has a view
- HOA & community: Homeowners association with monthly fee of $1,150; Association managed by Park Manager
Exterior
- Parking: 2 total parking spaces; 2 open parking spaces
- Utilities: Natural gas connected; Electricity connected; Sewer connected; Culinary (public) water
- Home design: Manufactured home; Faces west; Residential use
- Construction: Aluminum exterior; Flat roof; Built/standing condition
- Exterior features: Partially fenced yard; Covered deck; Mountain view
Interior
- Kitchen: Updated kitchen
- Bedrooms: 3 bedrooms on the main level
- Flooring: Carpet; Laminate
- Bathrooms: 1 full bathroom; 1 three-quarter bathroom
- Heating & cooling: Forced air heating (gas central); Central air conditioning
- Interior features: Walk-in closet; Updated kitchen
Neighborhood map
What this means for you Summary
Snapshot
- This is a 4-bed/2.0-bath manufactured listed at $60k.
Deal economics
- At list price, monthly cash flow is $157 ($2k/yr) — positive.
- The deal already cash-flows at list — no discount required.
- Meets the 1% rule at list price ($2k rent vs $60k).
- Recommended offer: $59k (1.5% below list) — sets the bar for market timing.
Location & tenants
- Location reads 86/100 on livability (#11 in UT, #457 nationally) — a professional / high-income tenant draw. Strengths: commute A+, employment A+, housing A+.
- Davis District (suburban): math 43% / reading 47% proficiency, ranked #28 of 80 in UT (top 35%) — families likely to look elsewhere, expect single-tenant / working-renter base with shorter leases; only 19% free/reduced lunch — higher-income household profile.
- Zoned schools: Lincoln School (math 13% / reading 16%, grade F, #559 of 585 statewide, top 96%, 703 students, 42% FRL); North Layton Jr High (math 39% / reading 40%, grade F, #75 of 138 statewide, top 56%, 1,009 students, 30% FRL); Northridge High (math 24% / reading 43%, grade F, #106 of 171 statewide, top 62%, 1,954 students, 23% FRL).
- Zoned-school proficiency averages 29% at this address vs 45% district-wide (-16 pts) — the specific schools serving this property underperform the Davis District average; the district grade overstates school quality for this exact location.
- Market conditions: Rents rising (+1.3%/yr); 342 active listings in the ZIP; 7 comparable units currently listed for rent nearby; rentals at typical pace (median 14d on market — plan ~3-4 weeks tenant-placement turnaround); solid renter incomes; 1,461 units permitted in Davis County in 2024 (508 in 5+ unit buildings).
Forward outlook
- Local home prices are declining (-3.0%/yr); year-one equity from $414 of loan paydown is wiped out by about $2k of value loss. Plan a longer hold.
- Davis County population projected at +39% by 2050 — long-run rental-demand tailwind backs the buy-and-hold thesis.
Negotiation context
- It's been on market 15 days — a 2% lower offer ($59k) is reasonable based on typical stale-listing flexibility.
- 2 sale attempts since 27y ago with the ask held roughly flat each time — persistent listings suggest the price (not the market) is what's stuck; bring a comps-based counter.
Risks & watch-outs
- Watch-outs: HOA is 53% of rent.
Questions for the listing agent
- Built in 1979 — when were the roof, HVAC, electrical panel, plumbing, and water heater last replaced?
- What does the HOA fee cover, when was the last increase, and are there any pending special assessments or reserve-fund shortfalls?
- Is there a deadline driving the sale (1031 exchange, divorce, estate, relocation)? That informs how much negotiation room exists.
- Schools are B-rated — typically a magnet for longer-tenancy family renters. What's the average tenant stay here, and is there a school-zone premium baked into asking?
- What's the average days-on-market for RENTAL listings here right now (not sales)? A rising rental-DOM trend means longer vacancies and softer asking-rent achievability than the comps imply.
- What's the recent tenant-quality profile in this submarket — average credit score on applications, eviction rate, late-payment / NSF rate, and stable-employment percentage? A property-management company in the area should have these aggregated.
- How much new for-sale + rental construction is in the pipeline within 1–3 miles? Heavy new supply typically softens prices + rents 12–24 months out; constrained supply supports both.
Investment metrics
- 1% rule
- 3.64% ✓
- Cap rate
- 9.44%
- Cash-on-cash
- 11.23%
- DSCR
- 1.50
- GRM
- 2.3
CMA / ARV
No comps found within radius.
Projected returns pro-forma
-3.0% appreciation · 1.3% rent growth · sell at horizon
- IRR
- -4.4%
- Equity multiple
- 0.84×
- Total profit
- $-2,632
- Equity at exit
- $8,931
- IRR
- -1.0%
- Equity multiple
- 0.94×
- Total profit
- $-942
- Equity at exit
- $5,179
Cash invested: $16,772 (down + closing). Projections, not guarantees.
Landlord ↔ Tenant lean methodology
- Overall (STATE)
- 86 Strongly Landlord-Friendly
- State Utah
- 86 Strongly Landlord-Friendly · R+15
- County
- — inherits STATE
- City
- — inherits STATE
ZIP-level market 84041
- Rents YoY
- 1.3%
- Active inventory
- 342
- Price-to-rent
- 2.3×
Monthly cashflow live
- Estimated rent
- $2,178 high interval (Pro) →
- Mortgage (P&I)
- −$314
- Tax est. 1.5%
- −$75 /mo · $898/yr
- Insurance
- −$25
- HOA
- −$1,150
- Vacancy / Maint / Mgmt
- −$457
- Net cashflow
- $157
Break-even live
UW: 25.0% down · 7.5% · 30yr · 1.5% tax · 5.0% vac · 8.0% maint · 8.0% mgmt
Financing live
Cash to close
- Down payment
- $14,975
- Closing costs
- $1,797
- Reserves months
- —
- Total cash needed
- —
Loan-product check · same deal, 3 products live
Conventional
25% down · 7.5% · 30yr
- Down + closing
- —
- Monthly P&I
- —
- Monthly cashflow
- —
- DSCR
- —
- Eligible?
- —
Personal DTI + credit; lowest rate.
DSCR
20% down · 8.5% · 30yr
- Down + closing
- —
- Monthly P&I
- —
- Monthly cashflow
- —
- DSCR
- —
- Eligible?
- —
No personal income docs; deal must DSCR.
Hard money
10% down · 12.0% · 12mo
- Down + closing
- —
- Monthly P&I
- —
- Monthly cashflow
- —
- DSCR
- —
- Eligible?
- —
Short-term bridge; refi at stabilization.
Rent comps 7 comps
| Address | Beds | Baths | Sqft | Rent | $/sqft | DOM | Units | Dist |
|---|---|---|---|---|---|---|---|---|
| 2899 N 1150 W Layton, UT | 3.0 | 2.5 | 1410 | $1,825 | $1.29 | 23d | 1 | 0.47mi |
| 1100 S 2000 E Clearfield, UT | 1.0–3.0 | 1.0–2.0 | 895 | $1,952 | $2.18 | 13d | 32 | 0.69mi |
| 1902 E 700 S Clearfield, UT | 1.0–3.0 | 1.0–2.0 | 1085 | $2,415 | $2.23 | 13d | 21 | 0.74mi |
| 1300 S 1800 E Clearfield, UT | 1.0–3.0 | 1.0–2.0 | 1113 | $2,197 | $1.97 | 14d | 20 | 0.74mi |
| 900 S 1500 E Clearfield, UT | 1.0–3.0 | 1.0–2.5 | 1175 | $1,855 | $1.58 | 13d | 7 | 1.06mi |
| 1532 Merlin Way Unit A Layton, UT | 3.0 | 2.0 | 1250 | $2,250 | $1.80 | 23d | 1 | 1.30mi |
| 1545 Merlin Way Layton, UT | 3.0 | 1.0 | 1325 | $1,800 | $1.36 | 14d | 1 | 1.33mi |
HOA detail
- Monthly dues
- $1,150 · $13,800/yr
Listing history 12 events
-
2026-06-18days on market $59,900 Active 15 DOM
-
2026-06-17days on market $59,900 Active 14 DOM
-
2026-06-16days on market $59,900 Active 13 DOM
-
2026-06-15days on market $59,900 Active 12 DOM
-
2026-06-14days on market $59,900 Active 10 DOM
-
2026-06-13days on market $59,900 Active 9 DOM
-
2026-06-10days on market $59,900 Active 7 DOM
-
2026-06-09days on market $59,900 Active 6 DOM
-
2026-06-08days on market $59,900 Active 5 DOM
-
2026-06-07days on market $59,900 Active 4 DOM
-
2026-06-05remarks 409-char remark
-
2026-06-05$59,900 Active 1 DOM
ⓘ Source: listings_history table (triggers on properties + properties_extension) + one-shot
backfill from property_details.listing_events for pre-trigger history.
Nearby sold comps map
Loading sold comps map…
Walkable amenities ~0.75 mi
Loading nearby amenities…
Taxation est. · year 1
- Rental income
- $26,141
- − Mortgage interest
- −$3,355
- − Property taxes
- −$898
- − Insurance
- −$300
- − Repairs & maintenance
- −$2,091
- − Management
- −$2,091
- − HOA
- −$13,800
- − Depreciation
- −$1,743
- Taxable income
- $1,863
- Est. tax owed @ 24.0%
- −$447
- After-tax cash flow
- $1,437/yr
For passive investors: Depreciation is non-cash, so a rental often shows a tax loss while cash-flowing — sheltering income. Rental losses are passive: they offset passive income freely, and up to $25,000/yr can offset ordinary (W-2) income if you actively participate and your MAGI is under $100k (phasing out to $0 by $150k); unused losses carry forward. On sale, claimed depreciation is recaptured at up to 25%, and gains may owe capital-gains tax (a 1031 exchange can defer both). Figures are a year-1 estimate at your 24.0% rate — not tax advice; consult a CPA.
Schools (NCES district)
- District
- Davis District
- NCES district ID
- 4900210
- Math proficiency
- 43% ▼ -9.00%
- Reading proficiency
- 47% ▼ -5.00%
- Median HH income
- $70,511
- Composite
- 40.59/100
- National rank
- #3698
- State rank
- #28 of 80 in UT
Livability — Layton
- Score
- 86/100
- State rank
- #11
- US rank
- #457
Category grades
Schools grade is shown separately in the Schools card above.
Census & demographics
- Census place
- Layton, UT
- County
- Davis County · 341,755 people
- City population
- 83,689
- Metro
- Ogden-Clearfield, UT
- Population (ZIP)
- 55,180
- Household income
- $89,604
- Rent vs Own
- Severe rent burden
- 1058.0
Population outlook (Davis County) Hauer SSP2
- Today (2025)
- 399,271 people
- By 2030
- 430,528 · +7.8%
- By 2040
- 493,485 · +23.6%
- By 2050
- 555,187 · +39.1%
- By 2075
- 688,589 · +72.5%
- By 2100
- 769,646 · +92.8%
Race, ethnicity, and origin ACS 2023
- Neighborhood character
- Predominantly White (75%)
- Race & ethnicity
- White 75% Hispanic / Latino 17% Two or more races 10% Asian 2% Black 1% Pacific Islander 1%
- Hispanic origin (detail)
- Mexican 12%
- Common ancestry
- Slovak 4% Italian 2% Portuguese 2%
- Foreign-born
- 7% · Canada
- Languages at home
- 86% English-only · Spanish 11% Tagalog/Filipino 1% Other Indo-European 1%
Political lean MEDSL · Davis
- 2024 margin
- Strong R (+24.9) · D 36.0% · R 60.8% · Other 3.2%
- 2008→2024 swing
- +17.4pp toward D · 2008: -42.3pp · 2024: -24.9pp
- All cycles
- 2024: R+24.9 2020: R+27.5 2016: R+23.3 2012: R+61.8 2008: R+42.3
Not yet ingested
- Civics
- —
Market trends
- HPI YoY
- ▼ -173.00%
- Current HPI
- 307.2627
- Rent YoY
- ▲ 1.30%
- Metro
- Ogden-Clearfield, UT
- State GDP YoY
- ▲ 3.54%
- F500 in state
- 2
Industry mix (Fortune 500 HQ in UT)
| Industry | F500 HQs | Revenue |
|---|---|---|
| Financial Services | 1 | $3B |
|
||
Price history
+57.6% since first listed3 events — show timeline
- 2026-06-03 Listed $59,900 WFRMLS
- 2000-02-04 Listing Removed — WFRMLS
- 1999-11-03 Listed $38,000 WFRMLS
Cash-flow waterfall
monthlySold comps — $/sqft
last 12 mo · ≤1 miLoading sold comps…