 🏗️ New Construction
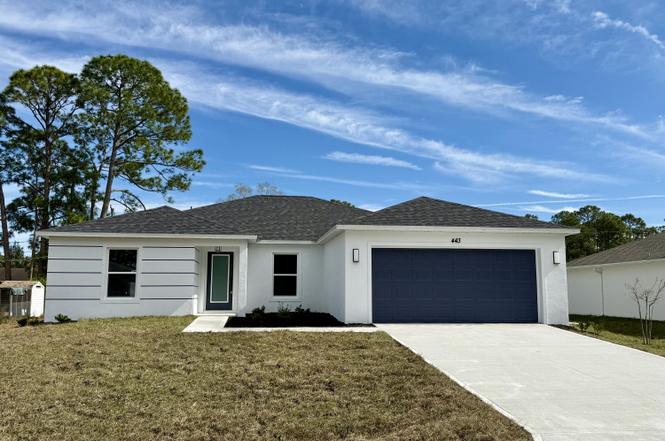
443 Treemont Ave · Palm Bay, FL
Flood risk 1/10 · Minimal
- FEMA flood zone
- X (shaded)
- Chance of flooding over 30 yrs
- 0.0%
- Est. flood insurance / yr
- $507 – $1,088
Fire risk 3/10 · Minor
- Est. fire insurance / yr
- $947 – $1,759
Heat risk 9/10 · Severe
- Hot days now (above 106°F)
- 7 days/yr
- Hot days in 30 yrs
- 20 days/yr
Wind risk 10/10 · Severe
- Chance of severe wind over 30 yrs
- 99.0%
Air-quality risk 1/10 · Minimal
- Unhealthy air days now
- 0 days/yr
- Unhealthy air days in 30 yrs
- 0 days/yr
Risk factors via First Street. Map © Google.
Why this score? — see what drove the F grade
The composite is a weighted blend of 9 inputs, each scored 0–100. Each bar is that input's sub-score; the figure is the points it added to the 100-point composite (weight × sub-score).
- ARV discount +7.5/15.0
- Cash flow +6.8/30.0
- Schools +4.7/10.0
- Livability +3.6/5.0
- Rent growth +2.8/5.0
- Condition / age +2.5/5.0
- 1% rule +1.8/10.0
- DSCR +1.1/10.0
- Appreciation +0.0/10.0
$345,000
🖨 Deal sheet 📄 Offer letter ✓ Due diligence
Listing remarks MLS
NICE WELL WATER/SEPTIC LOT IN A GREAT LOCATION. EASY TO GET TO JUST OFF THE MAIN ROAD. PAVED ROADS THROUGHOUT THE NEIGHBORHOOD. SHORT DRIVE TO SCHOOLS, SHOPPING, POST OFFICE, RESTAURANTS AND MORE! TAKE A DRIVE BY AND HAVE A LOOK!
Key facts
- New construction
- Modern kitchen
- Granite countertops
Tags
Property features AI
Finance
- Other: Pets allowed with no restrictions
- HOA & community: No association amenities
Exterior
- Parking: Attached garage with 2 covered spaces; Driveway parking
- Security: Smoke detector(s)
- Utilities: Well water; Septic tank; Water available
- Home design: Single-family residence; One story; New construction; Faces west; Public road frontage; Paved road access
- Construction: Block/stucco/CBS construction; Slate roof; Built as new construction
- Exterior features: Open porch; Covered porch/patio; Patio
Interior
- Kitchen: Disposal; Dishwasher; Electric range; Microwave; Refrigerator
- Bedrooms: 4 bedrooms on the main level
- Flooring: Carpet; Ceramic tile; Tile
- Bathrooms: 3 full bathrooms (all on the main level)
- Heating & cooling: Central electric heating; Central air conditioning; Roof turbines and ridge vents for ventilation
- Interior features: Kitchen island; Closet cabinetry; Pull-down attic stairs; Cabana bath; Smoke detectors
- Laundry & utility: Laundry area located in the garage; Electric water heater; Water softener (owned)
Neighborhood map
What this means for you Summary
Snapshot
- This is a 4-bed/3.0-bath land listed at $345k.
Deal economics
- At list price, monthly cash flow is $-530 ($-6k/yr) — negative.
- To cash-flow at today's rent, offer at most $268k (22.2% below list).
- To meet the 1% rule (rent ≥ 1% of price), the offer needs to be $235k (32.0% below list).
- Recommended offer: $235k (32.0% below list) — sets the bar for 1% rule.
Location & tenants
- Location reads 72/100 on livability (#366 in FL) — a middle-class / working-renter tenant base. Strengths: cost of living A+, housing A+; Watch: schools C-, employment D+, amenities F.
- Brevard (suburban): math 53% / reading 57% proficiency, ranked #19 of 73 in FL (top 26%) — acceptable for families but not a draw, mixed tenant base, ~2y average lease.
- Market conditions: Rents rising (+1.3%/yr); 1020 active listings in the ZIP; 30 comparable units currently listed for rent nearby; rentals at typical pace (median 24d on market — plan ~3-4 weeks tenant-placement turnaround); solid renter incomes; 4,602 units permitted in Brevard County in 2024 (702 in 5+ unit buildings).
- This rent runs 35% of the median local income ($80k/yr) — at the standard rent-burdened threshold; future hikes will face affordability resistance.
Forward outlook
- Local home prices are declining (-3.0%/yr); year-one equity from $2k of loan paydown is wiped out by about $10k of value loss. Plan a longer hold.
- Brevard County population projected at +15% by 2050 — modest demand growth; plan on rents tracking national, not racing it.
Negotiation context
- It's been on market 144 days — a 12% lower offer ($304k) is reasonable based on typical stale-listing flexibility.
- 2 sale attempts since 8y ago; this cycle's ask has dropped $20k (5%) from the opening price — seller is motivated, your offer sets the floor, not the list.
- Current owner paid $7k; list at $345k implies a 4829% gain — meaningful room to come down on a strong offer.
Risks & watch-outs
- Climate carrying-cost: severe wind risk, 99% chance of damaging wind over 30y; extreme-heat days projected 7→20/yr by 2055 (HVAC capex compounding) — expect insurance premiums to compound above CPI over the hold.
Questions for the listing agent
- What do current leases actually rent for vs. the listed asking? Can we see a recent rent roll and the last 12 months of T-12 income?
- It's been on market 144 days. Have you received any prior offers? Is the seller open to a 32% concession, seller financing, or rate buy-down credit?
- Why hasn't it sold? Are there any deal-killer items the seller is aware of (foundation, flood, title, zoning, code violations)?
- Is there a deadline driving the sale (1031 exchange, divorce, estate, relocation)? That informs how much negotiation room exists.
- The area grade is low — what's the realistic commute time and amenity access for the typical tenant pool here? Any planned neighborhood developments (good or bad) we should know about?
- What's the average days-on-market for RENTAL listings here right now (not sales)? A rising rental-DOM trend means longer vacancies and softer asking-rent achievability than the comps imply.
- What's the recent tenant-quality profile in this submarket — average credit score on applications, eviction rate, late-payment / NSF rate, and stable-employment percentage? A property-management company in the area should have these aggregated.
- How much new for-sale + rental construction is in the pipeline within 1–3 miles? Heavy new supply typically softens prices + rents 12–24 months out; constrained supply supports both.
Investment metrics
- 1% rule
- 0.68% ✗
- Cap rate
- 4.45%
- Cash-on-cash
- -6.58%
- DSCR
- 0.71
- GRM
- 12.2
CMA / ARV
No comps found within radius.
Projected returns pro-forma
-3.0% appreciation · 1.29% rent growth · sell at horizon
- IRR
- -29.6%
- Equity multiple
- 0.03×
- Total profit
- $-93,580
- Equity at exit
- $51,441
- IRR
- -39.4%
- Equity multiple
- -0.45×
- Total profit
- $-140,534
- Equity at exit
- $29,829
Cash invested: $96,600 (down + closing). Projections, not guarantees.
Landlord ↔ Tenant lean methodology
- Overall (STATE)
- 87 Strongly Landlord-Friendly
- State Florida
- 87 Strongly Landlord-Friendly · R+3
- County
- — inherits STATE
- City
- — inherits STATE
ZIP-level market 32908
- Home prices YoY
- -10.4%
- Rents YoY
- 1.3%
- Active inventory
- 1020
- Price-to-rent
- 12.2×
Monthly cashflow live
- Estimated rent
- $2,347 high interval (Pro) →
- Mortgage (P&I)
- −$1,809
- Tax est. 1.5%
- −$431 /mo · $5,175/yr
- Insurance
- −$144
- HOA
- −$0
- Vacancy / Maint / Mgmt
- −$493
- Net cashflow
- $-530
Break-even live
UW: 25.0% down · 7.5% · 30yr · 1.5% tax · 5.0% vac · 8.0% maint · 8.0% mgmt
Financing live
Cash to close
- Down payment
- $86,250
- Closing costs
- $10,350
- Reserves months
- —
- Total cash needed
- —
Loan-product check · same deal, 3 products live
Conventional
25% down · 7.5% · 30yr
- Down + closing
- —
- Monthly P&I
- —
- Monthly cashflow
- —
- DSCR
- —
- Eligible?
- —
Personal DTI + credit; lowest rate.
DSCR
20% down · 8.5% · 30yr
- Down + closing
- —
- Monthly P&I
- —
- Monthly cashflow
- —
- DSCR
- —
- Eligible?
- —
No personal income docs; deal must DSCR.
Hard money
10% down · 12.0% · 12mo
- Down + closing
- —
- Monthly P&I
- —
- Monthly cashflow
- —
- DSCR
- —
- Eligible?
- —
Short-term bridge; refi at stabilization.
Rent comps 30 comps
| Address | Beds | Baths | Sqft | Rent | $/sqft | DOM | Units | Dist |
|---|---|---|---|---|---|---|---|---|
| 487 Wiltshire Ave SW Palm Bay, FL | 3.0 | 2.0 | 1462 | $2,300 | $1.57 | 23d | 1 | 0.29mi |
| 511 Trumpet St SW Palm Bay, FL | 3.0 | 2.0 | 1243 | $2,200 | $1.77 | 23d | 1 | 0.32mi |
| 154 Daffodil Dr SW Palm Bay, FL | 3.0–4.0 | 2.0–3.0 | 1384 | $2,034 | $1.47 | 14d | 6 | 0.51mi |
| 726 Scotten Ave SW Palm Bay, FL | 3.0 | 2.0 | 1443 | $1,970 | $1.37 | 14d | 1 | 0.57mi |
| 171 Okeefe St SE Palm Bay, FL | 3.0 | 2.0 | 1288 | $1,855 | $1.44 | 14d | 1 | 0.68mi |
| 436 Wimpole Ln SW Palm Bay, FL | 4.0 | 2.0 | 1806 | $2,300 | $1.27 | 23d | 1 | 0.82mi |
| 263 Trilby Rd SW Palm Bay, FL | 4.0 | 3.0 | 2000 | $2,500 | $1.25 | 23d | 1 | 0.89mi |
| 309 Cactus St SE Palm Bay, FL | 4.0 | 2.0 | 1846 | $2,195 | $1.19 | 14d | 1 | 0.90mi |
| Town Rd SW Palm Bay, FL | 3.0 | 2.0 | 1600 | $1,995 | $1.25 | 23d | 1 | 0.94mi |
| 191 Turk Rd SW Palm Bay, FL | 4.0 | 2.0 | 1604 | $2,485 | $1.55 | 23d | 1 | 0.95mi |
| 210 Meehan Ave NW Palm Bay, FL | 3.0 | 2.0 | 2020 | $1,895 | $0.94 | 14d | 1 | 0.95mi |
| 497 Schenley St SW Palm Bay, FL | 4.0 | 2.0 | 1833 | $1,995 | $1.09 | 23d | 1 | 0.96mi |
| 320 Algiers Ave SE Palm Bay, FL | 3.0 | 2.0 | 1306 | $1,825 | $1.40 | 23d | 1 | 0.98mi |
| 154 Anderson Ave NE Unit 154 Palm Bay, FL | 3.0 | 2.0 | 1414 | $1,800 | $1.27 | 14d | 1 | 1.06mi |
| 746 Harriet Ave SW Palm Bay, FL | 4.0 | 3.0 | 2155 | $2,550 | $1.18 | 23d | 1 | 1.07mi |
| 272 Aquarius Ave SE Palm Bay, FL | 4.0 | 2.0 | 1650 | $1,995 | $1.21 | 23d | 1 | 1.10mi |
| 857 Buchanan Ave SE Palm Bay, FL | 3.0 | 2.0 | 1257 | $1,950 | $1.55 | 23d | 1 | 1.16mi |
| 1850 Jupiter Blvd SW Unit 20 Palm Bay, FL | 4.0 | 3.0 | 2203 | $2,200 | $1.00 | 23d | 1 | 1.16mi |
| 490 Hatcher St SE Palm Bay, FL | 4.0 | 2.0 | 1833 | $2,150 | $1.17 | 21d | 1 | 1.19mi |
| 914 Caligula Ave SE Palm Bay, FL | 3.0 | 2.0 | 1371 | $1,841 | $1.34 | 14d | 1 | 1.22mi |
| 296 Croquet Ave NE Palm Bay, FL | 4.0 | 2.0 | 2028 | $2,300 | $1.13 | 21d | 1 | 1.22mi |
| 1023 Garvey Rd SW Palm Bay, FL | 4.0 | 2.0 | 1750 | $2,296 | $1.31 | 14d | 1 | 1.24mi |
| 214 Eldron Blvd NE Palm Bay, FL | 3.0 | 2.0 | 1646 | $2,075 | $1.26 | 23d | 1 | 1.26mi |
| 1133 Hanover Ave SW Palm Bay, FL | 4.0 | 2.0 | 1804 | $2,250 | $1.25 | 21d | 1 | 1.36mi |
| 431 Brantley St SE Palm Bay, FL | 3.0 | 2.0 | 1326 | $2,050 | $1.55 | 19d | 1 | 1.37mi |
| 356 Garbelmann St SW Palm Bay, FL | 4.0 | 3.0 | 1850 | $2,121 | $1.15 | 14d | 1 | 1.39mi |
| 276 Americana Blvd NW Palm Bay, FL | 4.0 | 3.0 | 2089 | $2,500 | $1.20 | 23d | 1 | 1.43mi |
| 609 Concha St NW Palm Bay, FL | 4.0 | 2.0 | 1918 | $2,200 | $1.15 | 23d | 1 | 1.45mi |
| 1037 Garvey Rd SW Palm Bay, FL | 4.0 | 3.0 | 1850 | $2,516 | $1.36 | 14d | 1 | 1.46mi |
| 465 Birch Ave SW Palm Bay, FL | 3.0 | 2.0 | 1252 | $2,000 | $1.60 | 23d | 1 | 1.46mi |
Listing history 19 events
-
2026-06-18days on market $345,000 Active 144 DOM
-
2026-06-17days on market $345,000 Active 143 DOM
-
2026-06-16days on market $345,000 Active 142 DOM
-
2026-06-15days on market $345,000 Active 141 DOM
-
2026-06-14pricedays on market $345,000 Active 139 DOM
-
2026-06-10days on market $358,000 Active 136 DOM
-
2026-06-08days on market $358,000 Active 134 DOM
-
2026-06-07days on market $358,000 Active 133 DOM
-
2026-06-05days on market $358,000 Active 130 DOM
-
2026-06-03days on market $358,000 Active 129 DOM
-
2026-06-02days on market $358,000 Active 128 DOM
-
2026-06-01days on market $358,000 Active 127 DOM
-
2026-05-31days on market $358,000 Active 126 DOM
-
2026-05-31days on market $358,000 Active 125 DOM
-
2026-04-29price $358,000
-
2026-01-25$365,000 Active
-
2020-02-06soldstatus $7,000
-
2020-01-31soldstatus $7,000 229-char remark
Show marketing remark (229 chars)
NICE WELL WATER/SEPTIC LOT IN A GREAT LOCATION. EASY TO GET TO JUST OFF THE MAIN ROAD. PAVED ROADS THROUGHOUT THE NEIGHBORHOOD. SHORT DRIVE TO SCHOOLS, SHOPPING, POST OFFICE, RESTAURANTS AND MORE! TAKE A DRIVE BY AND HAVE A LOOK!
-
2018-11-19$7,500 229-char remark
Show marketing remark (229 chars)
NICE WELL WATER/SEPTIC LOT IN A GREAT LOCATION. EASY TO GET TO JUST OFF THE MAIN ROAD. PAVED ROADS THROUGHOUT THE NEIGHBORHOOD. SHORT DRIVE TO SCHOOLS, SHOPPING, POST OFFICE, RESTAURANTS AND MORE! TAKE A DRIVE BY AND HAVE A LOOK!
ⓘ Source: listings_history table (triggers on properties + properties_extension) + one-shot
backfill from property_details.listing_events for pre-trigger history.
Climate risk First Street
- Flood 1/10 Low FEMA zone X (shaded) · 0% chance over 30 yrs
- Wildfire 3/10 Moderate
- Heat 9/10 Extreme 7 d/yr ≥106°F today · 20 d/yr by 30 yrs out
- Wind 10/10 Extreme 99% chance of damaging wind over 30 yrs
- Air quality 1/10 Low 0 unhealthy d/yr today · 0 by 30 yrs out
Nearby sold comps map
Loading sold comps map…
Walkable amenities ~0.75 mi
Loading nearby amenities…
Taxation est. · year 1
- Rental income
- $28,169
- − Mortgage interest
- −$19,325
- − Property taxes
- −$5,175
- − Insurance
- −$1,725
- − Repairs & maintenance
- −$2,254
- − Management
- −$2,254
- − Depreciation
- −$10,036
- Taxable loss
- −$12,599
- Est. tax savings @ 24.0%
- +$3,024
- After-tax cash flow
- $-3,333/yr
For passive investors: Depreciation is non-cash, so a rental often shows a tax loss while cash-flowing — sheltering income. Rental losses are passive: they offset passive income freely, and up to $25,000/yr can offset ordinary (W-2) income if you actively participate and your MAGI is under $100k (phasing out to $0 by $150k); unused losses carry forward. On sale, claimed depreciation is recaptured at up to 25%, and gains may owe capital-gains tax (a 1031 exchange can defer both). Figures are a year-1 estimate at your 24.0% rate — not tax advice; consult a CPA.
Schools (NCES district)
- District
- Brevard
- NCES district ID
- 1200150
- Math proficiency
- 53% ▼ -9.00%
- Reading proficiency
- 57% ▼ -4.00%
- Median HH income
- $49,426
- Composite
- 46.86/100
- National rank
- #2370
- State rank
- #19 of 73 in FL
Livability — Palm Bay
- Score
- 72/100
- State rank
- #366
- US rank
- #6458
Category grades
Schools grade is shown separately in the Schools card above.
Census & demographics
- Census place
- Palm Bay, FL
- County
- Brevard County · 602,871 people
- City population
- 132,211
- Metro
- Palm Bay-Melbourne-Titusville, FL
- Population (ZIP)
- 16,535
- Household income
- $79,596
- Rent vs Own
- Severe rent burden
- 112.0
Population outlook (Brevard County) Hauer SSP2
- Today (2025)
- 623,254 people
- By 2030
- 648,420 · +4.0%
- By 2040
- 690,009 · +10.7%
- By 2050
- 715,669 · +14.8%
- By 2075
- 775,744 · +24.5%
- By 2100
- 776,687 · +24.6%
Race, ethnicity, and origin ACS 2023
- Neighborhood character
- Diverse neighborhood (Simpson 0.69)
- Race & ethnicity
- White 48% Hispanic / Latino 20% Black 20% Two or more races 19%
- Hispanic origin (detail)
- Mexican 1% Puerto Rican 8% Cuban 6% Dominican 3%
- Common ancestry
- Hispanic 3% Estonian 2% Romanian 1%
- Foreign-born
- 10% · Canada, Jamaica, South Korea
- Languages at home
- 87% English-only · Spanish 9% Other Indo-European 1% French/Haitian/Cajun 1%
Political lean MEDSL · Brevard
- 2024 margin
- Strong R (+20.8) · D 39.1% · R 59.9% · Other 1.0%
- 2008→2024 swing
- -10.4pp toward R · 2008: -10.4pp · 2024: -20.8pp
- All cycles
- 2024: R+20.8 2020: R+16.4 2016: R+19.8 2012: R+12.7 2008: R+10.4
Not yet ingested
- Civics
- —
Market trends
- HPI YoY
- ▼ -38.22%
- Current HPI
- 330.0399
- Rent YoY
- ▲ 1.29%
- Metro
- Palm Bay-Melbourne-Titusville, FL
- State GDP YoY
- ▲ 3.28%
- F500 in state
- 36
Industry mix (Fortune 500 HQ in FL)
| Industry | F500 HQs | Revenue |
|---|---|---|
| Industrial Technology | 2 | $29B |
|
||
| Insurance | 2 | $17B |
|
||
| Retail | 1 | $60B |
|
||
| Technology Distribution | 1 | $58B |
|
||
| Homebuilding | 1 | $35B |
|
||
| Technology Manufacturing | 1 | $35B |
|
||
Price history
+4673.3% since first listed5 events — show timeline
- 2026-04-29 Price Changed $358,000 Beaches MLS
- 2026-01-25 Listed $365,000 Beaches MLS
- 2020-02-06 Sold (Public Records) $7,000 Public Records
- 2020-01-31 Sold (MLS) $7,000 SCMLS
- 2018-11-19 Listed $7,500 SCMLS
Property tax history
+14.1%/yrLatest (2025): $366 · +11.3% YoY. Source: county tax records.
Cash-flow waterfall
monthlySold comps — $/sqft
last 12 mo · ≤1 miLoading sold comps…