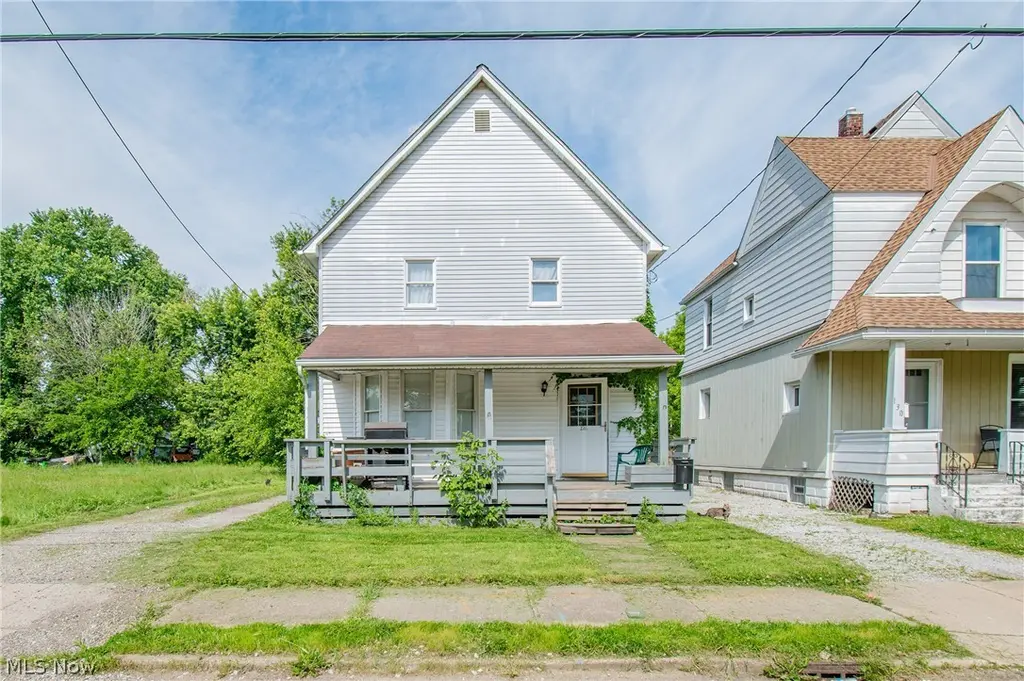
126 14th St NW · Barberton, OH
Flood risk 9/10 · Severe
- FEMA flood zone
- AE
- Chance of flooding over 30 yrs
- 0.99%
- Est. flood insurance / yr
- $2,026 – $9,024
Fire risk 1/10 · Minimal
- Est. fire insurance / yr
- $713 – $1,323
Heat risk 3/10 · Minor
- Hot days now (above 96°F)
- 7 days/yr
- Hot days in 30 yrs
- 17 days/yr
Wind risk 1/10 · Minimal
- Chance of severe wind over 30 yrs
- —
Air-quality risk 2/10 · Minimal
- Unhealthy air days now
- 0 days/yr
- Unhealthy air days in 30 yrs
- 1 days/yr
Risk factors via First Street. Map © Google.
Why this score? — see what drove the B grade
The composite is a weighted blend of 9 inputs, each scored 0–100. Each bar is that input's sub-score; the figure is the points it added to the 100-point composite (weight × sub-score).
- Cash flow +30.0/30.0
- 1% rule +10.0/10.0
- DSCR +10.0/10.0
- ARV discount +7.5/15.0
- Schools +4.1/10.0
- Rent growth +4.0/5.0
- Livability +3.6/5.0
- Condition / age +2.5/5.0
- Appreciation +0.0/10.0
$60,000
🖨 Deal sheet 📄 Offer letter ✓ Due diligence
Listing remarks MLS
Handyman or investor special. Cash only. Newer roof. Large living room and kitchen. Updated cabinets in kitchen. Lots of potential in this colonial. Nice size lot. Come take a look priced to sell quick.
Key facts
- Front deck
- Shopping
- Local amenities
Tags
Property features AI
Finance
- Financial info: Annual taxes noted (not included per instructions)
Exterior
- Parking: No garage; Unpaved parking
- Utilities: Public water; Public sewer
- Home design: 2 stories; Above-grade finished area approximately 1,358 (per assessor)
- Construction: Aluminum siding; Asphalt/fiberglass roof
- Exterior features: Partial fencing; Lot dimensions approximately 35 x 139; Lot size about 0.116 acres
Interior
- Bedrooms: Total of 6 rooms (bedroom count not specified)
- Bathrooms: 1 full bathroom
- Heating & cooling: Forced air gas heating
- Interior features: Full, unfinished basement
Neighborhood map
What this means for you Summary
Snapshot
- This is a 3-bed/1.0-bath single-family listed at $60k.
Deal economics
- At list price, monthly cash flow is $201 ($2k/yr) — positive.
- The deal already cash-flows at list — no discount required.
- Meets the 1% rule at list price ($1k rent vs $60k).
- Cap rate 19.5% vs local median 6.2% in Barberton — top-decile yield for the area; either an underpriced asset or a hidden risk that comps aren't pricing in. Stress-test before assuming the spread holds.
Location & tenants
- Location reads 71/100 on livability (#428 in OH) — a middle-class / working-renter tenant base. Strengths: cost of living A+, housing A+, health & safety A+; Watch: crime C-, amenities F, commute F.
- Barberton City (suburban): math 47% / reading 51% proficiency, ranked #466 of 656 in OH (top 71%) — families likely to look elsewhere, expect single-tenant / working-renter base with shorter leases; 62% free/reduced lunch — lower-income household profile, screen leases tightly.
- Market conditions: Rents rising fast (+5.9%/yr); 219 active listings in the ZIP; 14 comparable units currently listed for rent nearby; rentals at typical pace (median 14d on market — plan ~3-4 weeks tenant-placement turnaround); 1,114 units permitted in Summit County in 2024 (397 in 5+ unit buildings).
Forward outlook
- Local home prices are declining (-3.0%/yr); year-one equity from $415 of loan paydown is wiped out by about $2k of value loss. Plan a longer hold.
- Summit County population projected to shrink 6% by 2050 — rents likely to lag national; underwrite the cash flow, not the appreciation.
- At projected returns (-3.0% appreciation + 5.9% rent growth), your $17k cash investment doubles in ~6 years — after that, you're playing with house money.
Negotiation context
- Only 3 days on market — expect competitive offers; lowballing is unlikely to land.
- 9 sale attempts since 33y ago with the ask held roughly flat each time — persistent listings suggest the price (not the market) is what's stuck; bring a comps-based counter.
- Current owner paid $22k; list at $60k implies a 173% gain — meaningful room to come down on a strong offer.
Risks & watch-outs
- Watch-outs: property tax is 2.8% of price; flood insurance adds $460/mo; built in 1906 — expect roof / HVAC / electrical / plumbing capex.
- Climate carrying-cost: in FEMA flood zone AE (mandatory federal flood insurance) — expect insurance premiums to compound above CPI over the hold.
Questions for the listing agent
- Built in 1906 — when were the roof, HVAC, electrical panel, plumbing, and water heater last replaced?
- Property tax is high relative to price — has the assessment been appealed recently, and will the sale trigger a re-assessment?
- What's the actual annual flood-insurance premium (NFIP or private), and is the property in a SFHA with mandatory coverage?
- Is there a deadline driving the sale (1031 exchange, divorce, estate, relocation)? That informs how much negotiation room exists.
- What's the average days-on-market for RENTAL listings here right now (not sales)? A rising rental-DOM trend means longer vacancies and softer asking-rent achievability than the comps imply.
- What's the recent tenant-quality profile in this submarket — average credit score on applications, eviction rate, late-payment / NSF rate, and stable-employment percentage? A property-management company in the area should have these aggregated.
- How much new for-sale + rental construction is in the pipeline within 1–3 miles? Heavy new supply typically softens prices + rents 12–24 months out; constrained supply supports both.
Investment metrics
- 1% rule
- 2.41% ✓
- Cap rate
- 19.52%
- Cash-on-cash
- 47.23%
- DSCR
- 3.10
- GRM
- 3.5
CMA / ARV
- ARV (on-the-fly)
- $157,528
- Comps found
- 12
Show comp detail 12 sales within ~0.75 mi
| Address | Dist | Beds/Ba | Sqft | Sold | Price | $/sf | Match |
|---|---|---|---|---|---|---|---|
| 76 16th St NW | 0.16mi | 4/1.5 (+1) | 1,360 (+0%) | 1mo | $175,000 | $129 | 85 |
| 219 17th St NW | 0.23mi | 3/1.0 | 1,428 (+5%) | 1mo | $165,000 | $116 | 80 |
| 144 19th St NW | 0.23mi | 4/2.5 (+1) | 1,342 (-1%) | 1mo | $165,000 | $123 | 75 |
| 30 22nd St NW | 0.47mi | 3/2.0 | 1,388 (+2%) | 2mo | $95,000 | $68 | 69 |
| 263 19th St NW | 0.32mi | 3/1.0 | 1,469 (+8%) | 3mo | $115,000 | $78 | 69 |
| 333 17th St NW | 0.41mi | 3/1.0 | 1,270 (-6%) | 2mo | $216,500 | $170 | 68 |
| 36 23rd St SW | 0.60mi | 4/1.5 (+1) | 1,380 (+2%) | 0mo | $139,000 | $101 | 62 |
| 377 Hillsdale Ave | 0.42mi | 2/2.0 (-1) | 1,282 (-6%) | 3mo | $165,000 | $129 | 59 |
| 131 25th St NW | 0.56mi | 3/2.0 | 1,472 (+8%) | 2mo | $155,000 | $105 | 54 |
| 48 20th St SW | 0.46mi | 4/2.0 (+1) | 1,478 (+9%) | 1mo | $135,000 | $91 | 54 |
| 402 Hall Ave | 0.51mi | 3/1.0 | 1,174 (-14%) | 4mo | $95,000 | $81 | 50 |
| 67 25th St NW | 0.61mi | 3/1.5 | 1,200 (-12%) | 0mo | $184,000 | $153 | 50 |
Match score weights: distance 35% · size 25% · config 20% · recency 20%. Top-matched comps best support the ARV.
Projected returns pro-forma
-3.0% appreciation · 5.86% rent growth · sell at horizon
- IRR
- 10.9%
- Equity multiple
- 1.46×
- Total profit
- $7,689
- Equity at exit
- $8,946
- IRR
- 23.8%
- Equity multiple
- 3.57×
- Total profit
- $43,164
- Equity at exit
- $5,188
Cash invested: $16,800 (down + closing). Projections, not guarantees.
Landlord ↔ Tenant lean methodology
- Overall (STATE)
- 73 Landlord-Friendly
- State Ohio
- 73 Landlord-Friendly · R+6
- County
- — inherits STATE
- City
- — inherits STATE
ZIP-level market 44203
- Rents YoY
- 5.9%
- Active inventory
- 219
- Price-to-rent
- 3.5×
Monthly cashflow live
- Estimated rent
- $1,444 high interval (Pro) →
- Mortgage (P&I)
- −$315
- Tax from tax record
- −$140 /mo · $1,675/yr
- Insurance
- −$25
- Flood insurance flood zone
- −$460 /mo · $5,525/yr
- HOA
- −$0
- Vacancy / Maint / Mgmt
- −$303
- Net cashflow
- $201
Break-even live
UW: 25.0% down · 7.5% · 30yr · 1.5% tax · 5.0% vac · 8.0% maint · 8.0% mgmt
Financing live
Cash to close
- Down payment
- $15,000
- Closing costs
- $1,800
- Reserves months
- —
- Total cash needed
- —
Loan-product check · same deal, 3 products live
Conventional
25% down · 7.5% · 30yr
- Down + closing
- —
- Monthly P&I
- —
- Monthly cashflow
- —
- DSCR
- —
- Eligible?
- —
Personal DTI + credit; lowest rate.
DSCR
20% down · 8.5% · 30yr
- Down + closing
- —
- Monthly P&I
- —
- Monthly cashflow
- —
- DSCR
- —
- Eligible?
- —
No personal income docs; deal must DSCR.
Hard money
10% down · 12.0% · 12mo
- Down + closing
- —
- Monthly P&I
- —
- Monthly cashflow
- —
- DSCR
- —
- Eligible?
- —
Short-term bridge; refi at stabilization.
Rent comps 14 comps
| Address | Beds | Baths | Sqft | Rent | $/sqft | DOM | Units | Dist |
|---|---|---|---|---|---|---|---|---|
| 200 8th St NW Barberton, OH | 3.0 | 2.0 | 1144 | $1,550 | $1.35 | 14d | 1 | 0.35mi |
| 667 W Park Ave Barberton, OH | 2.0 | 1.0 | 900 | $1,350 | $1.50 | 14d | 1 | 0.36mi |
| 268 21st St NW Barberton, OH | 2.0 | 1.0 | 1224 | $1,399 | $1.14 | 14d | 1 | 0.38mi |
| 149 2nd St SW Unit 149 Barberton, OH | 2.0 | 1.0 | 1037 | $1,100 | $1.06 | 14d | 1 | 0.84mi |
| 1270 South Ave Barberton, OH | 1.0–2.0 | 1.0–1.5 | 1012 | $1,449 | $1.43 | 14d | 1 | 0.86mi |
| 1285 Wooster Rd W Barberton, OH | 2.0 | 1.0 | 900 | $1,100 | $1.22 | 14d | 1 | 0.88mi |
| 3953 Mount Vernon Blvd Norton, OH | 2.0 | 1.0 | 1000 | $1,318 | $1.32 | 14d | 1 | 0.92mi |
| 3954 Mount Vernon Blvd Norton, OH | 2.0 | 2.0 | 1200 | $1,676 | $1.40 | 14d | 1 | 0.94mi |
| 3943 Long Dr Norton, OH | 2.0 | 1.0–2.0 | 1200 | $1,508 | $1.26 | 14d | 5 | 1.01mi |
| 3888 Long Dr Norton, OH | 2.0 | 2.0 | 1000 | $1,601 | $1.60 | 14d | 1 | 1.08mi |
| 1275 Norton Ave #1283 Norton, OH | 3.0 | 1.0 | 932 | $1,200 | $1.29 | 43d | 1 | 1.17mi |
| 459 Wooster Rd N Unit 469 Barberton, OH | 3.0 | 1.0 | 1782 | $1,000 | $0.56 | 43d | 1 | 1.23mi |
| 543 Otterbein Ave Barberton, OH | 4.0 | 1.0 | 1100 | $1,500 | $1.36 | 14d | 1 | 1.26mi |
| 3343 Columbia Woods Dr Norton, OH | 1.0–2.0 | 1.0–2.0 | 900 | $1,525 | $1.69 | 2d | 9 | 1.38mi |
Listing history 3 events
-
2026-06-07statusdays on market $60,000 Pending 3 DOM
-
2026-06-03remarks 687-char remark
-
2026-06-03$60,000 Active 1 DOM
ⓘ Source: listings_history table (triggers on properties + properties_extension) + one-shot
backfill from property_details.listing_events for pre-trigger history.
Tax reassessment forecast OH · Partial reset (capped growth)
- Current annual tax
- $1,675 · $140/mo
- Projected year-2 tax
- $1,675 · $140/mo
- Expected delta
- $0/yr ($0/mo · 0.0%)
ⓘ Screening estimate from a state-policy table — verify with the county assessor before closing.
Climate risk First Street
- Flood 9/10 Extreme FEMA zone AE · 99% chance over 30 yrs
- Wildfire 1/10 Low
- Heat 3/10 Moderate 7 d/yr ≥96°F today · 17 d/yr by 30 yrs out
- Wind 1/10 Low
- Air quality 2/10 Low 0 unhealthy d/yr today · 1 by 30 yrs out
Nearby sold comps map
Loading sold comps map…
Walkable amenities ~0.75 mi
Loading nearby amenities…
Taxation est. · year 1
- Rental income
- $17,325
- − Mortgage interest
- −$3,361
- − Property taxes
- −$1,675
- − Insurance
- −$5,825
- − Repairs & maintenance
- −$1,386
- − Management
- −$1,386
- − Depreciation
- −$1,745
- Taxable income
- $1,946
- Est. tax owed @ 24.0%
- −$467
- After-tax cash flow
- $1,943/yr
For passive investors: Depreciation is non-cash, so a rental often shows a tax loss while cash-flowing — sheltering income. Rental losses are passive: they offset passive income freely, and up to $25,000/yr can offset ordinary (W-2) income if you actively participate and your MAGI is under $100k (phasing out to $0 by $150k); unused losses carry forward. On sale, claimed depreciation is recaptured at up to 25%, and gains may owe capital-gains tax (a 1031 exchange can defer both). Figures are a year-1 estimate at your 24.0% rate — not tax advice; consult a CPA.
Schools (NCES district)
- District
- Barberton City
- NCES district ID
- 3904353
- Math proficiency
- 47% ▼ -9.00%
- Reading proficiency
- 51% ▼ -9.00%
- Median HH income
- $37,660
- Composite
- 40.77/100
- National rank
- #3646
- State rank
- #466 of 656 in OH
Livability — Barberton
- Score
- 71/100
- State rank
- #428
- US rank
- #7016
Category grades
Schools grade is shown separately in the Schools card above.
Census & demographics
- Census place
- Barberton, OH
- County
- Summit County · 440,783 people
- City population
- 38,701
- Metro
- Akron, OH
- Population (ZIP)
- 38,701
- Household income
- $63,759
- Rent vs Own
- Severe rent burden
- 805.0
Population outlook (Summit County) Hauer SSP2
- Today (2025)
- 546,583 people
- By 2030
- 544,028 · -0.5%
- By 2040
- 531,363 · -2.8%
- By 2050
- 514,923 · -5.8%
- By 2075
- 481,765 · -11.9%
- By 2100
- 432,265 · -20.9%
Race, ethnicity, and origin ACS 2023
- Neighborhood character
- Predominantly White (86%)
- Race & ethnicity
- White 86% Black 7% Two or more races 5% Hispanic / Latino 1%
- Common ancestry
- Romanian 3% Slovak 2% Italian 1%
- Foreign-born
- 2% · Canada
- Languages at home
- 97% English-only · Russian/Polish/Slavic 1% Spanish 1%
Political lean MEDSL · Summit
- 2024 margin
- Lean D (+7.0) · D 53.0% · R 46.0%
- 2008→2024 swing
- -9.6pp toward R · 2008: 16.6pp · 2024: 7.0pp
- All cycles
- 2024: D+7.0 2020: D+9.6 2016: D+8.2 2012: D+14.8 2008: D+16.6
Not yet ingested
- Civics
- —
Market trends
- HPI YoY
- ▼ -224.82%
- Current HPI
- 199.8143
- Rent YoY
- ▲ 5.86%
- Metro
- Akron, OH
- State GDP YoY
- ▲ 1.98%
- F500 in state
- 48
Industry mix (Fortune 500 HQ in OH)
| Industry | F500 HQs | Revenue |
|---|---|---|
| Insurance | 3 | $145B |
|
||
| Industrial Machinery | 3 | $49B |
|
||
| Financial Services | 3 | $24B |
|
||
| Consumer Goods | 2 | $93B |
|
||
| Aerospace / Defense | 2 | $47B |
|
||
| Utilities | 2 | $33B |
|
||
Price history
+570.4% since first listed18 events — show timeline
- 2026-06-02 Listed $60,000 MLSNOW
- 2018-03-14 Sold (MLS) $22,000 MLSNOW
- 2018-02-24 Pending — MLSNOW
- 2018-01-29 Listed $25,000 MLSNOW
- 2008-02-16 Listing Removed — MLSNOW
- 2008-01-16 Sold (MLS) $29,017 MLSNOW
- 2007-11-30 Listed $30,546 MLSNOW
- 2007-10-26 Listing Removed — MLSNOW
- 2007-06-26 Listed $30,546 MLSNOW
- 2007-02-16 Listed $33,600 MLSNOW
- 2001-03-25 Listing Removed — MLSNOW
- 2001-01-26 Listed $59,900 MLSNOW
- 2000-12-20 Listed $22,900 MLSNOW
- 1996-12-24 Listing Removed — MLSNOW
- 1996-06-27 Listed $25,900 MLSNOW
- 1993-08-17 Listing Removed — MLSNOW
- 1993-02-22 Listed $21,900 MLSNOW
- 1986-04-02 Sold (Public Records) $8,950 Public Records
Property tax history
+2.2%/yrLatest (2025): $1,675 · -2.0% YoY. Source: county tax records.
Cash-flow waterfall
monthlySold comps — $/sqft
last 12 mo · ≤1 miLoading sold comps…